Download to read offline


![1 Analytic platforms introduction
In the past few years, the amount of data available to organizations of all kinds
has increased exponentially. Businesses are under the pressure to be able to re-
trieve information that could be leveraged to improve business performance and
to gain competitive advantage. However, processing and data integration is get-
ting more complex due to data variety, volume and velocity. This is the challenge
for most of organizations, as internal changes are necessary in organization, data
management and infrastructure /citebd.
Due to adoption of new technologies, companies hire people with specific
experience and skills in these new technologies. As the most of the technologies
and tools are relatively young, it is expected that skill shortage gap is going to
grow. Ideal candidate should have mix of analytic skills, statistics and coding
experience and such people are difficult to find. By 2018 The United States alone
is going to face a shortage of 140,000 to 190,000 people with analytical expertise
and 1.5 million managers and analysts with the skills to understand and make
decisions based on an analysis of big data [1].
However, the data are not new for organizations. In most cases the data from
mobile devices, log data or sensor data have been available for a long time. A
lot of those data were not previously processed and analyzed even though the
sources of massive amount of data existed in history. Major change in business
perspective happened in last several years with development of distributed an-
alytic platforms. Nowadays, the technologies are available for anyone for an af-
fordable price and a lot of companies have started to look for business cases to
build and use analytical platforms.
Due to the demand, a lot of companies have created their products to help
businesses solve those issues. Companies such as Cloudera, IBM, Microsoft or
Teradata offers solution including software, hardware and enterprise support all
together. However, an initial price is too high for smaller companies, as the price
for a product itself does not takes into consideration companies’ existing systems
and additional data sources and processing or data integration. Data integration
itself is a major expense in data processing projects.
Most technological companies already somehow integrate data and build data
warehouses to ensure simple and unified access to data [2]. However, these data
warehouses are built to secure precise reporting and usually uses technologies
such as relational database management systems (RDBM) that are not designed
for processing of petabytes of data. Companies build data warehouses to achieve
fast, simple and unified reporting. This is mostly performed by aggregating the
data. This approach improve processing speeds and reduce needed storage space.
On the other hand, aggregated data doesn’t allow complex analytics due to a lack
of detail. For analytic purposes data should have the same detail as raw source
data.
When building analytic platform or building complementary solution to an
already existing data warehouse, business must decide if they prefer commercial
2](https://image.slidesharecdn.com/thesis-170323143759/75/Hadoop-as-an-extension-of-DW-9-2048.jpg)
![1. ANALYTIC PLATFORMS INTRODUCTION
third party product with enterprise support or if they are able to build the solu-
tion themselves in-house. Both approaches have advantages and disadvantages.
Main advantage of an in-house solution is the price and modifiability. On the
other hand it can be difficult to find experts with enough experience to develop
and deliver end to end solution and to provide continuous maintenance. Major
disadvantages of buying complete analytical platform is the price as it can hide
additional costs in data integration, maintenance and support.
1.1 New data sources
As new devices are connecting to the network, various data become available,
a large amount of data is hard to manage with common technologies and tools
and to process it within tolerable time. Those new data sources include mobile
phones, tablets, sensors, wearable devices, which number has grown significantly
in last years. All these devices interact with its surrounding or web sites such as
social media and every action can be recorded and logged. New data sources
have following characteristics:
• Volume - As mentioned before, the amount of data is rapidly increasing
every year. According to The Economist [3], the amount of digital infor-
mation increases tenfold every five years.
• Velocity - Interaction with social medias or with mobile applications usu-
ally happens in real time and hence causing continuous data flow. Pro-
cessing real time data can help business make valuable decisions.
• Variety - Data structure can be dynamic and it can change significantly
with any record. Such data include XML or nested JSON and JSON arrays.
However, unstructured or semi structured data are harder to process with
traditional technologies, although these data can contain valuable infor-
mation.
• Veracity - With different data sources, it is getting more difficult to main-
tain data certainty and this issue is more challenging with more volume
and higher velocity.
With increasing volume and complexity of data, integrating and cleaning pro-
cesses get more difficult and companies are integrating new platforms and pro-
cesses to deal with data processing and analytics [4, 5].
1.2 Data warehouse
Data warehouse is a system that allows process data in order to be easily analysable
and queryable. Bill Inmon defined a data warehouse in 1990 as follows:
“A data warehouse is a subject-oriented, integrated, time-variant and non-volatile
collection of data in support of management’s decision making process.” [6]
3](https://image.slidesharecdn.com/thesis-170323143759/75/Hadoop-as-an-extension-of-DW-10-2048.jpg)
![1. ANALYTIC PLATFORMS INTRODUCTION
1.2.2 Extract, transform and load
Extract, transform and load (ETL) [7] is a process of moving data across systems
and databases in order to make them easily analysable. ETL is mostly used in data
warehousing as data that are being loaded into data warehouse are often trans-
formed and cleansed to ensure data quality needed for analysis. ETL describes
three steps of moving data:
• Extract - Process of an extraction of data from a source system. Extraction
can be directly from database or through some API. Extraction can im-
plement complex mechanisms of data extraction to extract only changes
from a database. This process is called change data capture and is one
of the most efficient mechanism for data extraction. Extraction also often
includes extract archiving for audit purposes.
• Transform - Transformation can implement any algorithm or transforma-
tion logic. Data are transformed so they satisfy data model and data qual-
ity needs of data warehouse. This can include data type conversion, data
cleansing or even fuzzy lookups. Usually data from more data sources are
integrated together within this step.
• Load - Process of loading transformed data into data warehouse. Usually
includes loading transformed dimensional and fact tables.
1.2.3 Kimball’s architecture
Ralph Kimball designed individual processes and tasks within a data warehouse
in order to simplify its development and maintenance [8]. The Kimball’s archi-
tecture includes processes used in end to end delivery of a data warehouse. The
whole data warehouse development process starts with gathering users’ require-
ments. Primary goal is to gather metrics which needs to be analyzed in order to
identify data sources and design data model. Then it describes incremental de-
velopment method that focus on continuous delivery as data warehouse project
are rather bigger and it is important to start delivering business value early in
the data warehouse development. Key features of Kimball’s architecture are di-
mensional modelling and identifying fact tables, which are described further in
this thesis. Regarding ETL process, Kimball described steps of an extraction, data
transformation, data cleaning and loading into stage as into temporal storage and
into final data warehouse dimensional and fact tables. All other processes around
data warehouse such as data warehouse security, data management and data
governance are included as well. All together Kimball’s architecture is a quite
simple and understandable framework for data warehouse development.
1.2.3.1 Dimensional modelling
Dimensional modeling [8] is a technique for designing data models simple and
understandable. As most of the business users tend to describe world in the enti-
5](https://image.slidesharecdn.com/thesis-170323143759/75/Hadoop-as-an-extension-of-DW-12-2048.jpg)
![1. ANALYTIC PLATFORMS INTRODUCTION
ties such as product, customer or dates it is reasonable to model the data the same
way.
It is intuitive implementation of data cube that has edges labeled product,
customer and date for example. This implementation allows users to easily slice
the data and breakdown them by different dimensions. Inside of a data cube are
measured metrics. When cube is sliced, metrics are shown, depending on how
many dimensions are sliced.
Implementation of dimensional model is a star schema [8]. In star schema, all
dimensions are tied to fact tables [8]. Therefore in star schema it is easily visible,
which dimensions can be used in for slicing.
Figure 1.1: Star schema example.
Dimensions can also contain different hierarchies and additional attributes.
As the dimension needs to track history, Kimball defines several types [8] of di-
mensions. The most commons are:
• Type one - It does not track historical changes. When a record is changed
in source system, it is updated in dimensions. Therefore only one record
is stored for each natural key.
• Type two - It uses additional attributes such as date effective from and
date effective from to track different versions of record. When record is
changed in source system, new record is inserted into dimensions and
date effective to attribute of old record is updated.
• Type three - It is used to track changes in defined attributes. If history
tracking is needed, two separate attributes are created. One defines cur-
rent state and the second one previous value.
1.2.3.2 Conformed dimensions
One of the key features in data integration are conformed dimensions [8]. These
are dimensions that describes one entity the same way across all integrated data
6](https://image.slidesharecdn.com/thesis-170323143759/75/Hadoop-as-an-extension-of-DW-13-2048.jpg)
![1. ANALYTIC PLATFORMS INTRODUCTION
sources. Main reason for implementation of conformed dimensions is that CRM,
ERP or billing systems can have different attributes and different ways how to
describe business entities such as customer. Dimension conforming is process of
taking all information about an entity and designing the transformation process
in the way that data about the entity from all data sources are merged into one
dimension. Dimension created using this process is called conformed dimension.
Using conformed dimension significantly simplifies business data as all people
involved in the business use the same view on customer and the same definition.
This allows simple data reconsolidation.
Figure 1.2: Dimension table example.
1.2.3.3 Surrogate keys
Surrogate keys [8] ensures identification of individual entities in a dimension.
Usually surrogate keys are implemented as an incremental sequence of integers.
Surrogate keys are used because duplication of natural keys is expected in di-
mension tables as the changes in time need to be tracked, therefore surrogate key
identifies specific version of the record. In addition, more than one natural key
would have to be used in conformed dimension as the data may come from more
data sources. Surrogate keys are predictable and easily manageable as they are
assigned within a data warehouse.
1.2.3.4 Fact tables
Fact tables are tables containing specific events or measures of a business pro-
cess. A fact table has typically two types of columns. Foreign keys of dimension
7](https://image.slidesharecdn.com/thesis-170323143759/75/Hadoop-as-an-extension-of-DW-14-2048.jpg)
![1. ANALYTIC PLATFORMS INTRODUCTION
tables and numeric measures. In an ETL process lookup on dimension tables is
performed and values or keys describing entity in dimension are replaced by sur-
rogate keys from particular dimensions. Fact table is defined by its granularity.
Fact tables should always contain only one level of granularity. Having different
granularity in a fact table could cause issues in measures aggregations. An exam-
ple of fact tables with specific granularity can be table of sales orders and another
one with order items.
Figure 1.3: Fact table example.
While designing fact table it is important to identify business processes that
users want to analyze in order to specify data sources needed. Then follows a
definition of measures such as sale amount or tax amount and a definition of
dimensions that make sense within a business process context.
1.2.4 Business intelligence
Business intelligence (BI) is set of tools and techniques, which goal is to simplify
querying and analysing data sets. Commonly, BI tools are used as a top layer
of data warehouse which is accessible for wide spectrum of users as a lot of BI
techniques do not require advanced technological skills [9].
Business intelligence uses variation of techniques. Depending on a business
requirements different tool or technique is chosen. Therefore BI in companies usu-
ally contains various tools from different providers. Example of BI techniques:
• Online analytical processing (OLAP)
• Reporting
8](https://image.slidesharecdn.com/thesis-170323143759/75/Hadoop-as-an-extension-of-DW-15-2048.jpg)
![1. ANALYTIC PLATFORMS INTRODUCTION
• Dashboards
• Predictive analytics
• Data mining
1.2.4.1 Online analytical processing
Online analytical processing (OLAP) [10, 9] is an approach that achieves faster
response when querying multidimensional data, therefore it is one of the key fea-
tures of companies’ decision system. The main advantage of OLAP is a leverage
of star or snowflake schema structure.
Three types of OLAP exist. If OLAP tool stores data in special structure such
as hash table (SSAS) or multidimensional array on OLAP server then it is called
multidimensional OLAP (MOLAP). MOLAP provides quick response to opera-
tions such as slice, dice, roll-up or drill-down as a tool is able to simply navigate
trough precalculated aggregation to the lowest level.
Among MOLAP, two other types of OLAP tools exist. Those are relational
OLAP (ROLAP), which is based on querying data in relational structure (e.g. in
RDBM). ROLAP is not very common as it does not achieve querying response
time of MOLAP. The third type is hybrid OLAP (HOLAP), which is combination
of MOLAP and ROLAP. One of the popular implementation is precalculating ag-
gregations into MOLAP and keeping underlying data stored in ROLAP, therefore
only when an aggregation is requested, underlying data are not queried.
OLAP is often queried via multidimensional query language such as MDX
either directly or through analytic tool such as Excel1
or Tableau2
. User then only
works with a pivot table and is able to query or filter aggregated and underlying
data depending on OLAP definition.
Some of the OLAP tools include:
• SSAS Microsoft3
.
• Mondrian developed by Pentaho4
.
• SAS OLAP Server5
.
• Oracle OLAP6
.
1. https://products.office.com/en-us/excel
2. http://www.tableausoftware.com/
3. http://www.microsoft.com/en-us/server-cloud/solutions/business-
intelligence/analysis.aspx
4. http://community.pentaho.com/projects/mondrian
5. http://www.sas.com/resources/factsheet/sas-olap-server-factsheet.pdf
6. http://www.oracle.com/technetwork/database/options/olap/index.html
9](https://image.slidesharecdn.com/thesis-170323143759/75/Hadoop-as-an-extension-of-DW-16-2048.jpg)
![1. ANALYTIC PLATFORMS INTRODUCTION
1.2.4.2 Analytics
Analytics is a process of discovering patterns in data and providing insight. As a
multidimensional discipline, analytics includes methodologies from mathemat-
ics, statistics and predictive modeling to retrieve valuable knowledge. Consider-
ing data requirements, often analyses such as initial estimate calculations or data
profiling does not require transformed data. Those analyses can be performed on
slightly cleaned or even on raw data. Bigger impact on an analysis result usually
have chosen subset of data. Therefore data quality processes are usually less strict
than for data that are integrated into a EDW for reporting purposes. However, in
general it is better to perform analyses on cleansed and transformed data.
1.2.4.3 Reporting
Reporting is one of the last parts of a process that starts with discovering useful
data sets within the company and continues through their integration with ETL
process into EDW. This process, together with reports, have to be well designed,
tested and audited as reports are often used for reconsolidation of manual busi-
ness processes. Reports can also be used as official da stock market. Therefore, the
process of cleansing and transformation have to be well documented and precise.
Due to significant requirements on data quality with increasing volume of
data, an ETL processing gets significantly more complex. Having a large amount
of data needed for reporting can cause significant delivery issues.
1.3 Existing technologies in DW
There are many architectural approaches to how to build a data warehouse. For
last 20 years a lot of experts have been improving methodologies and processes
that can be followed. Those methodologies are well known and applicable with
traditional business intelligence and data warehouse technologies. As the method-
ologies are common, companies developing RDBMs such as Oracle or Microsoft
have integrated functionality to make data warehouse development easier. There
is also a lot of ETL frameworks and data warehouse IDEs (such as WhereScape)
that provide higher level of data warehouse development abstraction [7, 9].
Thanks to more than 20 years of continuous development and support from
community, the technology have been adjusted, so developers can focus on busi-
ness needs rather than on technology.
A lot of companies are developing or maintaining data warehouses built to
integrate data from various internal systems such as ERP, CRM or back end sys-
tems. Those data sources are usually built on RDBMs and therefore data are struc-
tured and well defined. However, the ETL process is still necessary. Those data
are not usually bigger than a few gigabytes a day, hence a processing of data
transformations is feasible. After data are transformed and loaded into data ware-
house, data are usually accessed via BI tools for easier data manipulation by data
10](https://image.slidesharecdn.com/thesis-170323143759/75/Hadoop-as-an-extension-of-DW-17-2048.jpg)
![1. ANALYTIC PLATFORMS INTRODUCTION
consumers. Data from different sources are integrated either in data warehouse,
data marts or BI depending on specific architecture.
TDWI performed relevant research about architectural components used in
data warehousing with the following results.
Figure 1.4: Currently used components and plan for the next three years [2].
From results following statements are deductible.
• EDW and data marts are commonly used and will be used even in the
future.
• OLAP and tabular data are one of the key components of a BI.
• Dimensional star schema is preferable method in data modelling.
• RDBMs are used commonly, but it is expected that they will be used less
in the next few years.
11](https://image.slidesharecdn.com/thesis-170323143759/75/Hadoop-as-an-extension-of-DW-18-2048.jpg)
![1. ANALYTIC PLATFORMS INTRODUCTION
• In-memory analytics, columnar databases and Hadoop usage is expected
to grow. However, not all companies are planning to adopt these tech-
nologies as the technologies are used mostly for specific purposes.
Therefore it is expected that usage of new technologies will grow significantly.
Nonetheless, existing basic principles of data warehousing will prevail. Hence,
it is important that new technologies can be completely integrated into existing
data warehouse architecture. This includes both logical and physical architecture
of data warehouse.
Regarding data modelling, currently, most data warehouses use some form of
hybrid architecture [2] that has origin either in Kimball’s architectural approach,
which is often called bottom-up approach and is based on dimensional model-
ing or in Inmon’s top-down approach which prefers building data warehouse
in third normal form [6]. Modeling technique highly depends on development
method used. Inmnon’s third normal form or Data Vaults are preferable for agile
development. Data Vault is combination of both approaches. On the other hand,
Kimball is more suitable for iterative data warehouse development.
While integrating new data sources, a conventional data warehouse faces sev-
eral issues:
• Scalability - Commonly platforms for building data warehouses are RDBMs
such as SQL Server from Microsoft or Oracle database. Databases alone
are not distributed, therefore adding new data sources can cause adding
another server with new database instance. In addition, new processes
have to be designed to support such a distributed environment.
• Price - RDBMs can run almost on any hardware. However, for processing
gigabytes of data and at the same time accessing data for reporting and
analytics, it is necessary to either buy powerful server and software li-
censes or significantly optimize DW processes. Usually all three steps are
necessary. Unfortunately, licenses, servers and people are all expensive
resources.
• Storage space - One of the most expensive parts of the DW is storage.
For the best performance RBMS needs fast accessible storage. Consider-
ing data warehouse environment, where data are stored more than once
in RDBM (e.g. in persistent stage or operational data store), for fault toler-
ance disks are set up in RAID, storage plan needs to be designed precisely
to keep costs low as possible. Data also need to be backed up regularly
and archived.
In addition, historically not many sources were able to provide data in a real
time or close to a real time, therefore traditional batch processing approach was
very convenient. However, business needs output with the lowest latency pos-
sible, especially information for operational intelligence as a business needs to
respond and act. Most suitable process for batch processing is ETL. Nonethe-
less, with real time streaming data it is more convenient to use extract, load and
12](https://image.slidesharecdn.com/thesis-170323143759/75/Hadoop-as-an-extension-of-DW-19-2048.jpg)

![2. PROPOSED ARCHITECTURE
2.1 Architecture overview
Proposed architecture uses Hadoop [11] as an additional system to RDBM that
brings new features that are useful for specific tasks that are expensive on RDBM.
Hadoop is logically implemented as RDBM however it should be used mainly for
processing of big amount of data and streaming real time data.
Figure 2.1: Diagram describing proposed high-level architecture.
Adopting Hadoop framework into existing data warehouse environment brings
several benefits:
• Scalability - Hadoop supports linear scalability. By adding new nodes into
Hadoop cluster we can linearly scale performance and storage space [12].
• Price - As an open source framework, Hadoop is free to use. This how-
ever does not mean that it is inexpensive, as maintaining and developing
applications on Hadoop cluster, hardware and experienced people with
knowledge of this specific technology are expensive. However, generally
Hadoop is significantly cheaper for a terabyte of storage than RDBM as it
run on commodity hardware.
• Modifiability - Another advantage of open source project is modifiabil-
ity. In case some significant functionality is not available, it is possible to
develop it in-house.
15](https://image.slidesharecdn.com/thesis-170323143759/75/Hadoop-as-an-extension-of-DW-22-2048.jpg)
![2. PROPOSED ARCHITECTURE
• Community - A lot of companies as Yahoo, Facebook or Google are sig-
nificantly contributing into Hadoop source codes. Either with developing
and improving new tools or publishing theirs libraries.
Usage of individual Hadoop tools is described in following diagram.
Figure 2.2: Diagram of Hadoop tools usage in EDW architecture.
Hadoop RDBM
Open source Proprietary
Structured and unstructured data Structured only, mostly
Less expensive Expensive
Better for massive full data scans Usage of index lookups
Support for unstructured data Indirect support for unstructured data
No support for transaction processing Support for transaction processing
Table 2.1: Hadoop and RDBS comparsion.
2.2 Multi-Platform DW environment
Existence of core data warehouse is still crucial for reporting and dashboards. It
is also mostly used as a data source for online analytic processing [2]. In order to
solve issues mentioned before, it is convenient to integrate new data platform that
16](https://image.slidesharecdn.com/thesis-170323143759/75/Hadoop-as-an-extension-of-DW-23-2048.jpg)
![2. PROPOSED ARCHITECTURE
will support massive volumes and variety of data. What makes this task difficult
is precise integration of a new platform into an existing DW architecture.
As a data warehousing focuses on data consumers, they should be able to ac-
cess a new platforms the same way and they should feel confident using the new
platform. Using the Kimball’s approach for integrating data on both platforms
gives users the same view on data and also unites other internal data warehouse
processes.
2.3 Hadoop
Hadoop is an open-source software framework for distributed processing which
allows to cheaply store and process vast amounts of structured and unstructured
data. It is designed to scale up from single servers to thousands of machines, each
offering local computation and storage.
High-availability is covered at the application layer, therefore Hadoop does
not rely on hardware to secure data and processing. Hadoop delivers service on
top of a cluster of computers, each of which may be prone to failures.
The framework itself consists of tens of different tools for various purposes
and the number of tools available is growing fast. Three major components of
Hadoop 2.x are Hadoop distributed file system (HDFS), Yet another resource ne-
gotiator (YARN) and MapReduce programming model.
Most relevant tools to data warehousing and analytics include:
• Hive
• Pig
• Sqoop
• Impala
Some other tools are not part of Hadoop, but are well integrated with Hadoop
framework (such as Storm).
2.3.1 HDFS
HDFS was designed to be a scalable, fault-tolerant, distributed storage system
that works closely with MapReduce and runs on commodity hardware.
HDFS has many similarities with existing distributed file systems. How-
ever, the differences from other distributed file systems are significant.
HDFS is highly fault-tolerant and is designed to be deployed on low-cost
hardware. HDFS provides high throughput access to application data and
is suitable for applications that have large data sets. [13]
An HDFS cluster consists of NameNode which manages metadata and DataN-
odes that stores the data. Typically each file is split into large blocks of 64 or 128
17](https://image.slidesharecdn.com/thesis-170323143759/75/Hadoop-as-an-extension-of-DW-24-2048.jpg)
![2. PROPOSED ARCHITECTURE
megabytes and then distributed to DataNodes. HDFS secure high-availability by
replicating and distributing to other nodes. When a block is lost due to failure,
NameNode creates another replica of the block and distributes it automatically
to different DataNode.
2.3.2 YARN
YARN is a cluster management technology and it combines a central resource
manager that reconciles the way applications use Hadoop with node manager
agents that monitor processing on individual DataNodes. Main purpose of YARN
is to allow parallel access and usage of a Hadoop system and resources as until
Hadoop 2.x processing of parallel queries was not possible due to lack of resource
management. YARN opens Hadoop for wider usage.
2.3.3 MapReduce
MapReduce is a software framework that allows developers to write programs
that process massive amounts of structured or unstructured data in parallel across
a distributed cluster. The MapReduce is divided into two major parts:
• Map - The Map function takes a series of key/value pairs, processes each,
and generates zero or more output key/value pairs. The input and output
types of the map can be different from each other.
• Reduce - The input for each Reduce is pulled from the machine where the
Map ran and sorted using the application’s sorting function. Number of
Reducers does not depend on number of Map functions.
MapReduce framework works closely with Hadoop, however, MapReduce
programming paradigm can be used with any programming language.
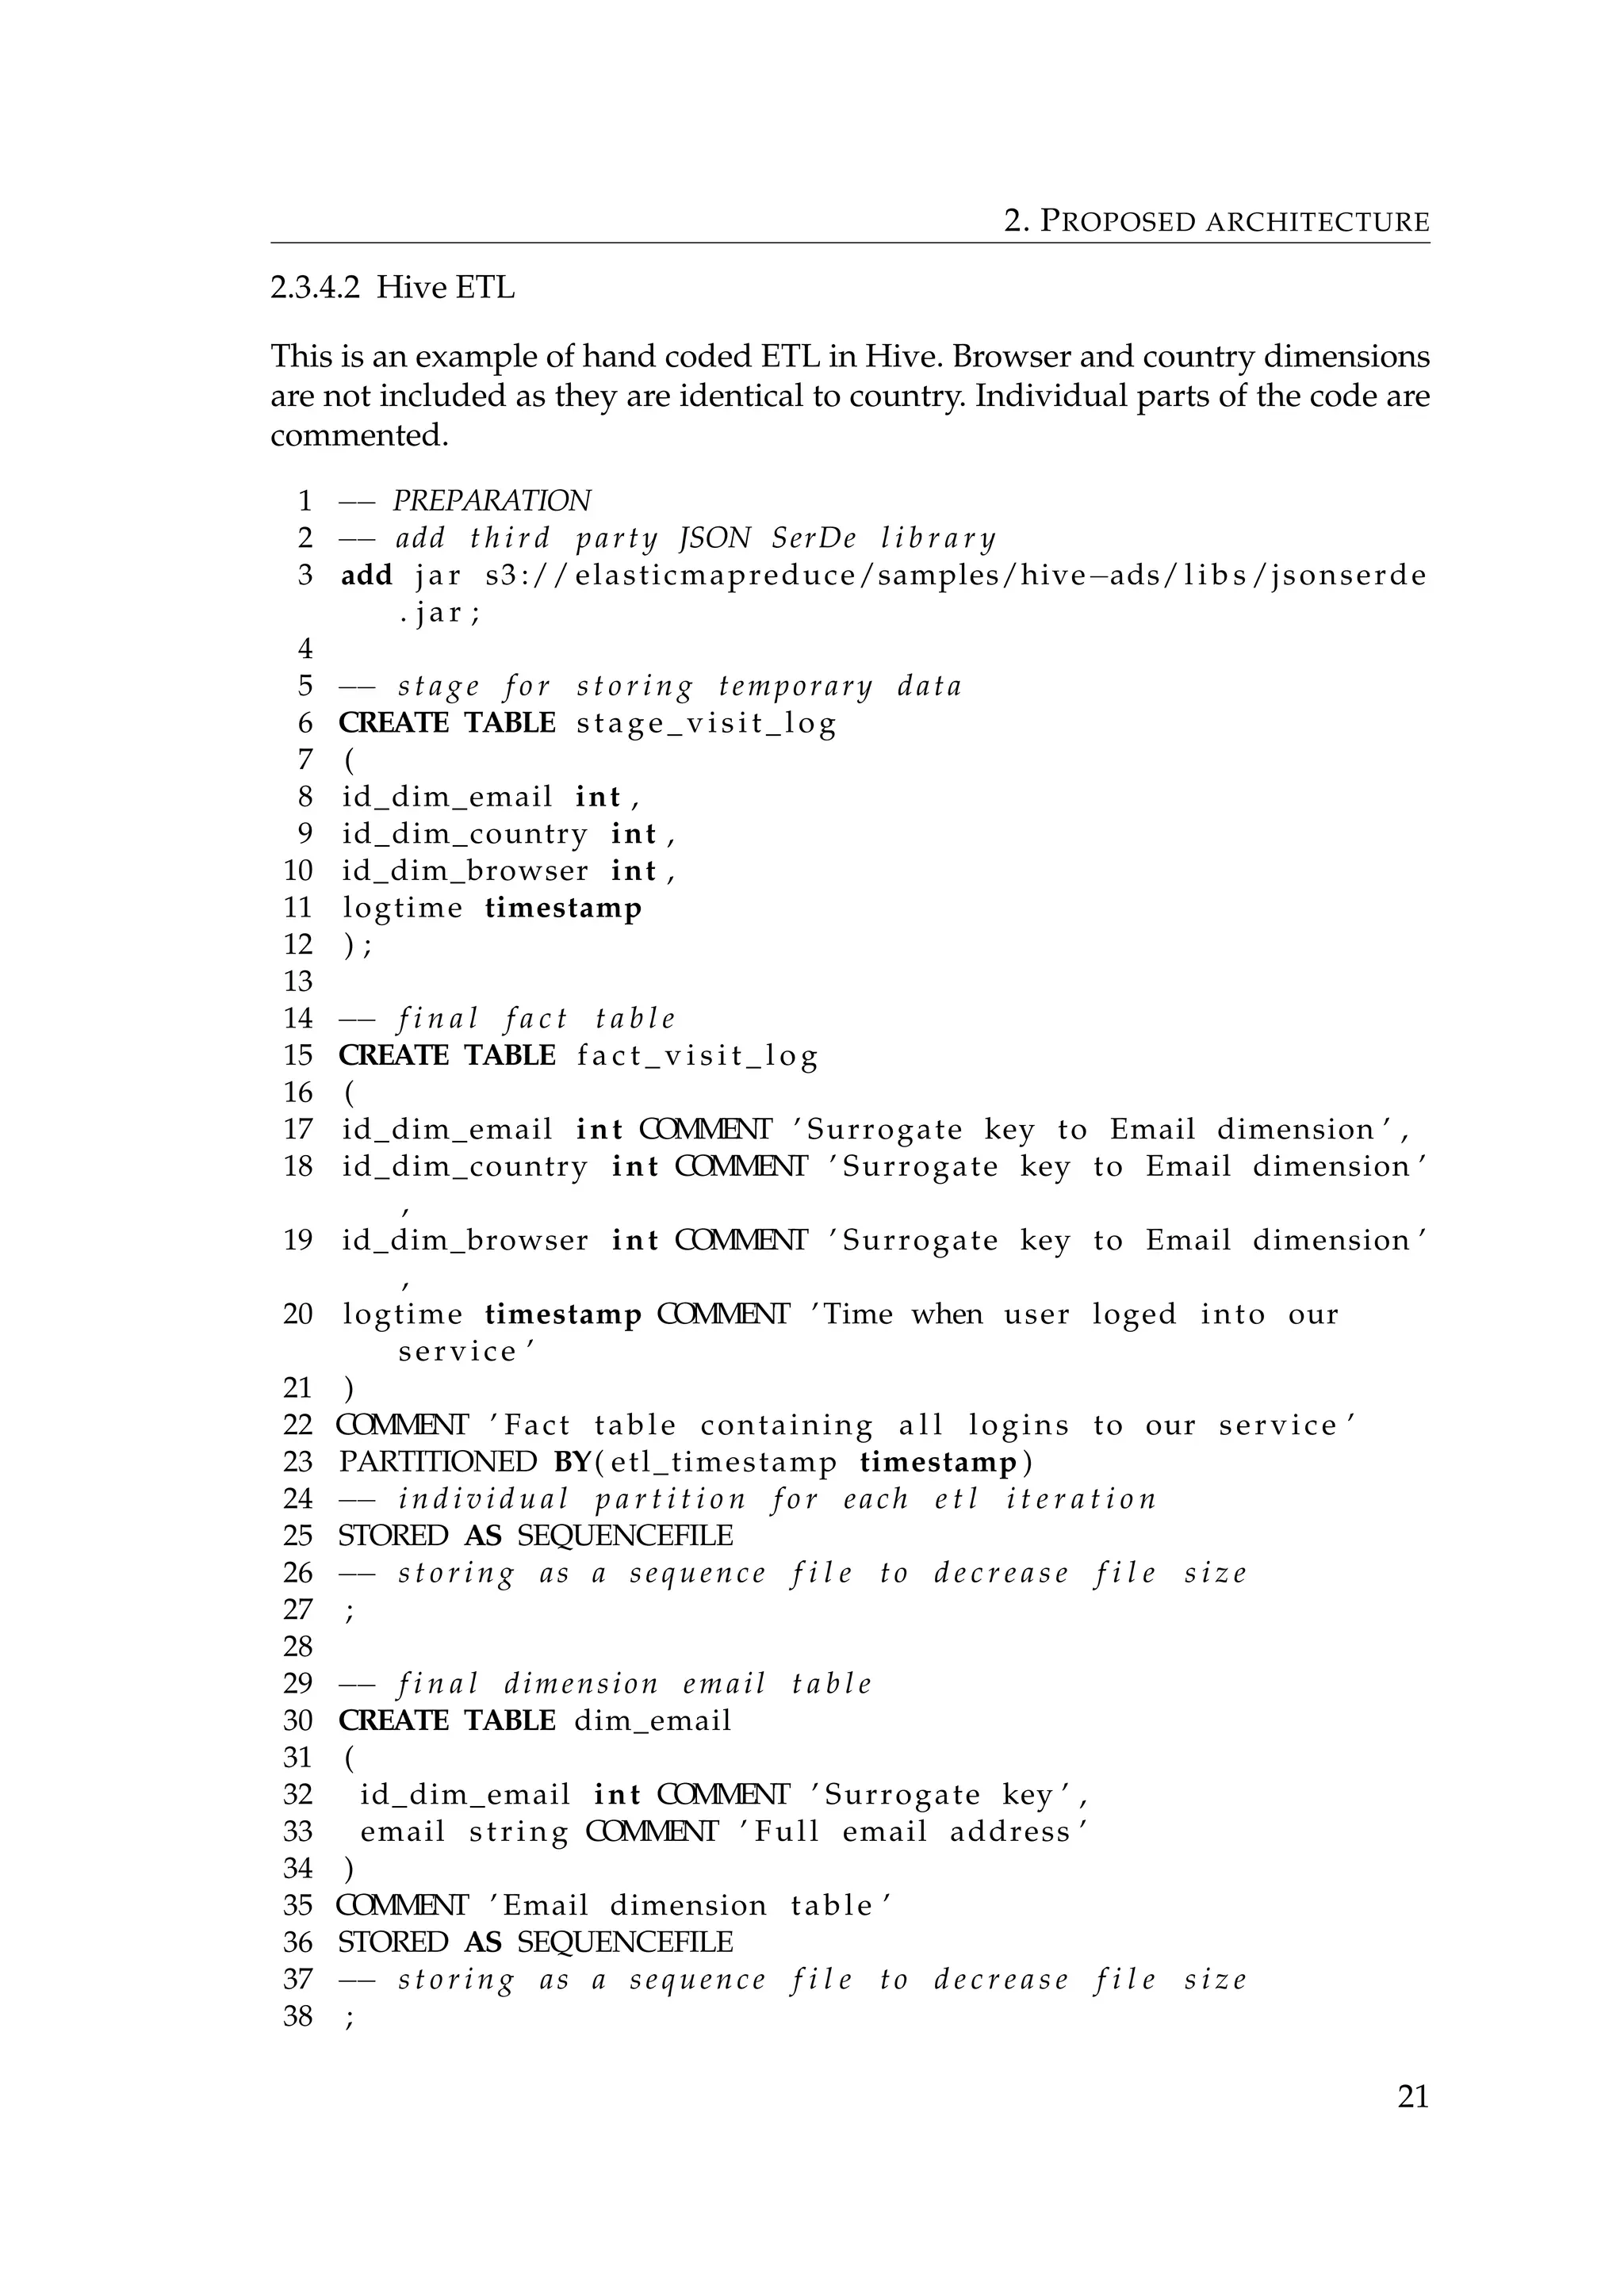
2.3.4 Hive
The Hive [11] is a data warehouse software combining querying and managing
large data sets stored in HDFS. Developers can specify a structure of tables the
same way as in RDBM and then query underlying data using SQL-like language
HiveQL [14]. Hive gives a developer power to create tables over data in HDFS or
over external data sources and specifies how these tables are stored.
Hive metadata are stored in HCatalog. Specifically in Metastore database. Ma-
jor advantage of the metastore is that its database can reside outside Hadoop
cluster. Such a located metastore database can be used by other services and it
prevail in case of cluster failure. One of the most distinguishing feature of Hive
is validation of schema on read and not with write like in RDBMs. Due to this
behaviour, it is not possible to define referential integrity using foreign keys or
even define uniqueness.
18](https://image.slidesharecdn.com/thesis-170323143759/75/Hadoop-as-an-extension-of-DW-25-2048.jpg)
![2. PROPOSED ARCHITECTURE
Clients can connect to Hive using two different drivers, ODBC and JDBC.
ODBC is a standard written in C and C++ and is supported by majority of tools
and client tools. JDBC, on the other hand, is based on programming language
Java, therefore some technologies, especially the ones from companies not devel-
oping on Java, lack native support. However, a lot of tools have separate JDBC
drivers that can be installed. For example Microsoft SQL Server have download-
able JDBC driver that supports SQL Server 2005 and up. Oracle and MySQL
databases have native support for JDBC drivers. Drivers performance is highly
dependable on implementation of driver that we use to connect to Hive [15, 16].
Figure 2.3: Hive connection diagram [11].
Tables in Hive can be internal or external. Internal table is a table completely
managed by Hadoop. However, an external table can be located elsewhere and
then only metadata are stored in Hive metastore. For querying data outside Hadoop
Hive uses Storage Handlers. Currently, support for JDBC storage handler is not
included in official Hive release, but code can be downloaded and compiled from
open-source project [17]. This feature gives Hive ability to query data stored in
databases through JDBC drivers. However, external tables cannot be modified
from Hive. Among the JDBC driver, Hive supports external tables for HBase,
Cassandra, BigTable and others.
Hive uses HiveQL language to query the data [14]. Every query is translated
into Java MapReduce jobs first and then executed. In general, Hive has not been
build for quick iterative analysis, but mostly for long running jobs. The transla-
tion and query distribution itself takes around 20 seconds to finish. This disad-
vantages of Hive in using it in customer facing BI tools such as reporting services,
dashboards or in a OLAP with data stored in Hadoop, as every interaction such
as a refresh or change of parameters, generate new query to the Hive and forces
users to wait at least 20 seconds for any results.
19](https://image.slidesharecdn.com/thesis-170323143759/75/Hadoop-as-an-extension-of-DW-26-2048.jpg)
![2. PROPOSED ARCHITECTURE
Another Hive feature used in data warehousing and analytics is support for
different file types and compressed files. This includes text file, binary sequence
file, columnar storage called Parquet or JSON objects. Other feature related to file
storage is compression. Compressing files can save significant amount of storage
space, therefore decreasing read and write time changes for CPU time. In some
cases compression can improve both disk usage and query performance [18]. Text
files consisting csv, XML or JSON can be parsed using different SerDe functions,
which are serialisation and deserialisation functions. Natively Hive offers sev-
eral basic SerDe functions or RegEx SerDe for regular expressions. Open-source
libraries for parsing JSON exist, although they are not included in official Hive
releases. However, those libraries often have issues with nested JSON or JSON
arrays.
In data warehousing data are mostly stored as a time series. Typically every
hour, day or week new data are exported from a source system for the particular
period. In order to easily append data in Hive tables, Hive supports table parti-
tioning. Each partition is defined by a meta column which is not part of a data
files. By adding new partition into existing table, all queries automatically query
even new partition. Performance wise specific partition can be specified in where
clause of HiveQL statement in order to reduce number of redundant reads as a
Hive reads only partitions that are needed. This is useful feature in an ETL pro-
cess as an ETL usually process only small set of data. Typically, table would be
partitioned by a date or a datetime, depending on a period of data exports.
Hive also supports indices, which are similar to indices in RDBMs. Index is
sorted structure that increases read performance. Using the right query condi-
tions and index, it is possible to decrease number of reads, as only portion of
table or partition needs to be loaded and processed. Hive supports index rebuild
function on table or individual partitions.
2.3.4.1 HiveQL
HiveQL is Hive query language that has been developed by Facebook to simplify
data querying in Hadoop. As most developers and analysts are used to SQL lan-
guage, developing similar language for Hadoop was very reasonable. HiveQL
give users SQL-like access to data stored in Hadoop. It does not follow full SQL
standard, however the syntax is familiar to SQL. Among others HiveQL supports
following features:
• Advanced SQL features such as window functions (e.g. Rank, Lag, Lead)
• Querying JSON objects (e.g. using get_json_object() function).
• User defined functions.
• Indexes.
On the other hand, HiveQL does not support delete and update statements.
20](https://image.slidesharecdn.com/thesis-170323143759/75/Hadoop-as-an-extension-of-DW-27-2048.jpg)
![2. PROPOSED ARCHITECTURE
2.3.5 Impala
Impala is an open source distributed processing framework developed by Cloud-
era. Impala provides low-latency SQL queries on data stored in Hadoop. Low-
latency is achieved with in-memory computing. Impala stores data in-memory in
Parquet columnar format, therefore it more suitable for querying large fact tables
with smaller amount of columns. Another feature that distinguish Impala from
Hive is a query engine. Imapala does not compile queries into MapReduce rather
uses its own programming model.
Impala is closely tied to Hive because it uses Hive metastore for storing data
metadata. Impala can run on Hadoop cluster without Hive, however Hive metas-
tore has to be installed. Impala accepts queries sent via impala shell, JDBC, ODBC
or Hue console.
2.3.6 Pig
Pig [19] is simple scripting language for data processing and transformations.
It has been developed mainly by Yahoo. The power of Pig and Hive is similar.
The main difference is audience for which the tool was developed. Pig is more
intuitive for developers with experience in procedural languages. On the other
hand, Hive leverages knowledge of SQL. Pig’s advantages:
• Supports structured, semi-structured and unstructured data sets.
• Procedural, simple, easy to learn.
• Supports user defined functions.
One of the powerful features is capability to work with dynamic schema.
Meaning that PIG can parse unstructured data such as JSONs without predefined
schema. This is helpful while working with dynamic nested JSONs or JSONs ar-
rays.
DataJson = LOAD ’s3://pig-test/test-data.json’
using com.twitter.elephantbird.pig.load.JsonLoader(’-nestedLoad’);
Figure 2.4: Example of Pig script for loading complex JSON structure.
Usage of Pig or Hive highly depends on audience. As most of the data ware-
houses are built on RDBMs and people involved in its development have knowl-
edge of SQL, the Hive is preferable tool for data transformation and data query-
ing.
2.3.7 Kylin
Relatively new project that implements OLAP into Hadoop is Kylin [20]. Kylin
originally started as an in-house project of ebay but it has been published as open-
source few months ago.
24](https://image.slidesharecdn.com/thesis-170323143759/75/Hadoop-as-an-extension-of-DW-31-2048.jpg)
![2. PROPOSED ARCHITECTURE
Kylin works in the following manner. Aggregations are calculated from Hive
using HiveQL and stored in HBase. Then when data are queried Kylin query en-
gine looks into HBase if requested data are precalculated there and if so, returns
data from HBase with sub-second latency. Otherwise Kylin query engine routes
query into Hive. Kylin supports JDBC, ODBC and Rest API for client tools, there-
fore it is possible to connect from analytic tools such as Tableau, SAS or Excel.
Figure 2.5: Kylin high-level architecture [20].
2.3.8 Sqoop
Sqoop [11] is tool provided by Hadoop that is used for importing and exporting
data. Different modes of exporting are supported such as full export, incremental
or limiting size of an export using WHERE clause. Data can be exported from
HDFS, Hive or any RDBM that supports JDBC. Sqoop works bi-directionally
therefore supports importing into HDFS, Hive or RDBM. Data can also be ex-
ported into delimited text file with specific field and row terminators or sequence
file. As a tool that is a part of distributed system, Sqoop also supports distributed
and parallel processing. Sqoop includes additional functionality for Hive export
and import in order to simplify data transfers with RDBMs. Sqoop Hive addi-
tional support includes:
• Incremental imports.
• CREATE TABLE statements within imports.
• Data import into specific table partition.
• Data compression.
25](https://image.slidesharecdn.com/thesis-170323143759/75/Hadoop-as-an-extension-of-DW-32-2048.jpg)

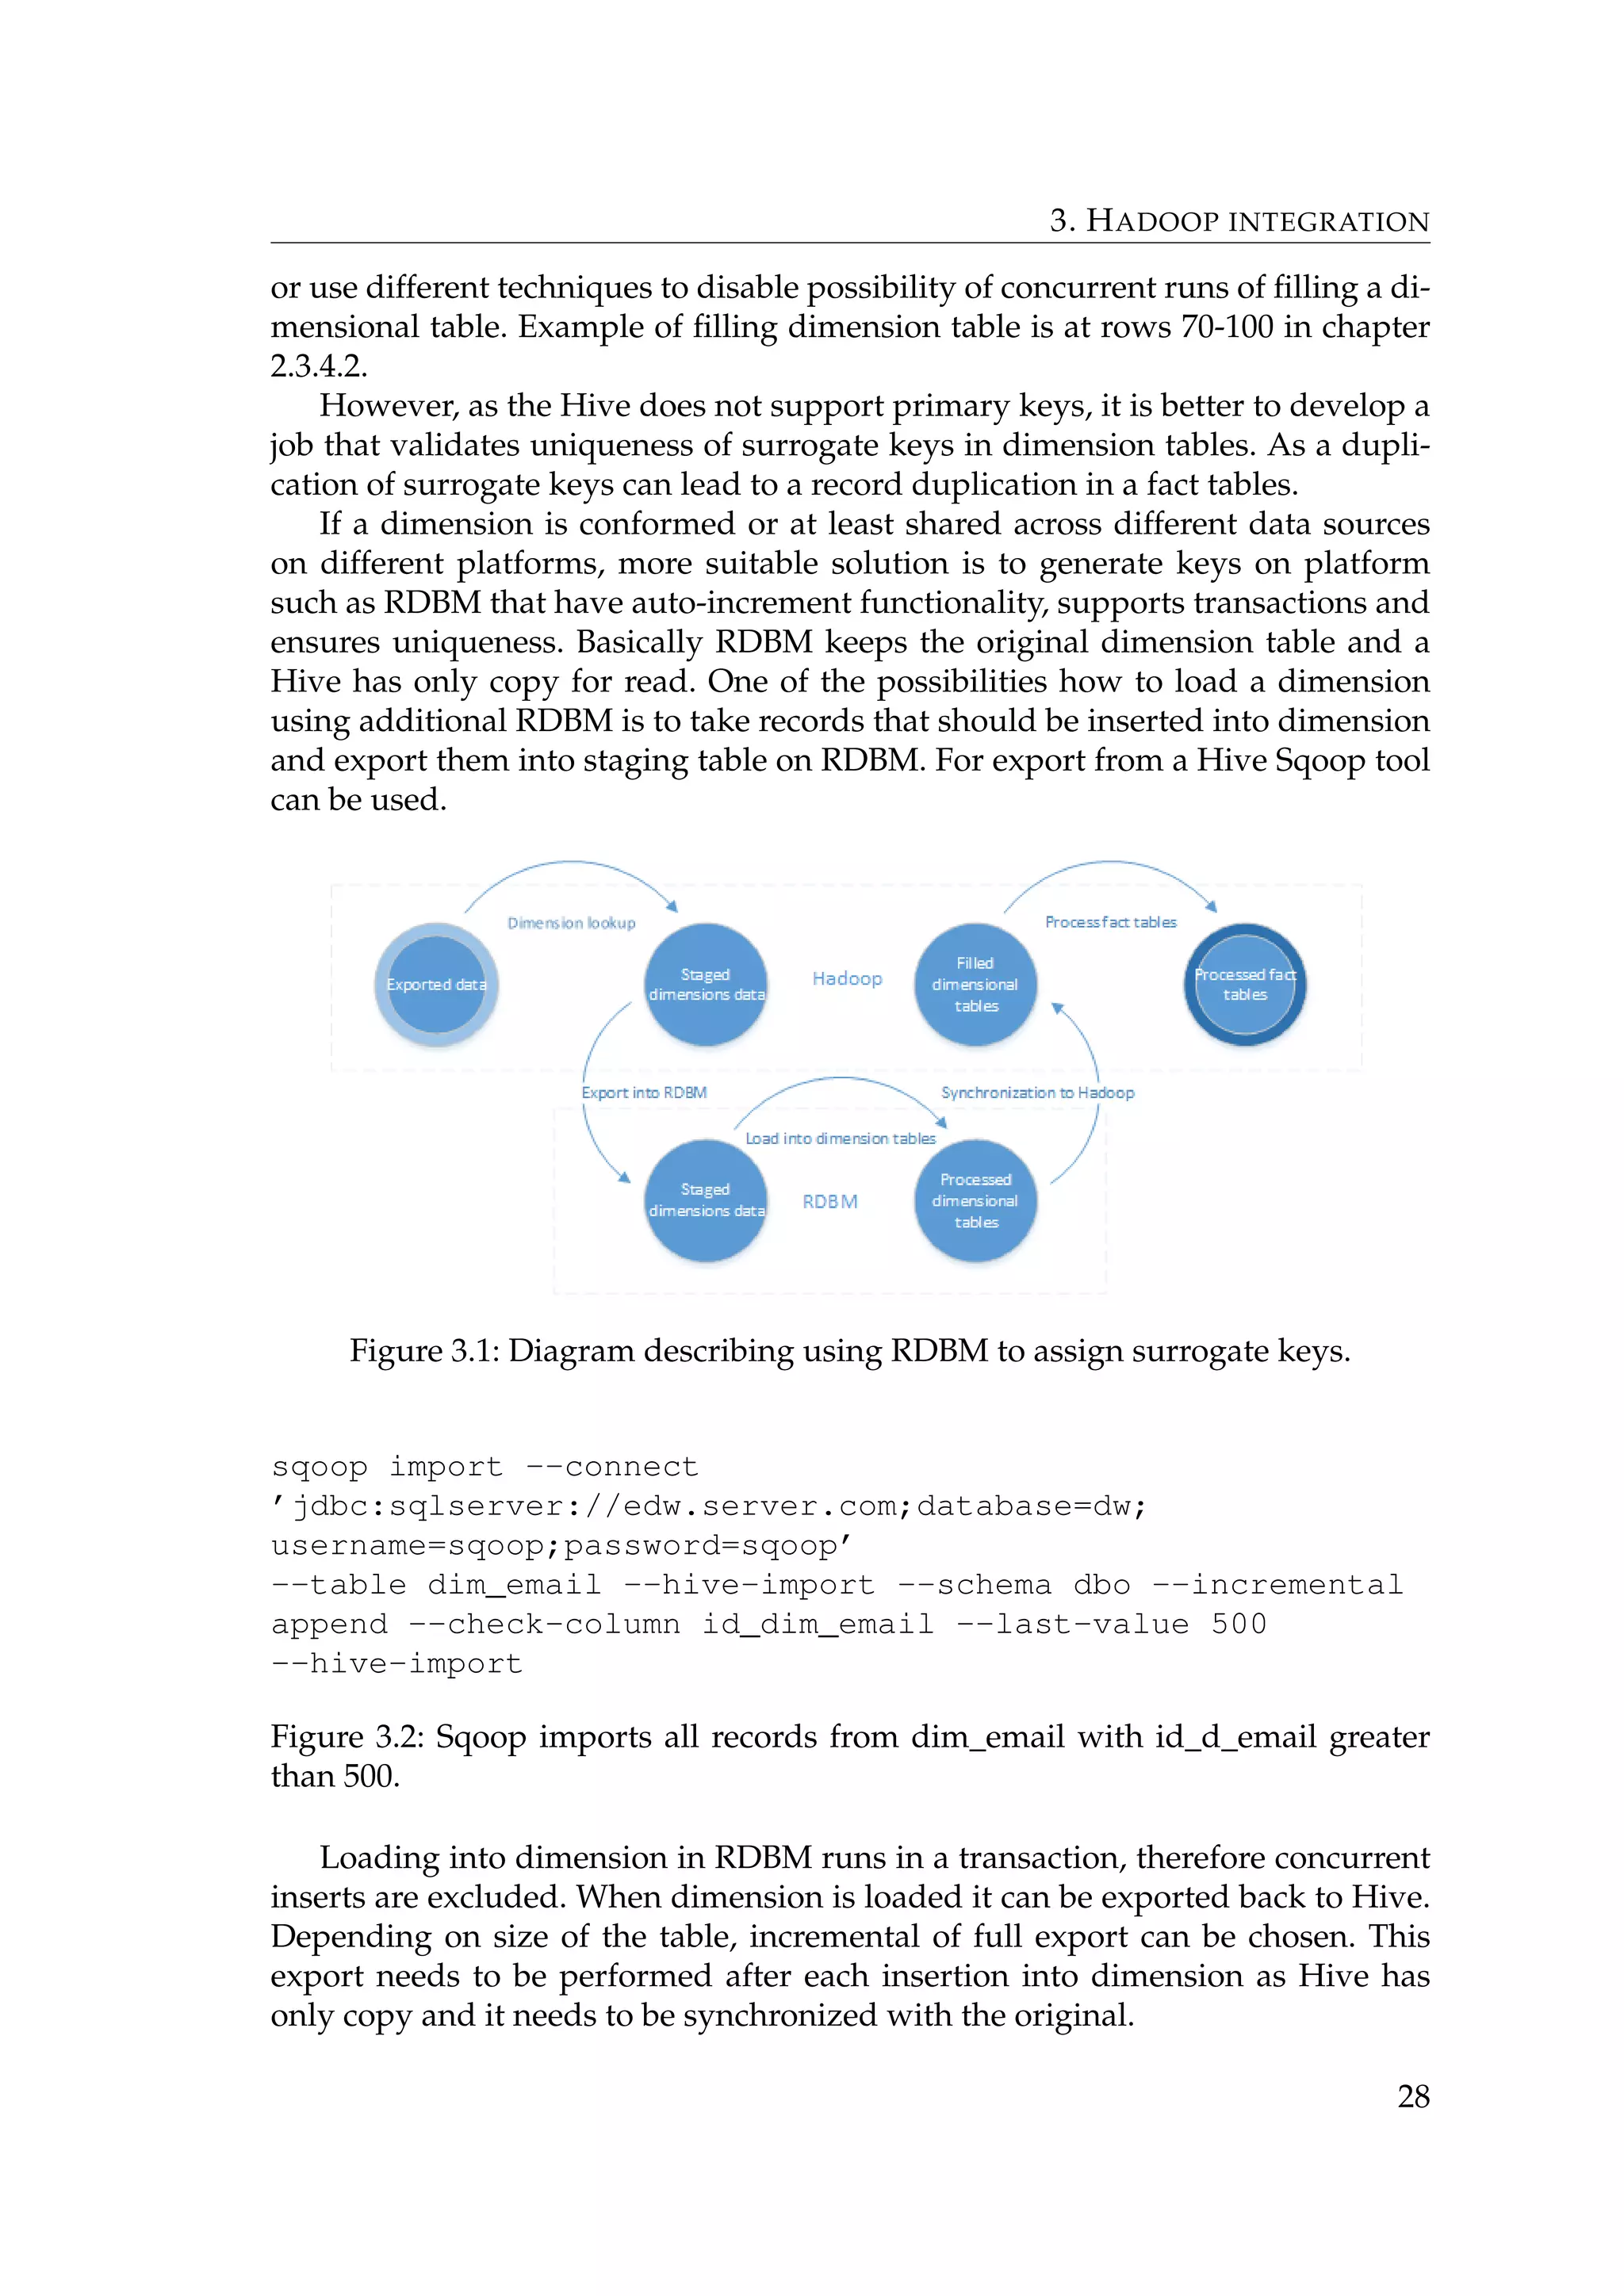
![3 Hadoop integration
The following chapters will explain how to integrate Hadoop into enterprise
data warehouse including implementation of star schema, data management and
physical implementation.
3.1 Star schema implementation
A logical star schema model captures business point of view and it is highly
platform independable on physical implementation. Hive provides almost the
same SQL-like interface as common RDBMs, therefore the data model build for
RDBMs data warehouse can be implemented in Hive with some adjustments.
Thesis therefore focuses rather on physical implementation than on logical.
Main advantages of implementing star schema in Hive:
• Simple and understandable view on data.
• Easy support for master data management.
• Dimensions support user defined hierarchies.
• Performance improvement [18].
• Conformed dimensions can be shared across different platforms.
3.1.1 Dimensions implementation
One of the most challenging part of implementing dimension tables are unsup-
ported DML functions update and delete at the row level in HIVE. Even though,
append operation is available, it creates new file with every append. This can
cause significant issues with NameNode performance as amount of small files
can grow significantly and it can cause issues with insufficient memory. Also only
first type of slowly changing dimension can be implemented without support of
update and delete.
Because dimension needs to keep the same surrogate keys and update is not
available, it is necessary to recreate the table every ETL run with the same keys.
Although, auto increment functionality is not developed yet, other ways exist.
While inserting new rows into table, we need to merge existing dimension
data and new data. It is necessary to keep old keys and generate new keys for new
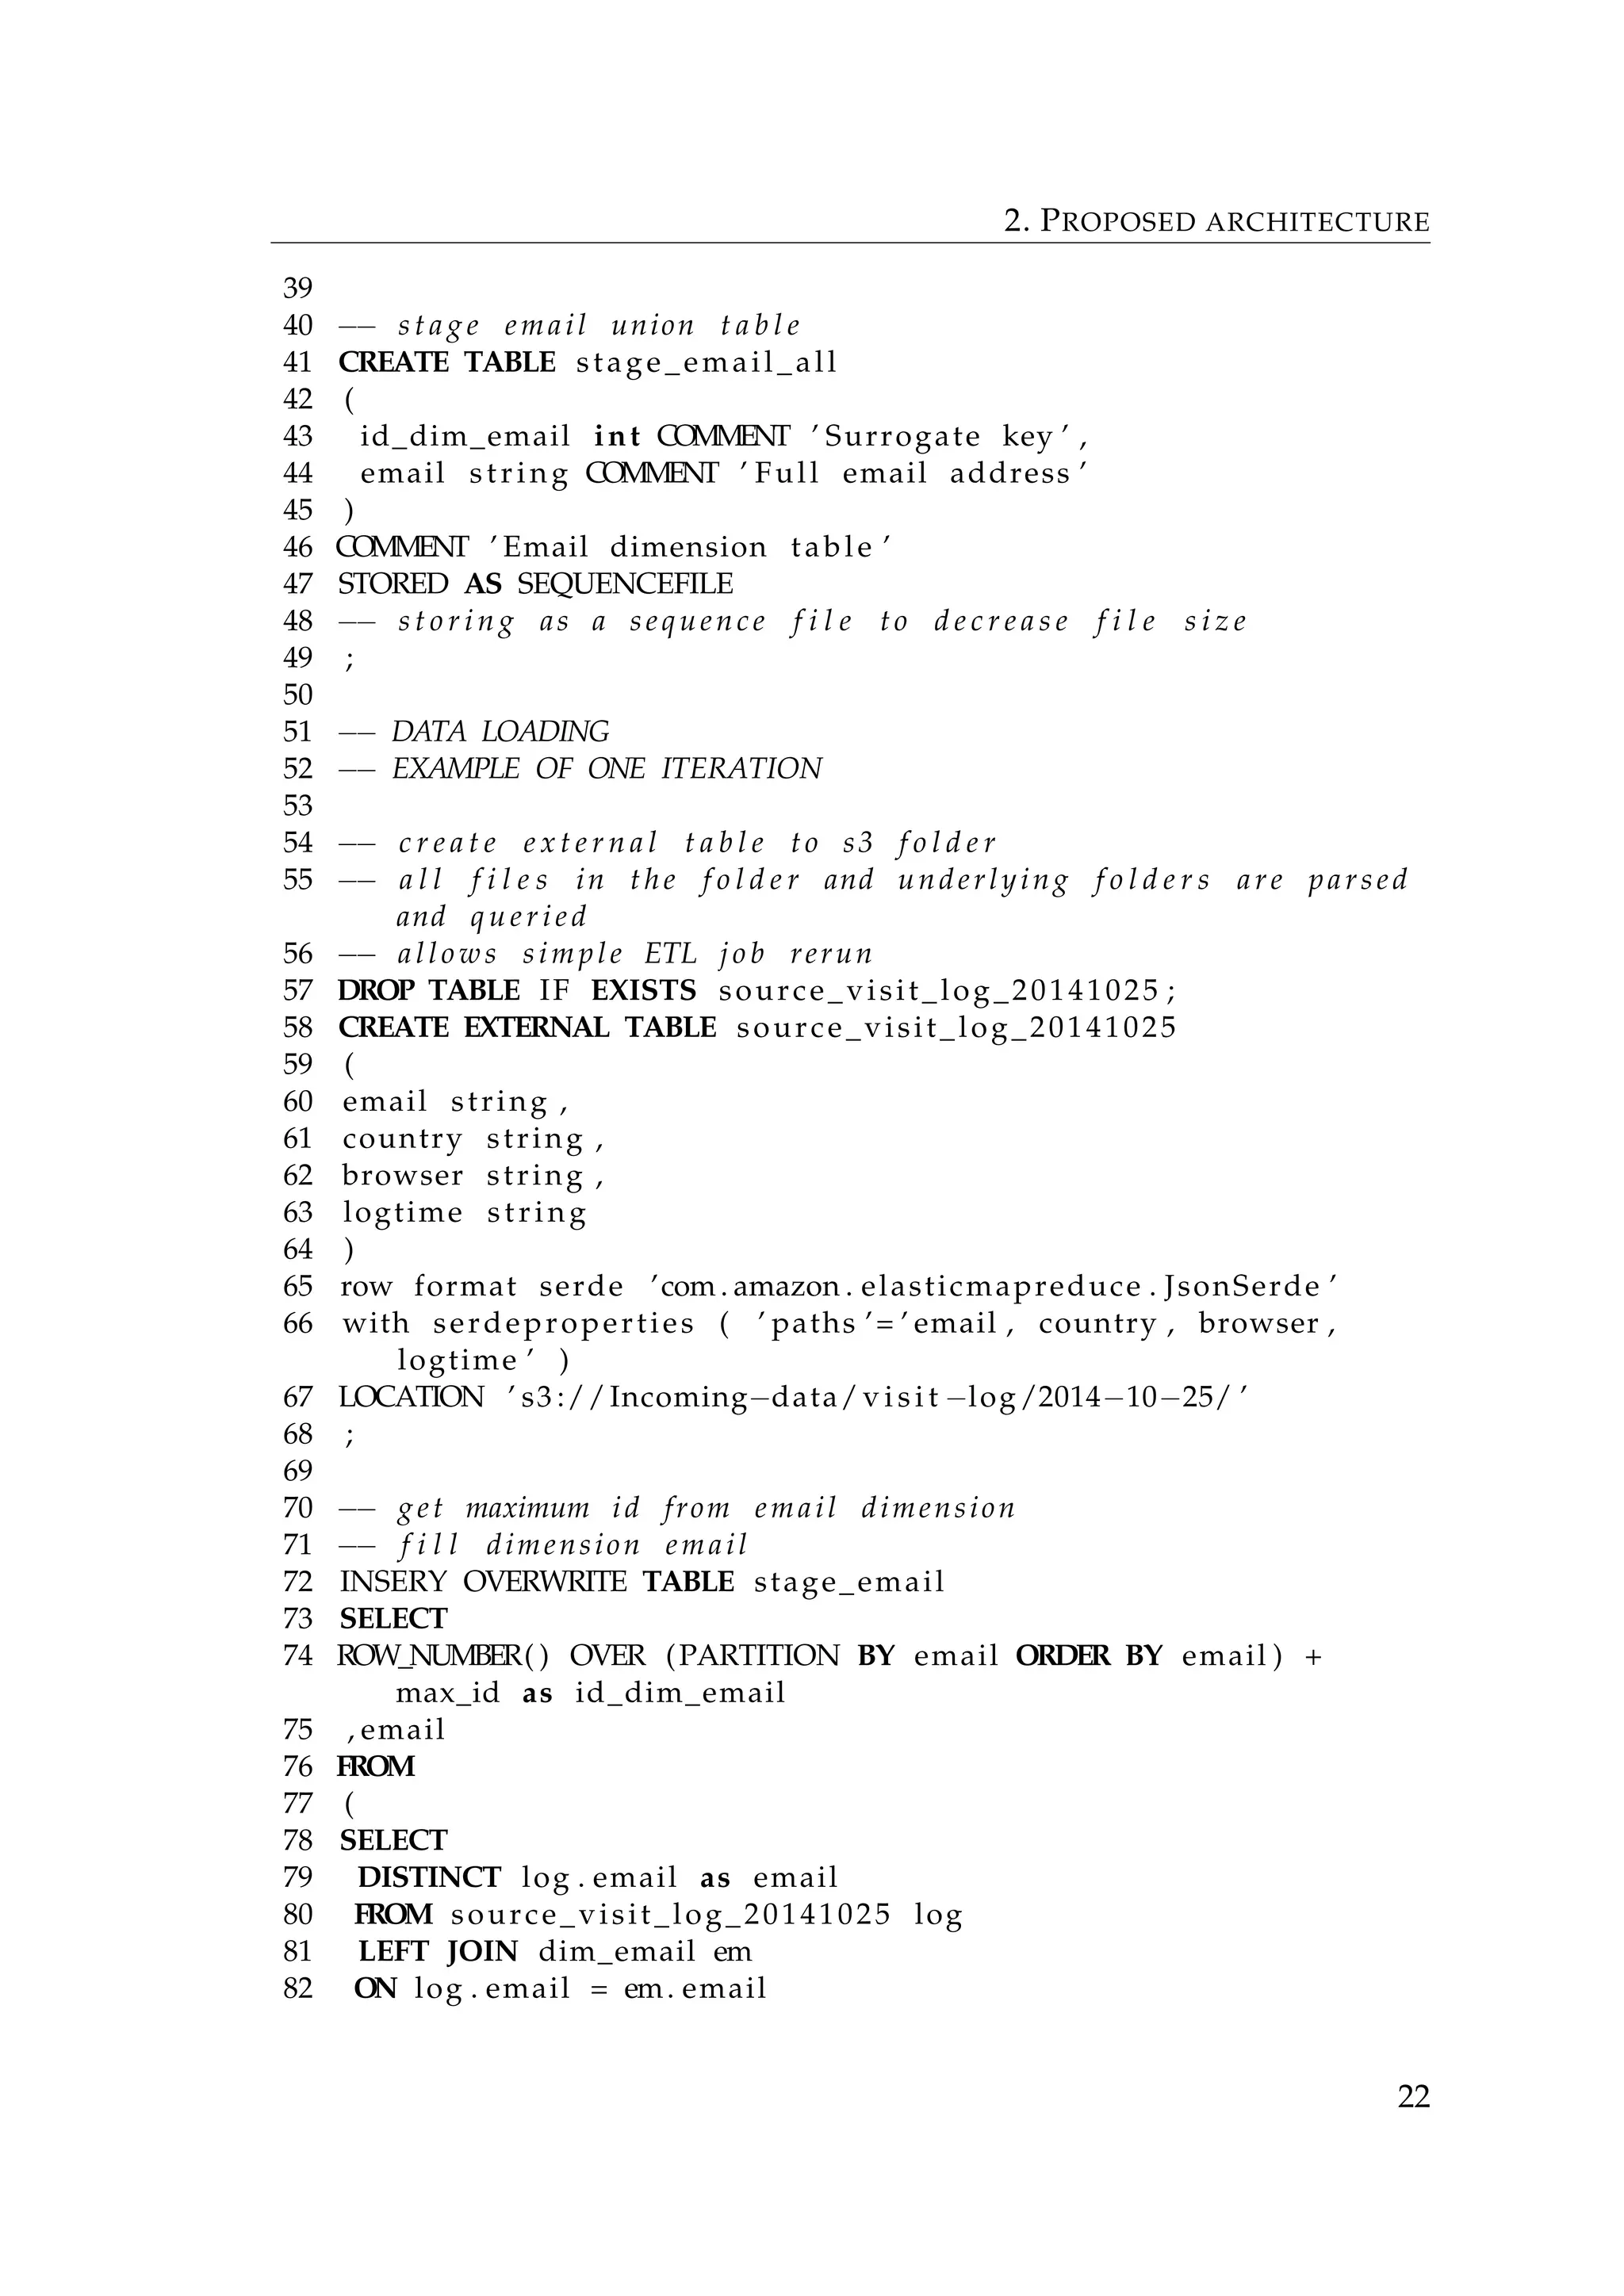
records in this step. One of the ways how to generate a sequence is getting max-
imal key value from existing data and then use function UDFRowsequence.java to
generate sequence starting with number one and then add maximum key value
to all generated keys. The same result can be achieved using ROW_NUMBER()
window function. Due to lack of transactions in Hive it is recommended to stage
data from more data sources first and load them into final dimension table at once
27](https://image.slidesharecdn.com/thesis-170323143759/75/Hadoop-as-an-extension-of-DW-34-2048.jpg)
![3. HADOOP INTEGRATION
Regarding slowly changing dimensions, they can be implemented the same
way as in RDBM. First type uses two additional columns of date or timestamp
format which specifies time period in which column is valid and second type can
be implemented by using additional columns of previous values [8].
If data are in JSON or different unstructured format it is recommended to
split JSON into structured table. Even though JSON record can contain dynamic
arrays, it is important to decide if the data in such a dynamic structure are neces-
sary. Splitting JSON into structured table has four main advantages:
• Performance.
• Simple synchronization with RDMB.
• Dimensions are simple and understandable for business users.
• Simple usage of dimensions in additional tools such as ETL and OLAP.
Otherwise JSONs need to be parsed with every query and JSON parsing is an
expensive operation [21].
3.1.2 Facts implementation
Fact tables contain snapshot of data or log data. Naturally, data stored in data
warehouse are tied to a day snapshot was taken or event occurred. This creates
time series defined mostly by time period between individual data exports (such
as hourly, daily, weekly).
Crucial to a fact table implementation is ability to effectively work with indi-
vidual dates as well as with whole history. Due to limited DML operations, few
possible options are available.
First, the least efficient way is to load new data into the same not partitioned
fact table. This causes read and write of whole table as delete operation is not
supported. Delete operation is needed to ensure ability to rerun an ETL job. When
incorrect data are loaded into a fact table, some easy way how to fix the issue and
rerun ETL process has to exist. This is usually achieved by deleting data from
current ETL iteration.
The second option is to create individual tables for each hour, day or week
depending on how often an ETL iteration runs. Using separate tables and then
creating view we can query individual tables as well as the whole history.
The most effective option is to use partitioning that is available in Hive. Each
ETL iteration works with one partition that is then appended into existing table. A
partition in Hive provides similar benefits as clustered index. Partition is defined
by an ETL iteration ID, which can be timestamp or int. Using partitioning it is
possible to query whole table or filter data by partition attribute and then only
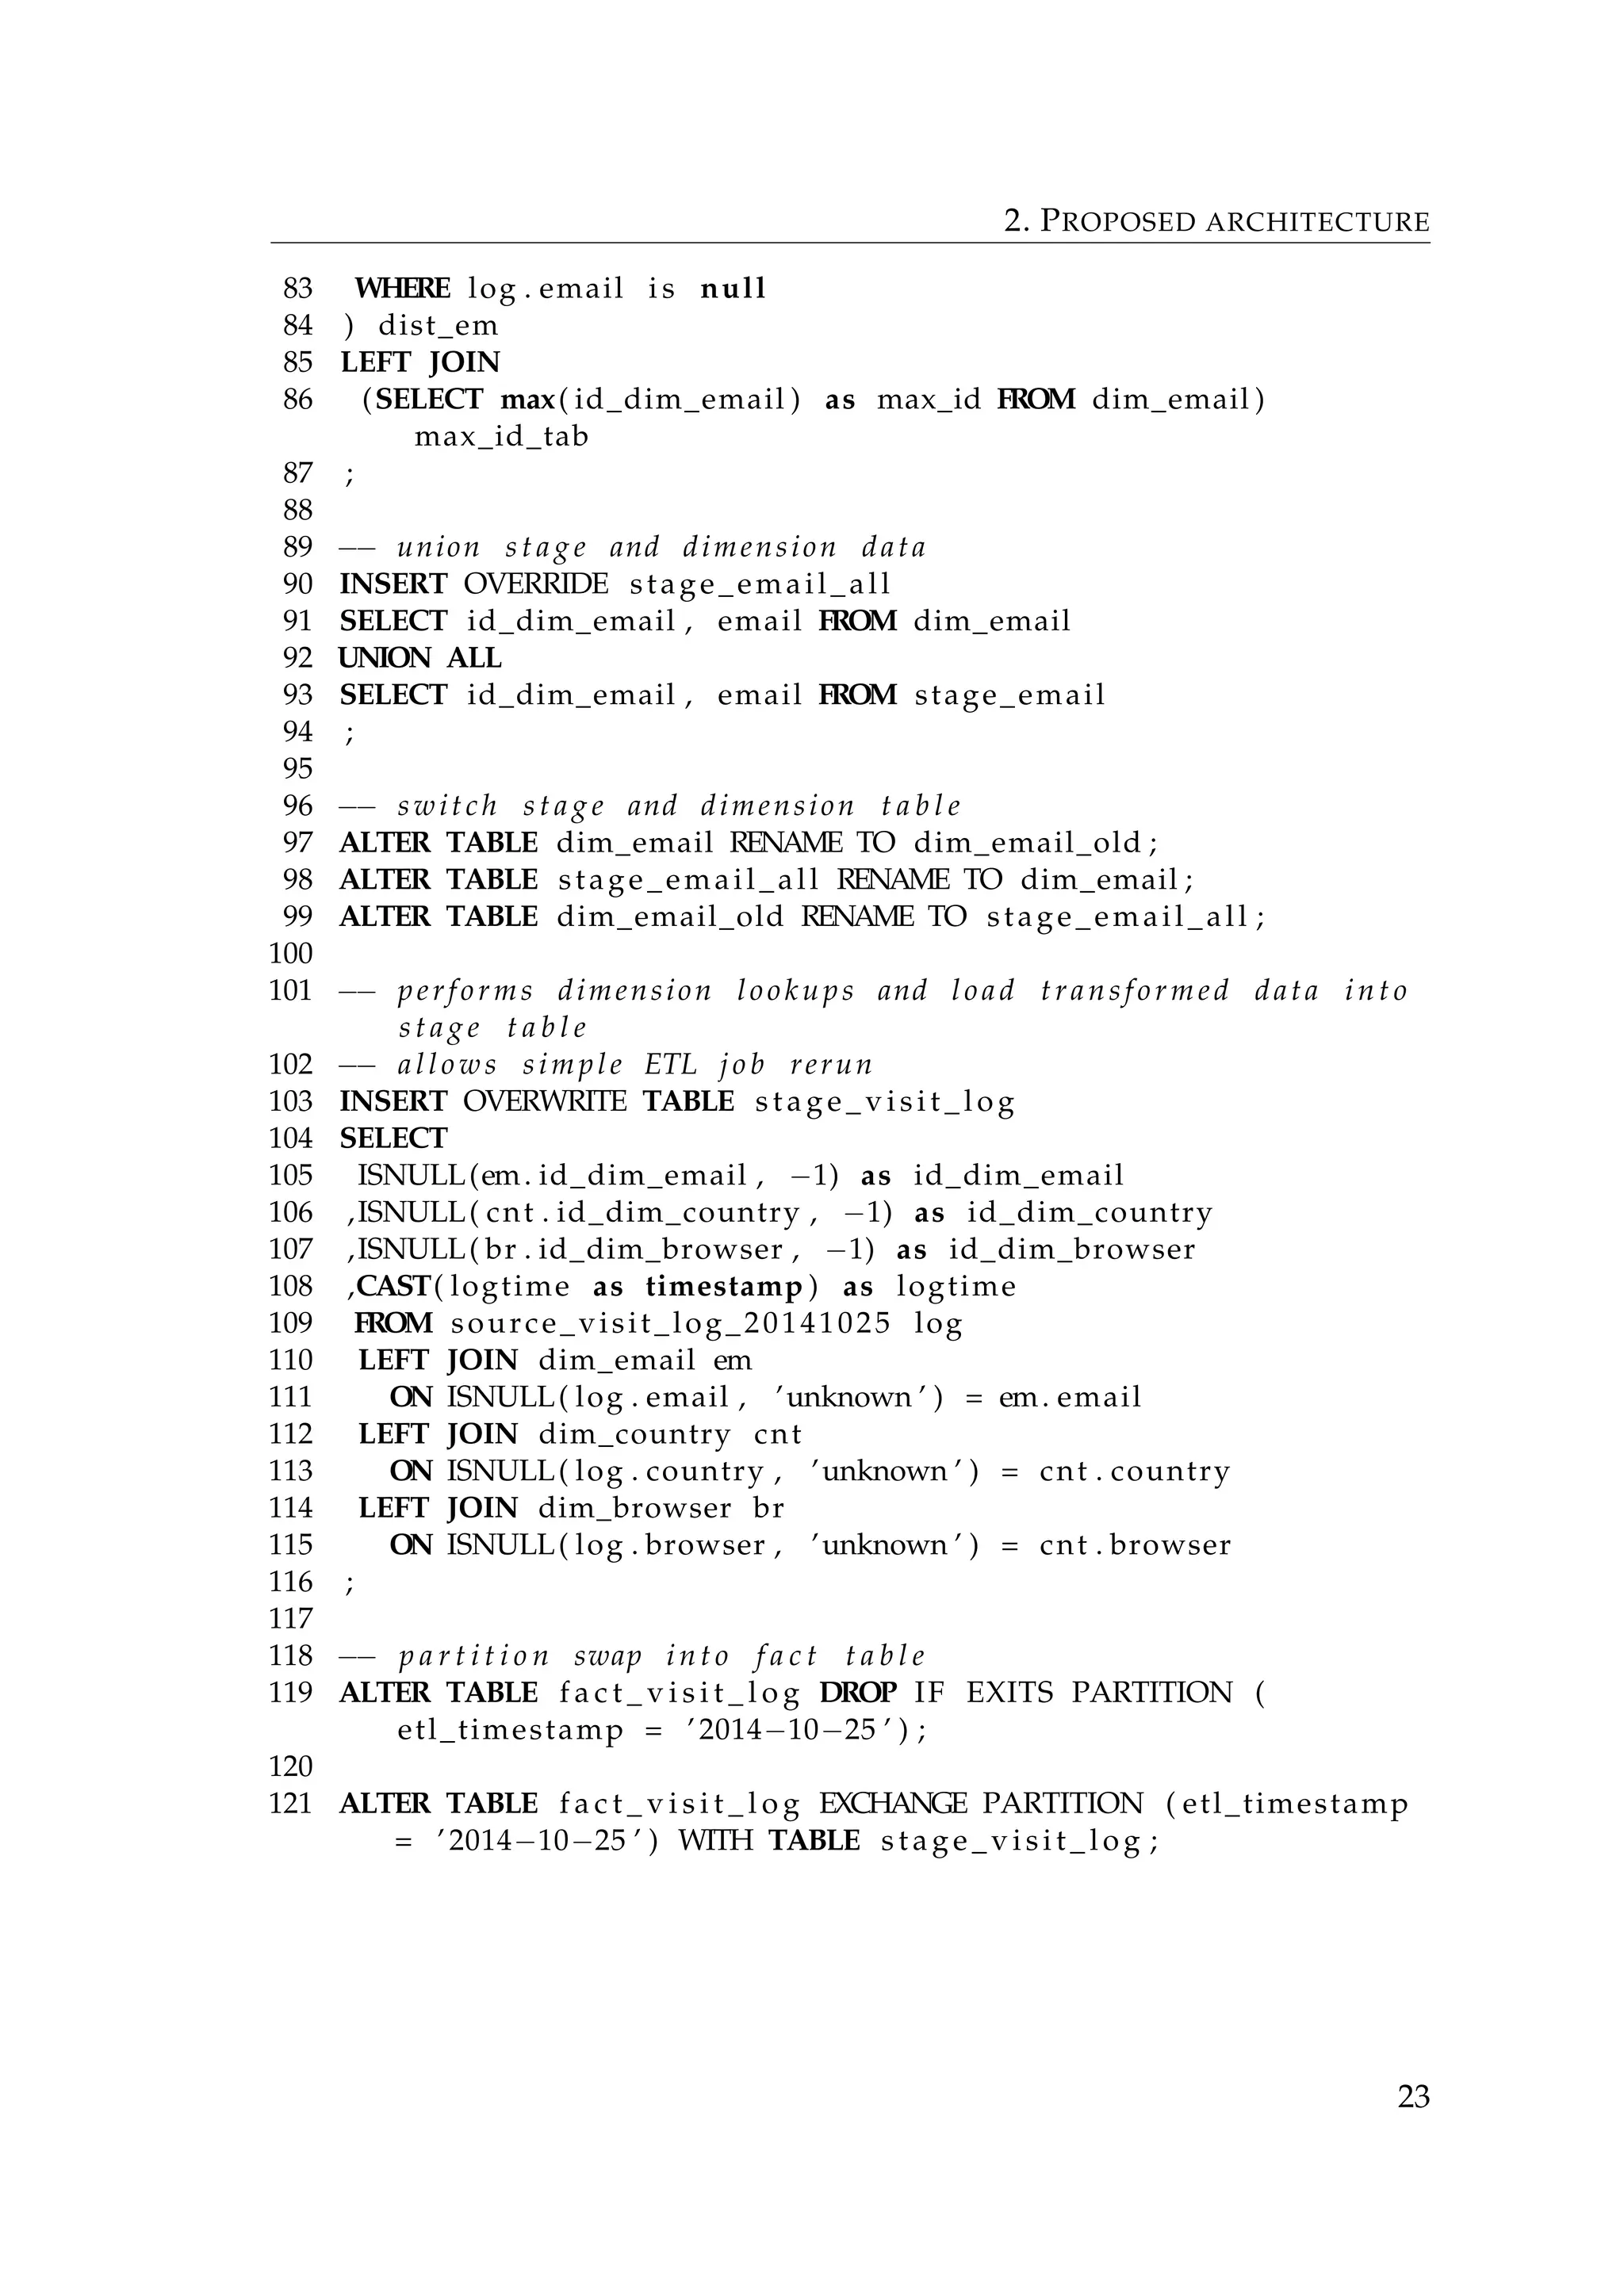
specific partitions of the table are read. Example of partitioned fact table is at
rows 103-121 in chapter 2.3.4.2. It uses partition swap to move data into fact table
more efficiently as it only affects metadata.
29](https://image.slidesharecdn.com/thesis-170323143759/75/Hadoop-as-an-extension-of-DW-36-2048.jpg)
![3. HADOOP INTEGRATION
In case of unstructured data such a JSON the same rule applies as for dimen-
sions. It is better to split the data for easier querying, data understanding and
accessing via ETL and BI tools and better performance. Surrogate keys can be
substituted for natural keys by a dimension lookup using join operation.
3.1.3 Star schema performance optimization
Several ways how to improve star schema performance exist. However, at the
end performance highly depends on specific Hadoop cluster and data charac-
teristics [18]. Generally, queries to data warehouse causes lot of reads and need
computational power as a large fact table is being joined to several dimensional
tables. Implementing start schema improves performance by reducing a size of
fact tables and reduces query time for most of the queries [18].
Performance can be improved by using sequence files. Sequence file is a flat
file format consisting key-value pairs. A sequence file can be compressed decreas-
ing file size and afterwards it is split into blocks on HDFS, hence improving work-
load. Sequence file can also be stored as binary files, therefore decreasing size
of the files on disk and improving read performance [18, 22]. Additional format
for consideration is Parquet. Parquet is columnar storage for Hadoop ecosystem.
Columnar storage is the most beneficial if fact table is used in aggregation of large
amount of data and for queries that loads lots of rows but use a limited number
of columns. Example of table stored as sequence file is at rows 14-27 in chapter
2.3.4.2.
For dimensions that are small enough to fit into memory, Hive have Map join
functionality [21]. Map joins are processed by loading the smaller table into an in-
memory hash map and matching keys with the larger table as they are streamed
through. Another similar approach is to use Hadoop distributed cache [11].
Hive can benefit from building indexes on fact tables. However, due to Hive
difference to RDBMs, indexes does not have to be beneficial as in RDBMs.
For further queries optimization, Hive supports function EXPLAIN used for
explanation of generated MapReduce execution plan.
3.2 Security
By default Hadoop runs in non-secure mode in which no actual authentication
is required. By configuring Hadoop to run in secure mode, each user and service
needs to be authenticated by Kerberos in order to be able to use Hadoop services
[11].
Organizations which already have an Active Directory to manage user ac-
counts, are not keen in managing another set of user accounts separately in MIT
Kerberos. Nonetheless, Kerberos can be configured to connect to a company LDAP.
On the other hand each user has to have principal created and then it is necessary
to link principals to users in active directory.
Hadoop already provides fine-grained authorization via file permissions in
30](https://image.slidesharecdn.com/thesis-170323143759/75/Hadoop-as-an-extension-of-DW-37-2048.jpg)
![3. HADOOP INTEGRATION
HDFS, resource-level access control for YARN and MapReduce, and coarser-grained
access control at a service level. Hive provides Grant and Revoke access control
on tables similarly to RDBMs.
3.3 Data management
3.3.1 Master data
As an example, it is typically the case in a Master data that the attribute data
names and data definitions used to describe master data entities are likely to be
the standard data names and data definitions for the whole enterprise. Master
data are closely tied to conformed dimensions in data warehouse as some of the
conformed dimensions are based on enterprise master data.
It is important to be able to match new records with already existing in con-
formed dimensions in data warehouse. There is more approaches how to match
dimensional records:
• Simple matching - Using Group by or Distinct statement and then per-
forming lookup on dimensional table. This is easy to implement using
Hive as both operations are supported. This approach supports auditabil-
ity natively as we know how exactly records are matched. Example of
simple matching is at rows 70-87 in chapter 2.3.4.2.
• Complex matching - Often implemented in commercial Master data man-
agement systems. Usually complex matching algorithms that are hard to
scale or impossible to distribute. One of the disciplines used is machine
learning. It can be used to predict matching. One of the Hadoop libraries
that focus on machine learning implementation is Mahout. However, us-
ing complex matching significantly increase ETL development complex-
ity and auditability [23].
In already existing data warehouse it can be efficient to use existing master data
management system. However, loading a lot of data from Hadoop to an existing
system can easily become a bottleneck of whole ETL process. While considering
this option it is important to transfer the smallest possible amount of data and
keep as much of data processing in Hadoop as possible.
3.3.2 Metadata
Metadata contains detailed information about individual steps in an ETL process,
reporting or in data sources. With lacking metadata information it is difficult to
keep a track of data flow and data transformation.
Hadoop does not contain any tool that directly supports metadata collection
and management. Therefore metadata repository and metadata collection have
to be implemented manually.
31](https://image.slidesharecdn.com/thesis-170323143759/75/Hadoop-as-an-extension-of-DW-38-2048.jpg)
![3. HADOOP INTEGRATION
Data metadata can be stored in Hive metastore using HiveQL features TBL-
PROPERTIES, which allows to define key value pair of commentaries and COM-
MENTS, which can be added to columns or table [11]. With regularly ran queries
such as ETL planning problem occurs. Commercial tools such as Informatica sup-
ports ETL documentation and metadata creation, but if ETL is hand coded in
Hive it is necessary to store metadata outside of Hive metastore as Hive does not
support stored procedures. Design in orchestration chapter can be expanded for
metadata collection process which can be automated, based on query parsing.
Example of Hive table metadata is at rows 14-27 in chapter 2.3.4.2.
Metadata stored in database can simply be visualised and displayed using
any reporting tool. Reporting tools usually have their own system for storing
metadata.
Therefore metadata for individual parts of data warehouse can be stored as:
• Table details - stored in Hive table properties.
• Procedures details and query dependencies - manually created data struc-
ture for storing queries in RDBM.
• ETL orchestration, data flow and orchestration - orchestration tool.
• Reporting and BI tools - their own databases.
3.3.3 Orchestration
One of the things Hadoop does not do well at this moment is an orchestration. An
orchestration is a central function of whole data warehouse environment and the
source of operational information. EDW environment can have several thousands
of unique jobs running every day. With near real time and real time processing the
number of jobs ran every day can be tens of thousands. In such an environment it
is crucial to have ability to define individual tasks, its dependencies and runtime
environment. What is required from EDW orchestration:
• Agents support - EDW usually use more servers, different environments
such as development, production or UAT and it is important to easily
change job to run on different environments and servers.
• Complex dependencies support - Dependencies of individual jobs need
to be set properly. Often job waits for other projects to finish or just one
job in a project. Ability to set dependencies correctly can significantly de-
crease wait times of EDW processes. Dependencies also secure correctness
of data.
• Simple operability - With thousands of jobs running every day, simple
operability of orchestration tools can secure quicker problem resolution
time and meeting SLA.
• Simple user interface - This is similar to previous bullet point.
32](https://image.slidesharecdn.com/thesis-170323143759/75/Hadoop-as-an-extension-of-DW-39-2048.jpg)
![3. HADOOP INTEGRATION
• Simple manageability - EDW processes planning should not take signifi-
cant amount of time as they can often change.
For orchestration purposes Hadoop offers tool Oozie, which is simple Hadoop
job scheduler. Considering requirements on orchestration tool previously men-
tioned, Oozie itself does not meet most of them. The main problem is accessi-
bility only through command line interface or simple console and job definition
using XML. Therefore any job definition change has to be made via CLI and job
listing in console does not provide enough information to simplify operational
task. Another disadvantage is lack of support of non-Hadoop technologies. In
general, it is better to use general commercial scheduling systems such as Cisco
Tidal1
or Control-M2
. Especially if data warehouse is already running and some
scheduling systems are used. Running automated queries on Hive is a matter
of connecting to Hadoop master node via ssh tunnel or directly into Hive using
one of the supported drivers. This can be easily implemented in most scripting
languages and then planned into any job scheduler.
To make Oozie more suitable tool, an open source project has started called
Cloumon Oozie [24], which aims to implement a job definition and workflow
designer and a job management system.
3.3.4 Data profiling
Data profiling [25]is process of examining a data in an available data sets and
collecting information and statistics about a data. Main goal is to discover data
characteristics and whether data can be used for other purposes.
Data profiling consist different kinds of basic statistics such as minimum,
maximum, frequency, standard deviation and other information about aggrega-
tion such as count or sum. Additional information about data attributes can con-
sist of data type, uniqueness or length. [26]
Data profiling in Hadoop can be performed by:
• Commercial data profiling tool such as SAS or Informatica.
• Using R or other statistical language.
• Native Hadoop tool such as Hive or Pig.
Having Hive already running on Hadoop, using Hive and HiveQL for data
profiling is the easiest choice. HiveQL supports all basic statistical functions e.g.
min, max, avg as SQL and also supports aggregation functions such as count,
sum. Hive also contains variety of build-in user defined functions [27] that calcu-
late standard deviation, Pearson coefficient, percentiles and many others.
Therefore after setting the basic table structure in Hive, data profiling can be
done using basic build-in functions. The process of data profiling can be easily
1. http://www.cisco.com/c/en/us/products/cloud-systems-management/tidal-enterprise-
scheduler/index.html
2. http://www.bmc.com/it-solutions/control-m.html
33](https://image.slidesharecdn.com/thesis-170323143759/75/Hadoop-as-an-extension-of-DW-40-2048.jpg)
![3. HADOOP INTEGRATION
automated and used as a basic indicator of data quality and occurring data issues.
However, some tasks of data profiling can be difficult to implement in HiveQL as
they are difficult to implement even in SQL.
3.3.5 Data quality
Cleansing data and conforming data quality [28] is a challenging process espe-
cially in Hadoop. Commonly, lots of basic data quality validations in RDBMs are
forced by table structure and constraints and are validated with data insertion
into a table. Those basic constraints are data types, null and not null or that value
can be greater, equal and lesser than predefined value. More complex constraints
can be defined as well such as uniqueness, foreign key or functional dependencies
on other attributes. However, constraints such as foreign keys can significantly
decrease ETL performance.
Nonetheless, Hadoop has data structure validation implemented on read op-
eration instead of write.
With Hive, all these constraints have to be validated during transformations
and while loading data into star schema. This can significantly affect ETL perfor-
mance on Hadoop, especially with big log fact tables or dimensions. Therefore it
is better to identify important data quality validations and issues and consider in-
tegrating more data quality validations into one query to reduce number of read
operations from disks.
Data that are loaded into conformed dimension or used for sensitive business
reporting such as accounting information or information that are afterwards pub-
licly published should have higher priority and should be validated very care-
fully.
Many different methods can be implement in Hive into an ETL process that
can regularly validate quality of data. One of these methods that are easily imple-
mentable with HiveQL are Bollinger bands [29]. Bollinger bands can automat-
ically validate data distribution and capture unexpected distribution changes.
Other methods are implemented in build-in Hive UDFs such as standard devia-
tion.
At this point there are no open source data quality tools that would support
Hadoop or Hive. On the other hand, commercial tools such as Informatica are
slowly implementing Hadoop support allowing to manage Hadoop and RDBMs
data quality with one tool. Other commercial tools from companies such as Tal-
end or Attacama focus only on Hadoop.
3.3.6 Data archiving and preservation
One of the part of data management is a plan that describes when and how data
are archived and what data are preserved in data warehouse. One of the major
issue of RDBMs data warehouse is expensive storage space, therefore historic
data are either aggregated or archived and deleted from data warehouse. When
data are moved from data warehouse they are usually moved to tapes as to a
34](https://image.slidesharecdn.com/thesis-170323143759/75/Hadoop-as-an-extension-of-DW-41-2048.jpg)
![3. HADOOP INTEGRATION
• SSIS 4
- Data integration tool developed by Microsoft. After installing ad-
ditional ODBC driver for Hive, an SSIS package can connect into Hive and
use it as data flow source or destination. Within data source task, data
can be pulled using HiveQL query, therefore using power of Hadoop’s
distributed cluster. Other transformation such as fuzzy lookups are pro-
cessed outside of Hadoop, depending on where SSIS package is ran. Within
SSIS data flows can be processed in parallel to optimize working with
large volume of data.
• Oracle Data Integrator 5
(ODI) - One of several data warehouse and ETL
tools developed by Oracle. With version 12c Oracle introduced improved
support for Hadoop. ODI uses special adapters for HDFS and Hive and
can perform data transfers between Hive tables and HDFS files. Transfor-
mations are written in HiveQL, therefore they are processed on Hadoop
cluster. For better cooperation with Oracle Data Warehouse, ODI also in-
cludes Oracle Loader for Hadoop. Oracle Loader for Hadoop is high per-
formance and efficient connection to load data into Oracle Database from
Hadoop. Transformations and Pre-processing are performed within Hadoop.
[30]
• DMX-h - ETL tool for Hadoop developed by Syncsort. DMX-h supports
various transformations including joins, change data capture or hash ag-
gregation. All transformations are translated into MapReduce jobs directly
without translating them into Hive or Pig first.
3.5 Business intelligence
BI uses variety of tools for different purposes and each tool is targeted on specific
group of users. Each user wants to access data differently depending on their
responsibilities and skills. Data scientist prefers direct access to data and man-
agers simple dashboard or report with KPIs [9]. As Hadoop is based on HDFS,
users are able to access and query individual files located in HDFS, depending
on privileges. Other users or BI tools access structured tables in Hive using JDBC
or ODBC driver. Most common situation is that user access only to BI tool as it is
user friendly. Security is being defined often in BI tools such as Reporting portals
or OLAP. Depending on purpose of a BI tool, BI tools can be divided into three
main categories and those are OLAP, reporting tools and tools for analytics.
3.5.1 Online analytical processing
OLAP tools are based on structured data, therefore in case of Hadoop, OLAP
needs to access data stored in Hive or in other database tool such as Impala.
4. http://technet.microsoft.com/en-us/library/ms141026.aspx
5. http://www.oracle.com/technetwork/middleware/data-integrator/overview/index.html
37](https://image.slidesharecdn.com/thesis-170323143759/75/Hadoop-as-an-extension-of-DW-44-2048.jpg)
![3. HADOOP INTEGRATION
OLAP tool uses data as well as their metadata to define its own data structure,
therefore it requires structured underlying data.
When designing OLAP, one of the key decisions to make is if MOLAP, ROLAP
or HOLAP is used. OLAP usually serves as self-service analytical tool, therefore
various of data are queried in the shortest time possible and with self-service tool
users usually do not want to wait for the results [10]. Generally, Hive was not
developed for quickly running queries but rather for batch processing, therefore
making it not suitable for ROLAP or HOLAP. On the other hand, Hive is per-
fect data source for MOLAP as newly processed data are regularly loaded into
MOLAP and then all user queries are processed in MOLAP rather then in Hive.
Not all data that are loaded into MOLAP have to be stored in Hadoop. An
architecture can leverage the fact, that MOLAP can load dimensions from RDBM
and only large fact tables from Hive in order to improve processing speed.
Impala with in-memory processing is more suitable for ROLAP, however clus-
ter has to be designed for this type of workload, otherwise cluster can suffer from
insufficient memory and in such a case Impala can be force to repeatedly load
data into memory, hence significantly decreasing response time [22].
Despite the fact that Hive supports ODBC and JDBC drivers not all OLAP
tools can easily connect into Hive. For example common workaround for SSAS
is to create a linked server in SQL Server instance into Hive and then query data
from SSAS through linked server.
If Hadoop contains all dimension and fact tables necessary for OLAP imple-
mentation, then Kylin can be used. Which is ideal solution for large fact tables
thanks to support of incremental refresh of cubes. However with increasing num-
ber of dimensions and amount of dimensions’ members problems can occur, be-
cause a Kylin precalculates all combinations of all dimension members and with
any added dimension complexity of data exponentially grows. Therefore it is im-
portant to identify only needed dimensions ideally with smaller cardinality. Kylin
also expects star schema stored in Hive, therefore making impossible to combine
more fact tables into one cube.
3.5.2 Reporting
Reporting consists of two distinct parts. Reports are usually longer running queries
ran either on aggregated data or detailed data. Often reports are automatically
generated and sent to an email or a file share. As a user does not know the real
latency Hive is suitable for this type of usage. Even though Hive needs approx-
imately 20 seconds to translate query into MapReduce, this delay is not usually
crucial for reports.
The other part of reporting are dashboards presenting visualized KPIs. Such a
dashboards are designed to be responsive as they show small amount of critical
information and often can be viewed from mobile phones or tablets. This presents
an issue for Hive, hence the solution is to either pull data from OLAP instead of
Hive or prepare smaller aggregated tables that can reside in memory allocated by
Impala.
38](https://image.slidesharecdn.com/thesis-170323143759/75/Hadoop-as-an-extension-of-DW-45-2048.jpg)
![3. HADOOP INTEGRATION
Depending on workload Hadoop caching can be used for commonly running
reports or dashboards.
3.5.3 Analytics
Analytics can process large amount of data or even work with a small subset.
Hive is a great tool for long running ad hoc analytical queries or preparing smaller
data sets for further analyses with more suitable tools.
One of the most popular analytical languages is R. RHadoop [31] project im-
plements integration of R with Hadoop. It includes collection of R packages for
connection into Hadoop. RHadoop uses Streaming API. Main advantage of the
project is ability of accessing files directly in HDFS and functions for data query-
ing and data transfer.
Several other open source projects were created to ease data analysis in Hadoop
such as Spark, Shark6
, Tez7
or Mahout. Even though a lot of projects are devel-
oped as open source, a lot of commercial tools exists such as SAS, Alteryx or
Pentaho Analytics. Companies often offer whole analytical solution with Hadoop
and other analytical tools together.
3.6 Real time processing
Batch and real time processing are two distinct processes. In general batch pro-
cessing implementation is more simple then implementing processing of real
time data as it uses different approach and therefore different technologies. Cur-
rently, real time processing is not being implemented very often, as a lot of source
system are not capable of providing data in real time and also because implemen-
tation of real time processing is expensive. Compared to near real time processing
with micro batches real time processing does not necessary have to add any busi-
ness value.
Batch processing is usually easier to develop and to maintain. Therefore real
time data processing is being replaced by micro batch processing in near real
time. For a real time processing, Storm [32] can be used. Storm is framework for
distributed, fault-tolerant, streaming processing. Storm is not a part of Hadoop
framework as it was developed separately for different purposes. However, inte-
gration with Hadoop is well known.
Another tool for a real time processing is Spark Streaming [33]. It provides
in memory processing and it does not process each record or message separately
as Storm but rather in micro-batches. Both technologies guarantee excatly-once
processing. Spark Streaming secure exacly-once processing by using Resilient
Distributed Datasets (RDD). Basically, Spark Streaming takes stream of data and
converts it into micro-batches that are then processed by Spark batch processing.
In case of node failure, Spark stores data lineage and it can restore data from logs.
6. shark.cs.berkeley.edu/
7. http://tez.apache.org/
39](https://image.slidesharecdn.com/thesis-170323143759/75/Hadoop-as-an-extension-of-DW-46-2048.jpg)
![3. HADOOP INTEGRATION
Spark can be easier technology to adopt as it natively includes libraries for
work with aggregation functions. Storm has similar framework to Spark Stream-
ing called Storm Trident, which provides aggregation functions and micro-batch
processing. Main disadvantage of micro-batch processing is higher latency. Both
technologies have build in YARN support for resource management within a
cluster.
Storm and Spark Streaming can be used in several ETL designs:
• As Storm supports JDBC and ODBC, it can connect to almost any database.
Storm can in short periods read data from source table and perform trans-
formation and load transformed data back into database or HDFS.
• Storm can be integrated with Kafka [34], which is distributed messaging
system. Data are being buffered in Kafka in order to not get lost and Storm
is periodically reading data from it. As both technologies are fault tolerant
this ensures that all data loaded into Kafka are read and processed. Using
Kafka and Storm ETL is offloaded into distributed system and data are
loaded into database or Hadoop only when data are already transformed
or at least preprocessed. Decreasing number of reads and offloading ETL
processing completely into memory. Kafka, however, stores messages on
disks.
• Spark Streaming implementation is similar to Storm in case of real time
processing. Main advantage of Spark Streaming is that queries written for
Spark Streaming and are easily portable to general-purpose Spark [35].
Figure 3.3: Diagram describing data flow in architecture with Kafka and Storm
or Spark Streaming.
While designing real time ETL, data visualisation and access should be con-
sidered. It is not worth to implement real time solution if user has to wait more
than 30 seconds to get the data. For example Hive is not suitable tool for real time
processing due to query translation delay.
Other things to consider regarding purpose of data processing:
40](https://image.slidesharecdn.com/thesis-170323143759/75/Hadoop-as-an-extension-of-DW-47-2048.jpg)
![3. HADOOP INTEGRATION
think about Hadoop configuration and workload in advance in order to
keep costs reasonable. With more powerful nodes and more CPUs power
consumption can grow significantly.
Node configuration slightly differs for name node and data node, due to different
roles in a cluster [36].
When the Hadoop cluster is implemented as an part of data warehouse it
is important to keep sufficient network connectivity between Hadoop cluster
and rest of the data warehouse server. Amount of data transfer highly depends
on Hadoop integration into data warehouse environment. Among the regular
Hadoop to data warehouse traffic and vice versa, ad hoc data transfers have to be
considered as well. Cases such as recalculating few years of historical fact tables
into OLAP servers have high demand on bandwidth and if those cases are not
considered in design it can cause issues with SLA of other services.
3.7.1 Hadoop SaaS
Regarding physical location one of the most crucial decision to make is to decide
if running Hadoop cluster on-premise or as SaaS. Hadoop cluster located in cloud
has several advantages:
• Costs - Having no need for building own infrastructure saves a lot of
money. Companies does not need to buy theirs own hardware or expand
theirs data centres and improve theirs network.
• Resizability - Hadoop cluster can be easily adjusted and resized in matter
of number of nodes or nodes’ hardware.
• Support - Companies provide tested versions of Hadoop and tools among
the other additional software to ease maintanance and development.
However, SaaS also has major disadvantages and that is location of data cen-
tres. As Hadoop clusters are build for massive data processing it can be expected
that a lot of data are transferred between local data centres and Hadoop cluster
in a cloud. This causes several issues. In most cases, data transfer out of a cloud is
being charged and transfer speed itself is not sufficient in all cases or connectiv-
ity issues can occur during a transfer. SaaS is also disjoined from other companies
security processes, hence security have to be defined specifically for SaaS. Main
aspects what to consider when deciding about Hadoop cluster location is loca-
tion of existing data sources, data warehouse and other BI servers. As clusters in
cloud are usually very easy to start, it can be used for proof of concept for Hadoop
projects.
Major competitors in Hadoop SaaS are:
• Amazon Web Service8
(AWS) - AWS is a cloud computing platform devel-
oped by Amazon. Among other services such as elastic cloud, S3 storage
8. http://aws.amazon.com/
42](https://image.slidesharecdn.com/thesis-170323143759/75/Hadoop-as-an-extension-of-DW-49-2048.jpg)
![4. OTHER HADOOP USE CASES
Figure 4.1: Diagram describing steps in use case of offloading an ETL.
that it is necessary to synchronize dimensions in both platform as the is-
sues can occur and data integrity can be corrupted during transformation
process.
• Dimensions stored only in RDBM - Dimensions exist only in RDBM. Ad-
vantage is minimal synchronization and easier implementation. However
this implementation causes full dimension read with every lookup. In this
case it is better not to use external tables in Hive. Having 10 fact tables
with 20 dimension keys each, Hive has to perform 200 full scan of dimen-
sion tables on RDBM and store data into HDFS. The number of scan can
be reduced by import of needed tables only once before lookups or using
caching of smaller dimensions. This is not suitable if some big dimension
tables have to used. Dimensions can have hundreds of thousands records
and can take hundreds of gigabytes of storage. Importing such a table
with each ETL process is not feasible.
While implementing solution one can consider size of the tables implementa-
tion difficulty. Probably the best solution is to use hybrid approach. Small dimen-
sion containing hundreds of rows can be imported with every lookup, however
big dimensions are better to synchronize. More details about dimension imple-
mentation in Hive is in chapter 3.1.1.
If data warehouse team is already using commercial ETL tool with Hadoop
support, the whole process of ETL migration is simplified as some parts of ETL
process implementation are already implemented.
4.3 Data archive platform
As mentioned in chapter 3.3.6, Hadoop is great platform for storing massive
amount of data.
Usually the most current data are accessed more often and the older the data
are the less likely they will be needed. However, this is true mainly for detailed
data. Aggregated data are queried commonly as the part of the time lines. This is
one of the reasons why Inmon suggests having aggregation plans in data ware-
house [6].
45](https://image.slidesharecdn.com/thesis-170323143759/75/Hadoop-as-an-extension-of-DW-52-2048.jpg)
![4. OTHER HADOOP USE CASES
When historical data are aggregated, it is not necessary to delete underlying
data as they can be used for audit purposes and ad hoc historical analysis, such
as analyzing change in customer behavioural patterns.
Storing several years of the data can be challenging and having them some-
where, where data can be queried, is even more challenging. Despite the fact that
data located on tapes are difficult to access, commonly data are archived there as
it is one of the cheapest storage medium. As Hadoop cluster usually runs on com-
modity hardware, storage in Hadoop cluster is cheap compared to storage con-
nected to enterprise RDBMs. Therefore, if historical data are moved into Hadoop
they still can be analysed and used for reporting or processed into OLAP. With
advantage of keeping data structured and accessibility via HiveQL. If necessary,
aggregated data can be located in RDBM for quicker response time.
4.4 Analytic sandboxes
As research in [2] shows, analytic sandboxes are one of the components that is
expected to be used in the future. Analytic sandbox is a platform designed for
a specific group of users or individual users. Individual analytic sandboxes con-
tains specific subset of data from EDW depending on needs of users. These sand-
boxes are used for analyses, designing data models or even testing new tools for
data analysis and visualisation. Platform for analytic sandboxes have to meet fol-
lowing requirements:
• Low price - As number of sandboxes can be high if every individual user
have his own. The most important factor is price per terabyte of storage.
Price is closely related to the second bullet point.
• Storage scalability - Each sandbox can store large fact tables and even
more copies. It is important to design sandboxes with this fact in mind
and expect significant storage needs.
• Support for variety of tools - Each user can be familiar with different ana-
lytic languages and tools such as SQL, R, Python, MapReduce, Shark, SAS
or Excel.
• Extended security - Sandboxes have to be separated and users should not
be allowed to access each other’s sandbox. As some sandboxes can con-
tain personally identifiable information (PII) or other sensitive data.
• Parallel processing - It is expected that many concurrent queries will run
on a platform.
With support of variety of tools, linear storage and performance scalability,
YARN and HDFS fine-grained security, Hadoop is suitable platform for building
analytic sandboxes. On the other hand, working with Hadoop requires its ad-
vanced knowledge. Therefore, it is important to identify analytic sandbox users
46](https://image.slidesharecdn.com/thesis-170323143759/75/Hadoop-as-an-extension-of-DW-53-2048.jpg)

![Bibliography
[1] MANYIKA, J.; CHUI, M.; BROWN, B.; aj.: Big data: The next frontier for
innovation, competition, and productivity [online], [cit. 2014-10-12].
URL http://www.mckinsey.com/~/media/McKinsey/dotcom/
Insights%20and%20pubs/MGI/Research/Technology%20and%
20Innovation/Big%20Data/MGI_big_data_full_report.ashx
[2] RUSSOM, P.: Evolving Data Warehouse Architectures In the Age of Big Data
[online], [cit. 2014-10-13].
URL http://tdwi.org/webcasts/2014/04/evolving-
data-warehouse-architectures-in-the-age-of-big-data-
analytics/asset.aspx
[3] Economist: Data, data everywhere [online], [cit. 2014-10-17].
URL http://www.economist.com/node/15557443
[4] MERV, A.: Analytic Platforms: Beyond the Traditional Data Warehouse
[online], [cit. 2014-11-01].
URL url{www.nytech.org/NYTECH-TDWI-Big-Data-
Analytics-12-09-10.pdf}
[5] MAYER-SCHONBERGER, V.; CUKIER, K.: Big Data: A Revolution That Will
Transform How We Live, Work and Think. John Murray, 2013, ISBN 978-
1848547926.
[6] INMON, W. H.: Building the Data Warehouse, 4th Edition. Indianapolis: WI-
LEY, 2005, ISBN 978-0764599446.
[7] KIMBALL, R.; CASERTA, J.: The Data Warehouse ETL Toolkit: Practical
Techniques for Extracting, Cleaning, Conforming, and Delivering Data. In-
dianapolis: WILEY, 2005, ISBN 978-0764567575.
[8] KIMBALL, R.; ROSS, M.: The Data Warehouse Toolkit: The Definitive Guide
to Dimensional Modeling, 3rd Edition. Indianapolis: WILEY, 2013, ISBN 978-
1-118-53080-1.
[9] KIMBALL, R.; ROSS, M.; THORNTHWAITE, W.; aj.: The Data Ware-
house Lifecycle Toolkit, 2nd Edition. New York: WILEY, 2010, ISBN 978-
0470149775.
[10] THOMSEN, E.: OLAP Solutions: Building Multidimensional Information
Systems, 2nd Edition. Indianapolis: WILEY, 2002, ISBN 978-0471400301.
[11] WHITE, T.: Hadoop: The Definitive Guide, 3rd Edition. Massachusetts:
O’REILLY, 2012, ISBN 978-1118530801.
49](https://image.slidesharecdn.com/thesis-170323143759/75/Hadoop-as-an-extension-of-DW-56-2048.jpg)
![[12] SHVACHKO, K. V.: HDFS scalability: the limits to growth [online], [cit. 2014-
11-05].
URL https://www.usenix.org/legacy/publications/login/
2010-04/openpdfs/shvachko.pdf
[13] Apache: HDFS Design [online], [cit. 2014-11-15].
URL http://hadoop.apache.org/docs/r1.2.1/hdfs_
design.html
[14] CAPRIOLO, E.; WAMPLER, D.; RUTHERGLEN, J.: Programming Hive.
Massachusetts: O’REILLY, 2012, ISBN 978-1449319335.
[15] Technologies, D.: Designing Performance-Optimized ODBC Applications
[online], [cit. 2014-11-20].
URL https://www.progress.com/~/media/DataDirect/
Documents/ODBC/Tutorial/odbcdesignperformance.pdf
[16] Technologies, D.: Designing Performance-Optimized JDBC Applications
[online], [cit. 2014-11-20].
URL https://www.progress.com/~/media/DataDirect/
Documents/JDBC/Tutorials/jdbcdesign2.pdf
[17] Qubit: Hive jdbc storage handler [online], [cit. 2014-10-21].
URL https://github.com/QubitProducts/hive-jdbc-
storage-handler
[18] BRADLEY, C.; HOLLINSHEAD, R.; KRAUS, S.; aj.: Data Modeling Consid-
erations in Hadoop and Hive [online], [cit. 2014-11-15].
URL http://support.sas.com/resources/papers/data-
modeling-hadoop.pdf
[19] GATES, A.: Programming Pig. Massachusetts: O’REILLY, 2011, ISBN 978-
1449302641.
[20] EBAY: Kylin: Hadoop OLAP Engine - Tech deep dive [online], [cit. 2014-12-
20].
URL http://www.ebaytechblog.com/2014/10/20/announcing-
kylin-extreme-olap-engine-for-big-data/#.VKgUWyuG_y5
[21] ALLOUCHE, G.: 10 Best Practices for Apache Hive [online], [cit. 2014-11-15].
URL http://www.qubole.com/hive-best-practices/
[22] Berkeley: Big Data benchmark [online], [cit. 2014-12-18].
URL https://amplab.cs.berkeley.edu/benchmark/
[23] KUCERA, R.: Using Hadoop as a platform for Master Data Management
[online], [cit. 2014-11-17].
URL http://www.qubole.com/hive-best-practices/
50](https://image.slidesharecdn.com/thesis-170323143759/75/Hadoop-as-an-extension-of-DW-57-2048.jpg)
![[24] cloumon-oozie contributors: cloumon-oozie [online], [cit. 2014-11-23].
URL https://www.openhub.net/p/cloumon-oozie
[25] LINDSEY, E.: Three-Dimensional Analysis - Data Profiling Techniques. Data
Profiling LLC, 2008, ISBN 978-0980083309.
[26] LOSHIN, D.: Master Data Management. The MK/OMG Press, 2008, ISBN
978-0123742254, 94-96 s.
[27] Contributors, C.: LanguageManual UDF [online], [cit. 2014-11-22].
URL https://cwiki.apache.org/confluence/display/Hive/
LanguageManual+UDF
[28] LOSHIN, D.: The Practitioner’s Guide to Data Quality Improvement (The
Morgan Kaufmann Series on Business Intelligence). San Francisco: Morgan
Kaufmann, 2008, ISBN 978-0123737175.
[29] BOLLINGER, J.: Bollinger on Bollinger Bands. New York: McGraw Hill,
2002, ISBN 978-0071373685.
[30] Oracle: ORACLE BIG DATA CONNECTORS [online], [cit. 2014-12-17].
URL http://www.oracle.com/technetwork/database/
database-technologies/bdc/big-data-connectors/overview/
ds-bigdata-connectors-1453601.pdf?ssSourceSiteId=
ocomen
[31] RevolutionAnalytics: RHadoop [online], [cit. 2014-12-23].
URL https://github.com/RevolutionAnalytics/RHadoop/
wikil
[32] Apache: Storm Documentation [online], [cit. 2014-11-12].
URL https://storm.apache.org/documentation/Home.html
[33] Apache: Spark Streaming Programming Guide [online], [cit. 2014-11-23].
URL http://spark.apache.org/docs/1.0.0/streaming-
programming-guide.html
[34] Apache: Apache Kafka: a high-throughput distributed messaging system
[online], [cit. 2014-11-12].
URL http://kafka.apache.org/documentation.html
[35] Apache: Spark Overview [online], [cit. 2014-11-23].
URL https://spark.apache.org/docs/latest/
[36] Hortonworks: Cluster planning guide [online], [cit. 2014-12-17].
URL http://docs.hortonworks.com/HDPDocuments/HDP1/HDP-
1.3.2/bk_cluster-planning-guide/bk_cluster-planning-
guide-20130731.pdf
51](https://image.slidesharecdn.com/thesis-170323143759/75/Hadoop-as-an-extension-of-DW-58-2048.jpg)


This document discusses issues with processing large volumes of data and proposes an enterprise data warehouse architecture capable of handling big data. It aims to explain integrating Hadoop into existing data warehouses. The first chapter introduces challenges of increased data volume, variety and velocity. It discusses skill shortages in big data and analytics. Existing data warehouses are built for reporting but not analyzing large, unaggregated data. The second chapter outlines requirements for a new architecture and proposes a multi-platform data warehouse environment incorporating Hadoop. It describes Hadoop components like HDFS, YARN, Hive and tools like Sqoop. The third chapter focuses on integrating Hadoop into existing data warehouses by implementing star schemas in Hive, addressing security,


![[IJCT-V3I2P32] Authors: Amarbir Singh, Palwinder Singh](https://cdn.slidesharecdn.com/ss_thumbnails/ijct-v3i2p32-160609071950-thumbnail.jpg?width=640&height=640&fit=bounds)


