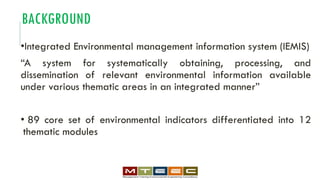
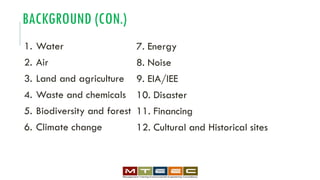
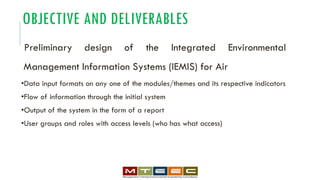
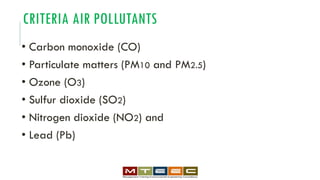
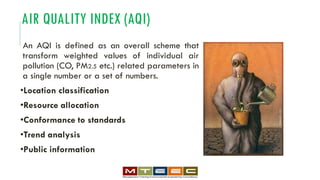
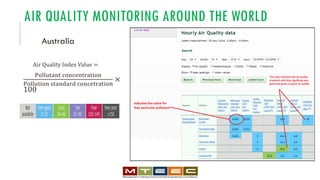
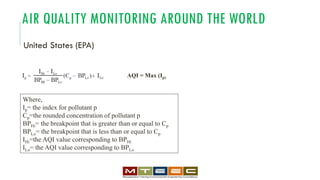
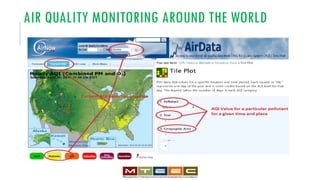
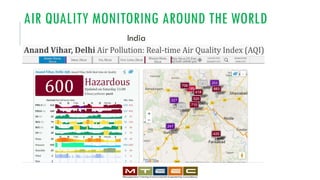
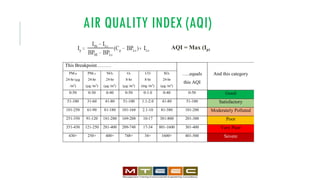
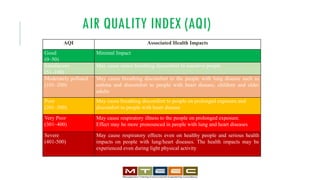
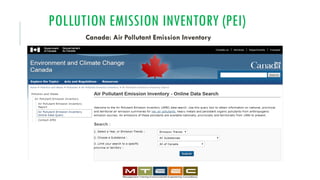
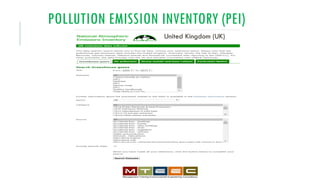
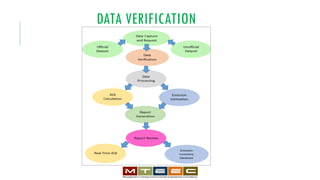
INTEGRATED ENVIRONMENTAL
MANAGEMENT INFORMATION
SYSTEM (IEMIS)
Phase I:
Air Quality Index (AQI) and
Pollution Emission Inventory
(PEI)
BACKGROUND
•Integrated Environmental management information system (IEMIS)
“A system for systematically obtaining, processing, and
dissemination of relevant environmental information available
under various thematic areas in an integrated manner”
• 89 core set of environmental indicators differentiated into 12
thematic modules
BACKGROUND (CON.)
1. Water
2. Air
3. Land and agriculture
4. Waste and chemicals
5. Biodiversity and forest
6. Climate change
7. Energy
8. Noise
9. EIA/IEE
10. Disaster
11. Financing
12. Cultural and Historical sites
OBJECTIVE AND DELIVERABLES
Preliminary design of the Integrated Environmental
Management Information Systems (IEMIS) for Air
•Data input formats on any one of the modules/themes and its respective indicators
•Flow of information through the initial system
•Output of the system in the form of a report
•User groups and roles with access levels (who has what access)
LIMITATIONS OF THE STUDY
•Legality
•Data availability
CRITERIA AIR POLLUTANTS
• Carbon monoxide (CO)
• Particulate matters (PM10 and PM2.5)
• Ozone (O3)
• Sulfur dioxide (SO2)
• Nitrogen dioxide (NO2) and
• Lead (Pb)
IEMIS-AIR
•Air Quality Index (AQI)
•Pollution Emission Inventory (PEI)
AIR QUALITY INDEX (AQI)
An AQI is defined as an overall scheme that
transform weighted values of individual air
pollution (CO, PM2.5 etc.) related parameters in
a single number or a set of numbers.
•Location classification
•Resource allocation
•Conformance to standards
•Trend analysis
•Public information
AIR QUALITY MONITORING AROUND THE WORLD
Australia
Air Quality Index Value =
Pollutant concentration
Pollution standard concetration
×
100
AIR QUALITY MONITORING AROUND THE WORLD
United States (EPA)
Where,
Ip= the index for pollutant p
Cp=the rounded concentration of pollutant p
BPHi= the breakpoint that is greater than or equal to Cp
BPLo= the breakpoint that is less than or equal to Cp
IHi=the AQI value corresponding to BPHi
ILo= the AQI value corresponding to BPLo
AQI = Max (Ip)
AIR QUALITY MONITORING AROUND THE WORLD
India
AIR QUALITY INDEX (AQI)
AQI = Max (Ip)
This Breakpoint………
…..equals
this AQI
And this categoryPM10
24-hr (µg
/m3
)
PM2.5
24-hr
(µg /m3)
NO2
24-hr
(µg /m3)
O3
8-hr
(µg /m3
)
CO
8-hr
(mg /m3)
SO2
24-hr
(µg /m3
)
0-50 0-30 0-40 0-50 0-1.0 0-40 0-50 Good
51-100 31-60 41-80 51-100 1.1-2.0 41-80 51-100 Satisfactory
101-250 61-90 81-180 101-168 2.1-10 81-380 101-200 Moderately Polluted
251-350 91-120 181-280 169-208 10-17 381-800 201-300 Poor
351-430 121-250 281-400 209-748 17-34 801-1600 301-400 Very Poor
430+ 250+ 400+ 748+ 34+ 1600+ 401-500 Severe
AIR QUALITY INDEX (AQI)
AQI Associated Health Impacts
Good
(0–50)
Minimal Impact
Satisfactory
(51–100)
May cause minor breathing discomfort to sensitive people
Moderately polluted
(101–200)
May cause breathing discomfort to the people with lung disease such as
asthma and discomfort to people with heart disease, children and older
adults
Poor
(201–300)
May cause breathing discomfort to people on prolonged exposure and
discomfort to people with heart disease
Very Poor
(301–400)
May cause respiratory illness to the people on prolonged exposure.
Effect may be more pronounced in people with lung and heart diseases
Severe
(401-500)
May cause respiratory effects even on healthy people and serious health
impacts on people with lung/heart diseases. The health impacts may be
experienced even during light physical activity
POLLUTION EMISSION INVENTORY (PEI)
Canada: Air Pollutant Emission Inventory
POLLUTION EMISSION INVENTORY (PEI)
United Kingdom (UK)
DATA VERIFICATION

Integrated Environmental Management Information System (IEMIS)

  • 1.
    INTEGRATED ENVIRONMENTAL MANAGEMENT INFORMATION SYSTEM(IEMIS) Phase I: Air Quality Index (AQI) and Pollution Emission Inventory (PEI)
  • 2.
    BACKGROUND •Integrated Environmental managementinformation system (IEMIS) “A system for systematically obtaining, processing, and dissemination of relevant environmental information available under various thematic areas in an integrated manner” • 89 core set of environmental indicators differentiated into 12 thematic modules
  • 3.
    BACKGROUND (CON.) 1. Water 2.Air 3. Land and agriculture 4. Waste and chemicals 5. Biodiversity and forest 6. Climate change 7. Energy 8. Noise 9. EIA/IEE 10. Disaster 11. Financing 12. Cultural and Historical sites
  • 4.
    OBJECTIVE AND DELIVERABLES Preliminarydesign of the Integrated Environmental Management Information Systems (IEMIS) for Air •Data input formats on any one of the modules/themes and its respective indicators •Flow of information through the initial system •Output of the system in the form of a report •User groups and roles with access levels (who has what access)
  • 5.
    LIMITATIONS OF THESTUDY •Legality •Data availability
  • 6.
    CRITERIA AIR POLLUTANTS •Carbon monoxide (CO) • Particulate matters (PM10 and PM2.5) • Ozone (O3) • Sulfur dioxide (SO2) • Nitrogen dioxide (NO2) and • Lead (Pb)
  • 7.
    IEMIS-AIR •Air Quality Index(AQI) •Pollution Emission Inventory (PEI)
  • 8.
    AIR QUALITY INDEX(AQI) An AQI is defined as an overall scheme that transform weighted values of individual air pollution (CO, PM2.5 etc.) related parameters in a single number or a set of numbers. •Location classification •Resource allocation •Conformance to standards •Trend analysis •Public information
  • 9.
    AIR QUALITY MONITORINGAROUND THE WORLD Australia Air Quality Index Value = Pollutant concentration Pollution standard concetration × 100
  • 10.
    AIR QUALITY MONITORINGAROUND THE WORLD United States (EPA) Where, Ip= the index for pollutant p Cp=the rounded concentration of pollutant p BPHi= the breakpoint that is greater than or equal to Cp BPLo= the breakpoint that is less than or equal to Cp IHi=the AQI value corresponding to BPHi ILo= the AQI value corresponding to BPLo AQI = Max (Ip)
  • 11.
    AIR QUALITY MONITORINGAROUND THE WORLD
  • 12.
    AIR QUALITY MONITORINGAROUND THE WORLD India
  • 13.
    AIR QUALITY INDEX(AQI) AQI = Max (Ip) This Breakpoint……… …..equals this AQI And this categoryPM10 24-hr (µg /m3 ) PM2.5 24-hr (µg /m3) NO2 24-hr (µg /m3) O3 8-hr (µg /m3 ) CO 8-hr (mg /m3) SO2 24-hr (µg /m3 ) 0-50 0-30 0-40 0-50 0-1.0 0-40 0-50 Good 51-100 31-60 41-80 51-100 1.1-2.0 41-80 51-100 Satisfactory 101-250 61-90 81-180 101-168 2.1-10 81-380 101-200 Moderately Polluted 251-350 91-120 181-280 169-208 10-17 381-800 201-300 Poor 351-430 121-250 281-400 209-748 17-34 801-1600 301-400 Very Poor 430+ 250+ 400+ 748+ 34+ 1600+ 401-500 Severe
  • 14.
    AIR QUALITY INDEX(AQI) AQI Associated Health Impacts Good (0–50) Minimal Impact Satisfactory (51–100) May cause minor breathing discomfort to sensitive people Moderately polluted (101–200) May cause breathing discomfort to the people with lung disease such as asthma and discomfort to people with heart disease, children and older adults Poor (201–300) May cause breathing discomfort to people on prolonged exposure and discomfort to people with heart disease Very Poor (301–400) May cause respiratory illness to the people on prolonged exposure. Effect may be more pronounced in people with lung and heart diseases Severe (401-500) May cause respiratory effects even on healthy people and serious health impacts on people with lung/heart diseases. The health impacts may be experienced even during light physical activity
  • 15.
    POLLUTION EMISSION INVENTORY(PEI) Canada: Air Pollutant Emission Inventory
  • 16.
    POLLUTION EMISSION INVENTORY(PEI) United Kingdom (UK)
  • 17.