The document outlines a workbook designed for calculating various thermodynamic properties such as activities, activity coefficients, and excess Gibbs energies using different models like Margules, NRTL, and UNIQUAC. It provides structured spreadsheets and data input tables for systems such as methanol and benzene, facilitating both vapor-liquid and liquid-liquid equilibrium calculations. All worksheets are password-protected but allow for user modifications of specified cells to enable common calculations.

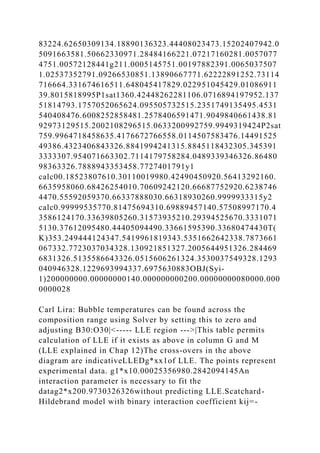
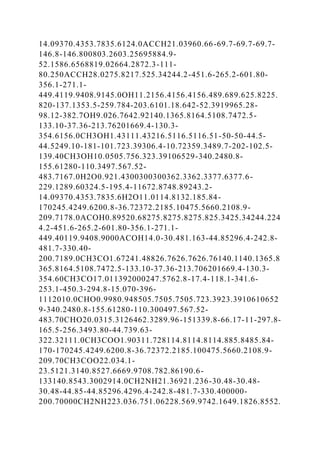
![1Si(qitij)0.58557180821.00254491531.722067821211qj/Si(qitij)
0.89513770920.1821440870.016986731600qj/Si(qitij)0.5245226
8930.66606828830.014570230300Sj{qjtkj/(Siqitij)}1.08580479
540.50289920312.65870615711.09426852781.0942685278Sj{qj
tkj/(Siqitij)}1.20148486080.8648472962.13048114581.2051612
0791.2051612079ln(gresid)0.03116865621.4128796063-
2.9367862652-0.2262444667-
0.1348039948ln(gresid)0.46715423790.3813892978-
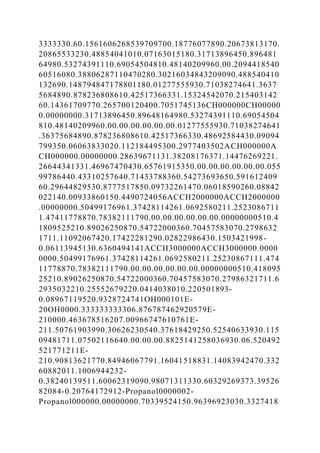
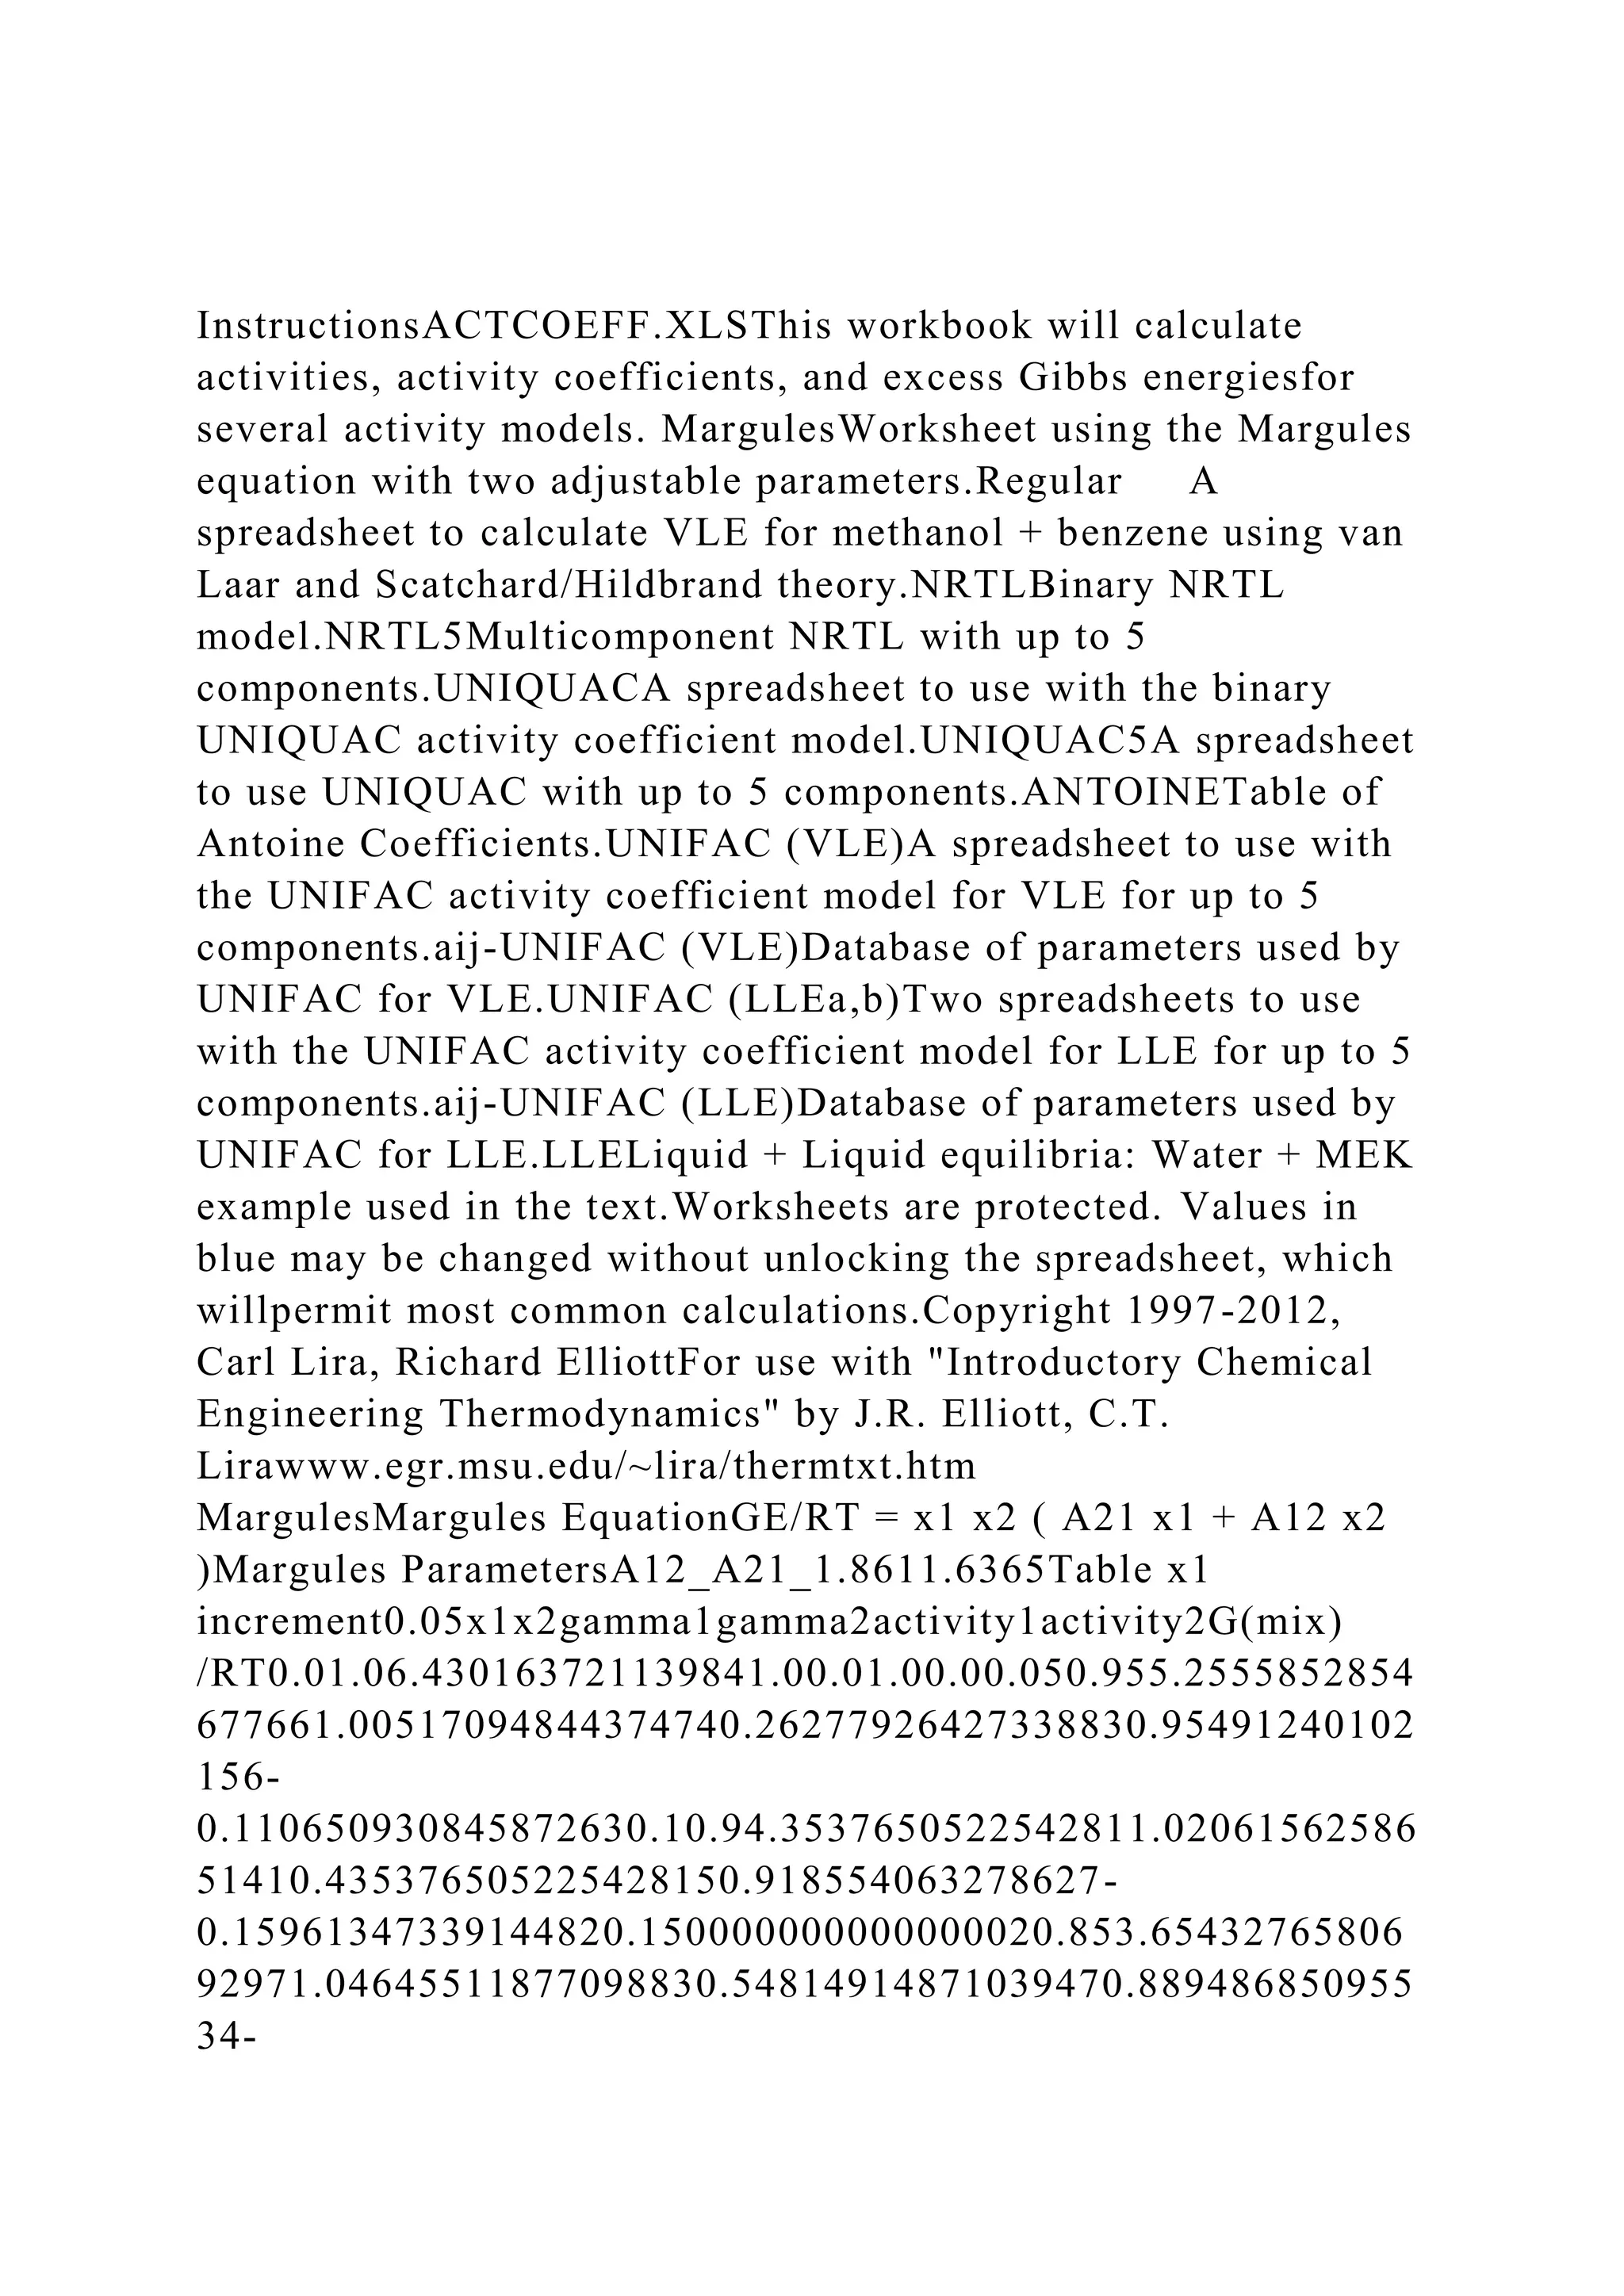
3.4685423717-0.4923868989-0.2933805272ZOOM in to see
subscripts clearly, the i's and j's look the same when the font is
small.
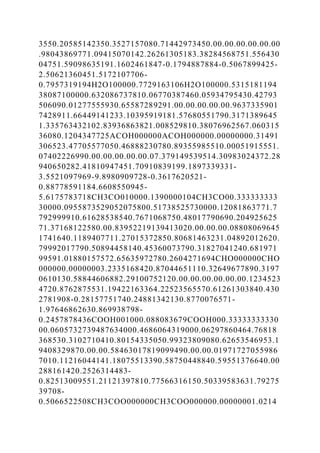
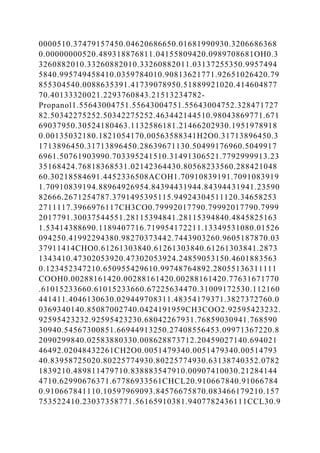
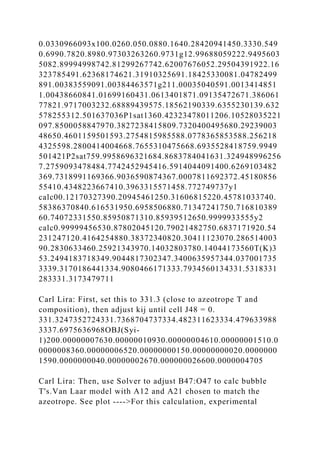
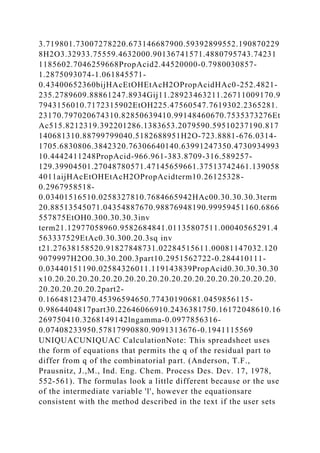
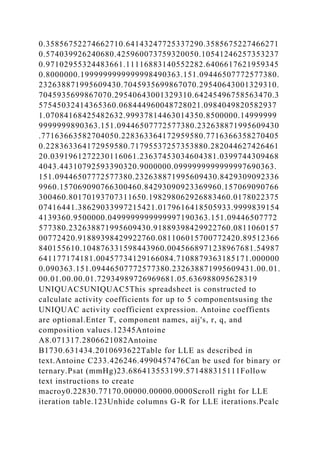
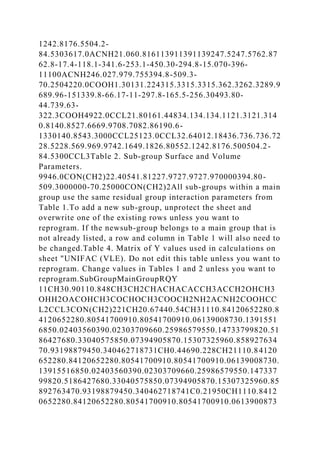
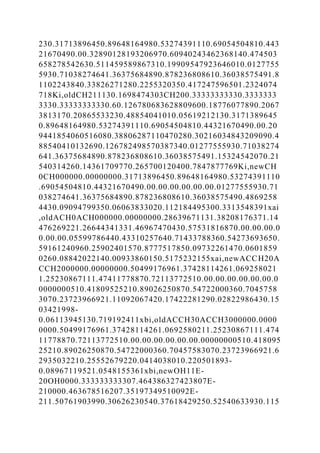
UNIFAC (VLE)Instructions: Type the temperature of interest in
centigrade. Then enter the numberof occurences of each
functional group in each component.Further instructions are
given in comment boxes. Use View…Comment…to show or
hide them.P=745.515921082
Carl Lira: As distributed, this cell has a formula to calculate the
bubble pressure.mmHgT(oC)=80.37oCTable 1. Antoine
Coefficients (mmHg) log10(Psat)=A-B/(T+C) where T[=]
oCcomp1comp2comp3comp4comp5A
8.878298.071318.11226.87632
Carl Lira: Enter Antoine constants or vapor pressures if you
want bubble P and vapor phase concentrations calculated
automatically.B2010.331730.631592.8641075.78C252.636233.4
26226.184233.205Psat[mmHg]694.0196169646359.8872025002
824.45941979472790.1373883836yi0.589630.410370.000000.00
0000.00000
Carl Lira: Vapor phase mole fractions calculated
automatically.Table 2. Component Structure Information and
Activity Coefficient
Calculation.comp1comp2comp3comp4comp5IPAWaterC2-
COOHEtOHC5H12xi0.5000.5000.0000.0000.000](https://image.slidesharecdn.com/instructionsactcoeff-221122033743-66c514cf/85/InstructionsACTCOEFF-XLSThis-workbook-will-calculate-activities-a-docx-18-320.jpg)
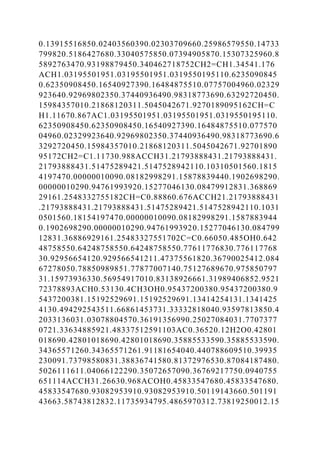
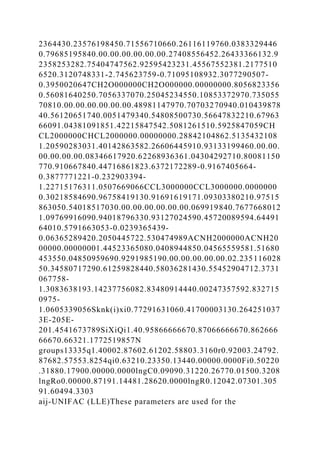
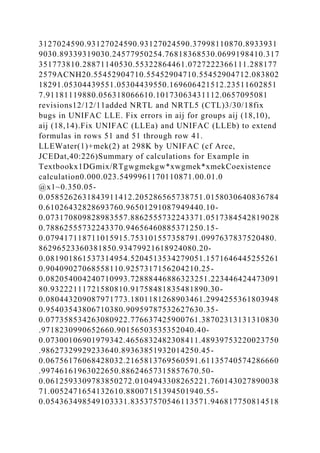
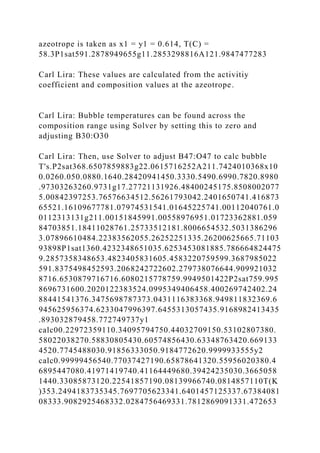
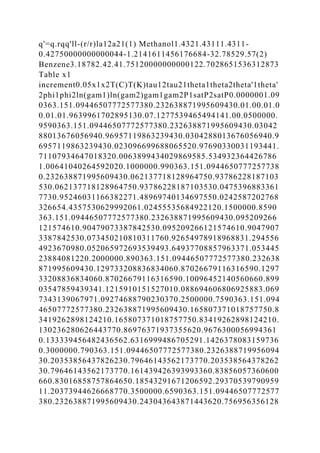
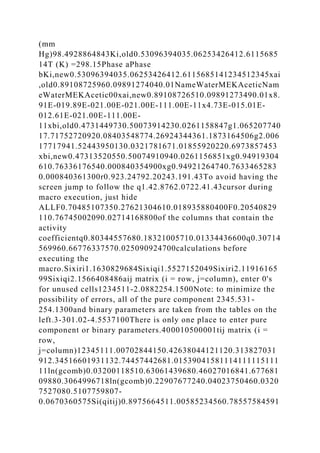
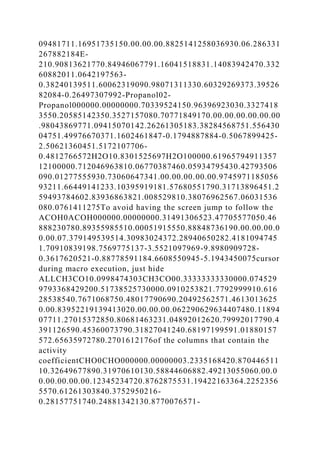
![64220COOH1.30131.2244922CCL21.80161.4485123CCL32.640
12.1849946CON(CH2)22.40541.812
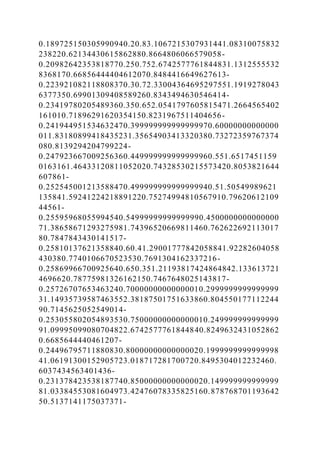
UNIFAC (LLEa)Liquid-liquid calculation using UNIFAC LLE.
Sheet for first liquid phase. See also "UNIFAC
(LLEb)".Instructions: Type the temperature of interest in
centigrade. Then enter the numberof occurences of each
functional group in each component. If you have less than
5components, type a samll number like 1E-20 for the mole
fractions of the absent components. If you wantthe pressure to
be computed automatically, you must enter the Antoine
coefficients of the components. To use different functional
groups than those provided,follow the instructions on the aij-
UNIFAC sheet.
Carl Lira: This sheet does not yet have the cabability for
specification of other functional groups without editing "aij-
UNIFAC (LLE)". That will be provided in the
future.Note:hidden P=86.4463839648mmHgcolumns with -><-
T(oC)=25oCintermediate calcsAntoine Coefficients (mmHg)
log10(Psat)=A-B/(T+C) where T[=]
oCcomp1comp2comp3comp4comp5Note: MeOH is not a unique
group in the citation used to A 8.071317.2806621082develop
this sheet.B1730.631434.2010693622T. Magnussen, P.
Rasmussen, A. Fredenslund, C233.426246.4990457476Ind. Eng.
Chem. Process Des. Dev., 1981, 20, 331-
339.Psat[mmHg]23.686413553199.571488315111yi0.260790.73
7630.001580.000000.00000a phase123comp4comp5Table for
LLE as described in text.WaterMEKc2-COOHEtOHC5H12Can
be used for binary or
ternary.x0.8300.1000.0700.0000.000XiQSi(QiYij)Qj/Si(QiYij)S
j{QjYkj/(SiQiYij)}ln GFollow text instructions to create
macrogi1.1476.4141.9511.705199.114Sinj(i)xi1.02.03.045.0mix
1.02.03.045.0mix1.02.03.045.0mix1.02.03.045.0mix1.02.03.045
.0mix1.02.03.045.0mix123CH311120.1698474303CH300.33333
333330.33333333330.33333333330.40.126780683628809600.29
485396380.32465543640.32766615150.51145958990.08824244](https://image.slidesharecdn.com/instructionsactcoeff-221122033743-66c514cf/85/InstructionsACTCOEFF-XLSThis-workbook-will-calculate-activities-a-docx-29-320.jpg)
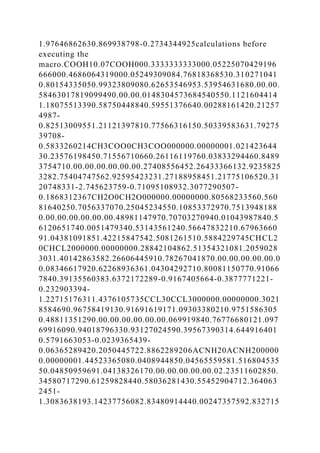
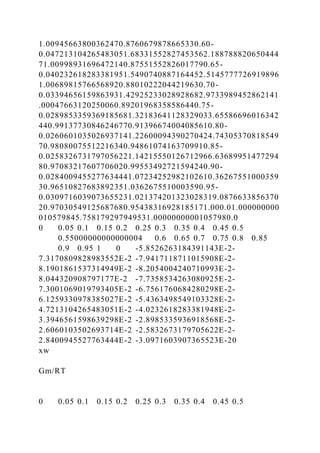
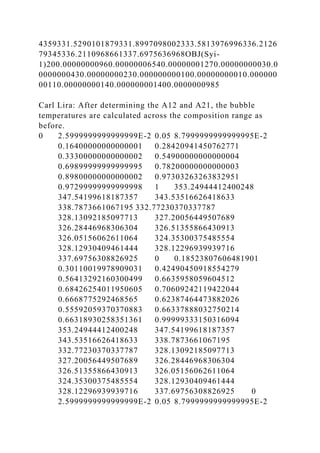
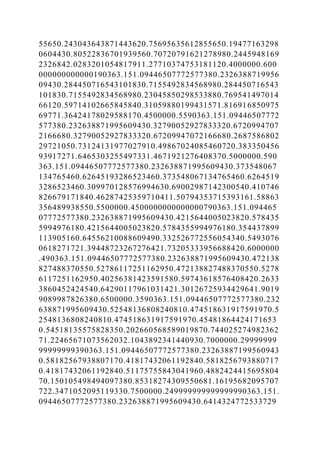
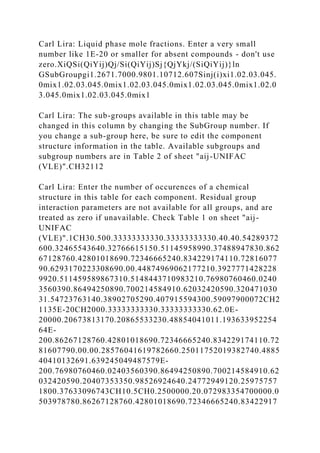
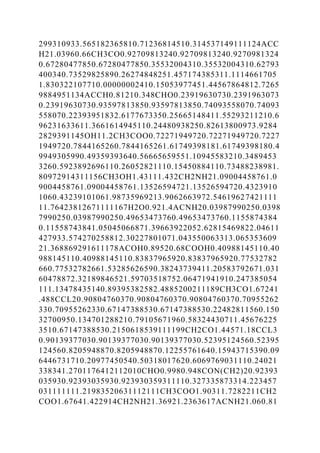
![0975-
1.1461643172Sknk(i)xi0.83015256970.29954229080.213E-
205E-
201.3396948605SiXiQi1.40.95866666670.87066666670.862666
66670.66321.2183481889N
groups13335q1.40002.87602.61202.58803.3160r0.92003.24792.
87682.57553.8254qi0.71200.17590.11200.00000.0000Fi0.59230
.25150.15620.00000.0000lngC0.06060.44300.37950.06760.4747
lngRo0.00000.87191.14481.28620.0000lngR0.07612.28741.433
91.75224.8192
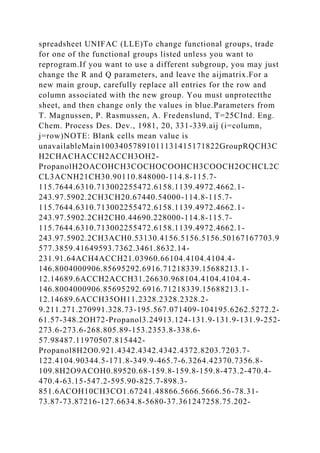
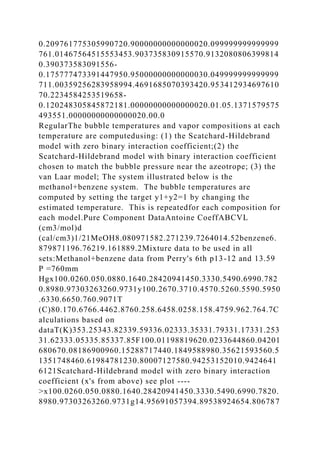
UNIFAC (LLEb)Second liquid phase for LLE calculations.This
sheet should be used in conjunction with "UNIFAC (LLEa)".The
liquid phase mole fractions are the only variables that should be
changed on this sheet.All component information is entered on
"UNIFAC (LLEa)" and replicated here
automatically.Note:hidden P=85.6032342484mmHgcolumns
with -><-T(oC)=25oCintermediate calcsAntoine Coefficients
(mmHg) log10(Psat)=A-B/(T+C) where T[=]
oCcomp1comp2comp3comp4comp5A
8.071317.2806621082000B1730.631434.2010693622000b
phaseC233.426246.4990457476000Psat[mmHg]23.68641355319
9.571488315111yi0.260790.737630.001580.000000.00000comp
1comp2comp3comp4comp5WaterMEKc2-
COOHEtOHC5H12x0.7730.1390.0880.0000.000XiQSi(QiYij)Qj
/Si(QiYij)Sj{QjYkj/(SiQiYij)}ln
Ggi1.2354.5411.5351.396104.701Sinj(i)xi1.02.03.045.0mix1.02
.03.045.0mix1.02.03.045.0mix1.02.03.045.0mix1.02.03.045.0mi
x1.02.03.045.0mixCH3011120.2270836894CH300.33333333330
.33333333330.33333333330.40.1561606268539709700.2948539
6380.32465543640.32766615150.51145958990.11248586810.31
713896450.89648164980.53274391110.69054504810.48140209
960.00.32890128193206970.60940243462368140.47450365827
8542630.511459589867310.233663019273376650.01277555930
.71038274641.36375684890.878236808610.42517366331.81102
243840.33826271280.2255320350.417247596501.1073851621C
H2011130.2270836894CH200.33333333330.33333333330.3333](https://image.slidesharecdn.com/instructionsactcoeff-221122033743-66c514cf/85/InstructionsACTCOEFF-XLSThis-workbook-will-calculate-activities-a-docx-33-320.jpg)