Downloaded 11 times

![[ ]
where t ∈ 2006,2010 and each average yearly growth rate receives the same
weight wt.
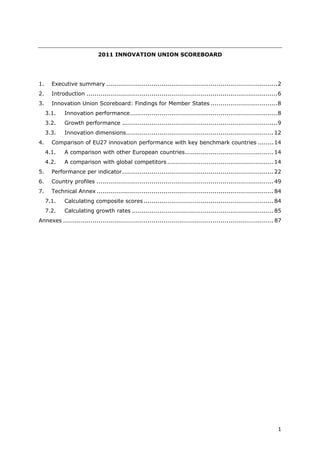
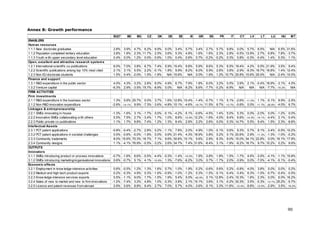
7.3. International benchmarking
The methodology for calculating average innovation performance for the EU27 and its
major global competitors has been revised with regard to that used in the IUS 2010.
In the IUS 2010 the average performance scores were calculated as:
1. Calculate index scores for all indicators by dividing the value for each country
by that of the EU27 as 100*Xi/XEU27 (where X is the indicator and i is the
country)
2. Calculate the arithmetic average over the index scores (= INDEXi)
3. The performance gap/lead to the EU27 is then equal to INDEXi - 100 (cf.
Figure 9 in IUS 2010 report)
Note that the results for country i are therefore independent from the other countries.
In the IUS 2011 we follow a similar methodology to that used for calculating average
innovation performance for the EU Member States:
1. Calculate normalised scores for all indicators as follows: Yi = ((Xi - smallest X
for all countries) / (largest X for all countries – smallest X for all countries)
such that all normalised scores are between 0 and 1
2. Calculate the arithmetic average over these index scores (CIi)
3. Calculate performance relative to that of the EU27: CIi* = 100*CIi/CIEU27
4. The performance gap/lead to the EU27 is then equal to CIi* - 100 (cf. Figure
11)
Note that the results for country i are therefore dependent on the data from the other
countries as the smallest and largest scores used in the normalisation procedure are
calculated over all countries.
86](https://image.slidesharecdn.com/ius-2011en-120211064622-phpapp01/85/INNOVATION-UNION-SCOREBOARD-2011-87-320.jpg)
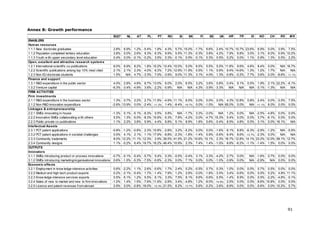
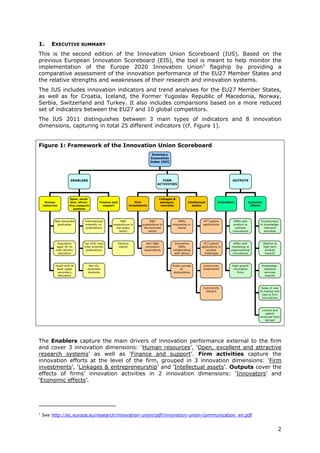
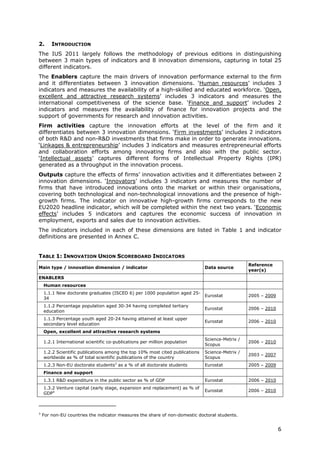
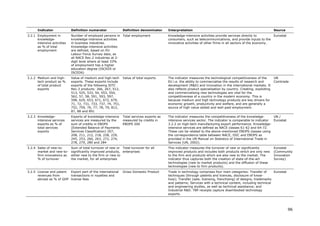
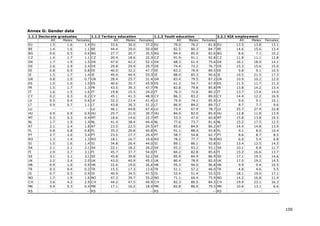
![Indicator Definition numerator Definition denominator Interpretation Source
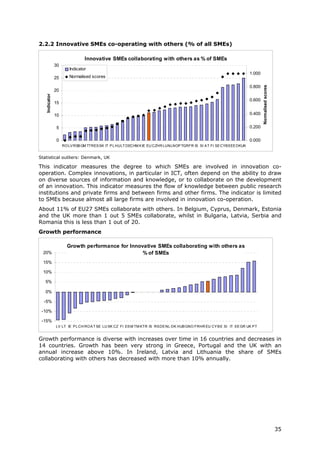
2.2.2 Innovative SMEs Sum of SMEs with innovation Total number of SMEs This indicator measures the degree to which SMEs are involved in Eurostat
collaborating with co-operation activities, i.e. innovation co-operation. Complex innovations, in particular in ICT, (Community
others (% of SMEs) those firms that had any co- often depend on the ability to draw on diverse sources of Innovation
operation agreements on information and knowledge, or to collaborate on the development Survey)
innovation activities with other of an innovation. This indicator measures the flow of knowledge
enterprises or institutions in the between public research institutions and firms and between firms
three years of the survey period and other firms. The indicator is limited to SMEs because almost
all large firms are involved in innovation co-operation.
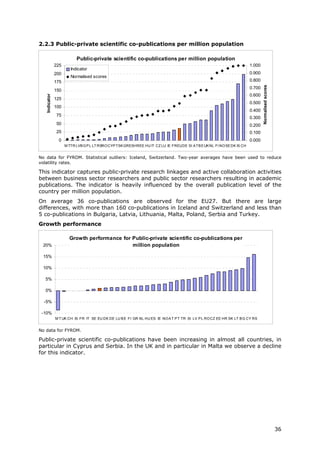
2.2.3 Public-private co- Number of public-private co- Total population This indicator captures public-private research linkages and active CWTS /
publications per authored research publications. collaboration activities between business sector researchers and Thomson
million population The definition of the "private public sector researchers resulting in academic publications. Reuters
sector" excludes the private
medical and health sector.
Publications are assigned to the
country/countries in which the
business companies or other
private sector organisations are
located
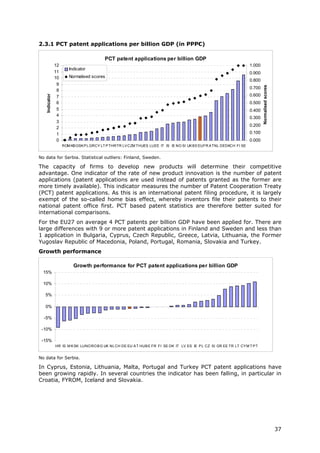
2.3.1 PCT patent Number of patent applications Gross Domestic Product in The capacity of firms to develop new products will determine their OECD /
applications per filed under the PCT, at Purchasing Power Parity competitive advantage. One indicator of the rate of new product Eurostat
billion GDP (in international phase, designating Euros innovation is the number of patents. This indicator measures the
PPP€) the European Patent Office number of PCT patent applications.
(EPO). Patent counts are based
on the priority date, the
inventor’s country of residence
and fractional counts.
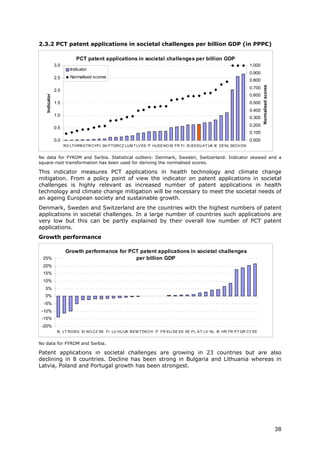
2.3.2 PCT patent Number of PCT patent Gross Domestic Product in This indicator measures PCT applications in health technology and OECD /
applications in applications in Climate change Purchasing Power Parity climate change mitigation and is highly relevant as increased Eurostat
societal challenges mitigation and Health. Patents Euros numbers of patent applications in health technology and climate
per billion GDP (in in Climate change mitigation change mitigation will be necessary to meet the societal needs of
PPP€) equal those in Renewable an ageing European society and sustainable growth.
energy, Electric and hybrid
vehicles and Energy efficiency
in buildings and lighting.
Patents in health-related
technologies include those in
Medical technology (IPC codes
(8th edition) A61[B, C, D, F, G,
H, J, L, M, N], H05G) and
Pharmaceuticals (IPC codes
A61K excluding A61K8)
94](https://image.slidesharecdn.com/ius-2011en-120211064622-phpapp01/85/INNOVATION-UNION-SCOREBOARD-2011-95-320.jpg)

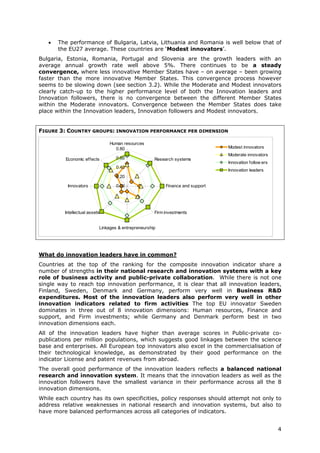
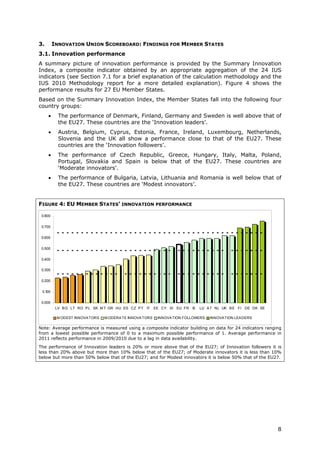
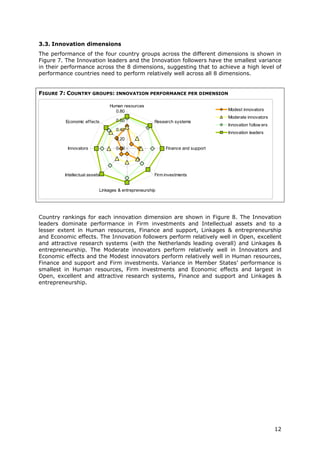
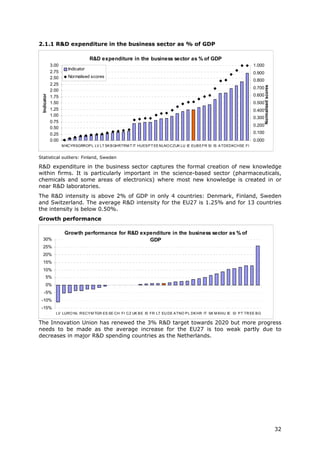
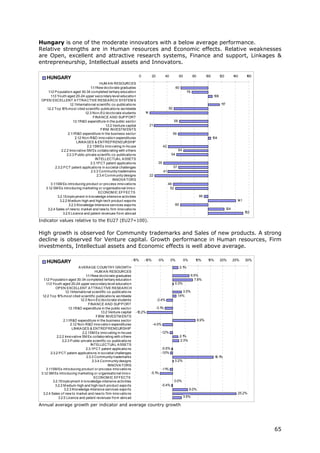
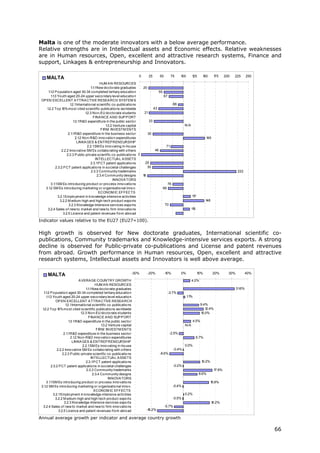
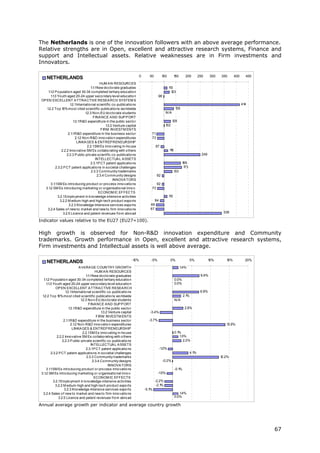
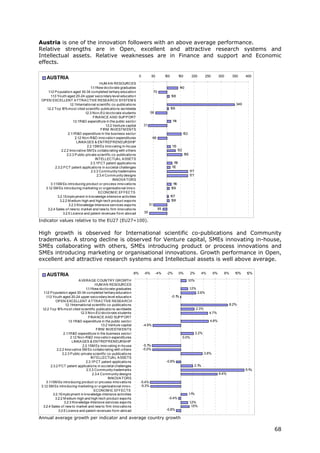
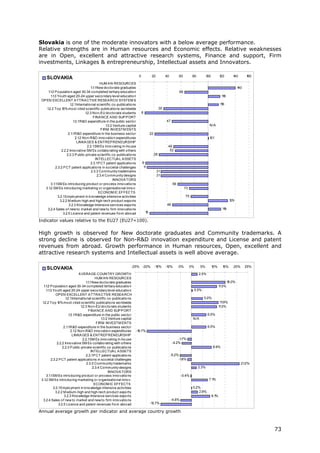
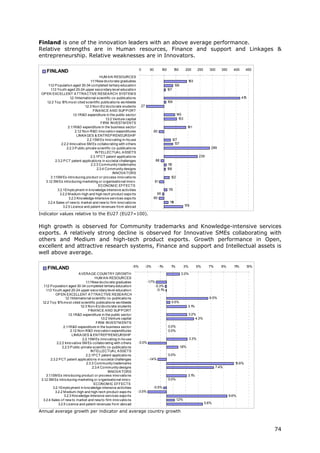
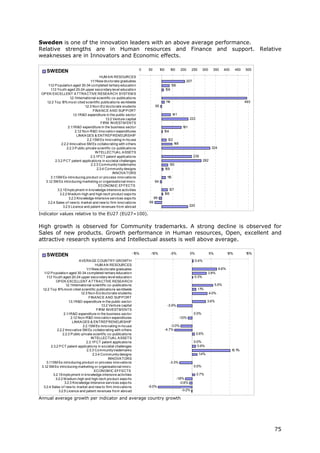
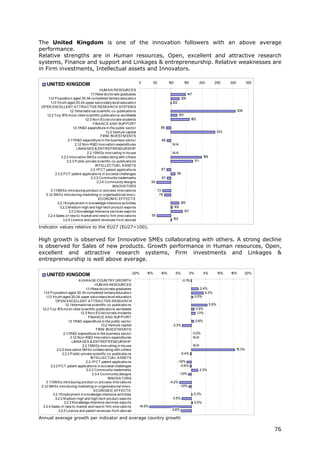
This document is the 2011 Innovation Union Scoreboard which assesses and compares the innovation performance of EU member states. Some key findings include: - Denmark, Finland, Germany and Sweden are designated as "Innovation leaders" with above average performance. Other countries fall into groups of "Innovation followers", "Moderate innovators" or "Modest innovators". - Innovation leaders tend to have well-balanced innovation systems across dimensions like human resources, research systems, firm investments, and commercialization of knowledge. - Moderate and modest innovators are characterized by less balanced systems and lower rates of product/process innovations by SMEs. However, their growth rates have been higher on average.


![Innovation[1]](https://cdn.slidesharecdn.com/ss_thumbnails/innovation1-091021125332-phpapp02-thumbnail.jpg?width=640&height=640&fit=bounds)


