Download to read offline
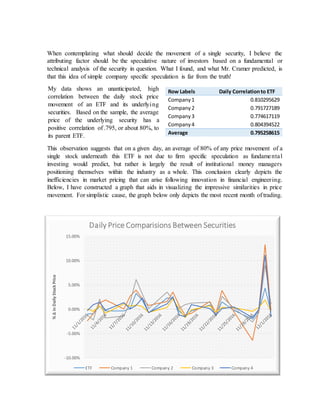

The document discusses a trading strategy based on the influence of sector ETFs on individual stock price movements, revealing that approximately 80% of these movements are driven by institutional investment behavior rather than company fundamentals. The author proposes a method for categorizing stocks within an ETF to exploit market inefficiencies, suggesting long positions in 'good' stocks when the ETF is down and short positions in 'bad' stocks when the ETF is up. Ultimately, it emphasizes the importance of understanding short-term market dynamics while acknowledging that long-term analysis will reflect fundamental values.


