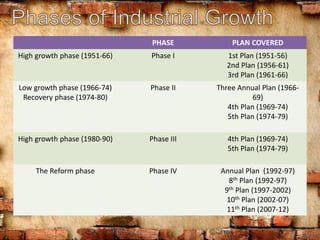
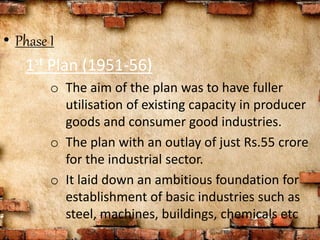
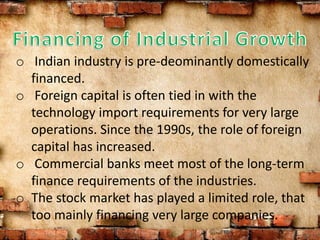
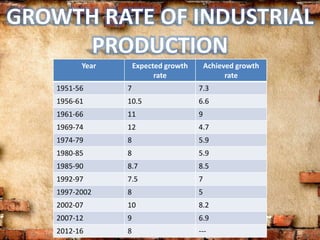
The document summarizes India's industrial development plans from 1951 to the present. It discusses 5 phases of growth: high growth from 1951-1966; low growth from 1966-1974; recovery from 1974-1980; high growth from 1980-1990; and reform phase from 1992 onwards. Key aspects included the establishment of public sector industries, shifting focus from consumer to capital goods, liberalization policies from the 8th Plan onwards, and challenges facing industry such as global competitiveness and infrastructure development. Achieved industrial growth generally lagged targeted rates except for brief high growth periods.
Characteristics of underdeveloped economiesGeorgi Mathew
discussing the features of under developed or developing countries with special reference to India. helpful for school and college who try to understand the characteristics of Indian economy from the angle of developing economy.
Characteristics of underdeveloped economiesGeorgi Mathew
discussing the features of under developed or developing countries with special reference to India. helpful for school and college who try to understand the characteristics of Indian economy from the angle of developing economy.
5 year plans of pakistan by brands academyBrands Academy
Brand Academy provides details brand analysis, research, article and insights for free.
Contact us :
brandsmentor@gmail.com
https://www.facebook.com/1stbrandsacademy
Pakistan Five Year Development PlansSince 1955 to 2010An Overview
Introduction
Almost all five-year plans prepared during political or military regimes were shelved in the country’s history after regime change and none of them succeeded in getting the desired results.
Pakistan has a semi-industrialized economy, which mainly encompasses textiles, chemicals, food processing, agriculture and other industries.
The economy has suffered in the past from decades of internal political
disputes, a fast growing population and ongoing confrontation with
neighboring India.
Pakistan's average economic growth rate since independence has been higher than the average growth rate of the world economy during the period.
Average annual real GDP growth rates were 6.8% in the 1960s, 4.8% in the 1970s, and 6.5% in the 1980s. Average annual growth fell to 4.6% in the 1990s with significantly lower growth in the second half of that decade.
Introduction
Two wars with India, in Second Kashmir War 1965 and Bangladesh Liberation War 1971 and separation of Bangladesh adversely affected economic growth. In particular, the latter war brought the economy close to recession, although economic output rebounded sharply until the nationalizations of the mid-1970s.
Pakistan is aggressively cutting tariffs and assisting exports by improving ports, roads, electricity supplies and irrigation projects. Islamabad has doubled development spending from about 2% of GDP in the 1990s to 4% in 2003, a necessary step towards reversing the broad underdevelopment of its social sector.
First Five Year Plan (1955-1960) Highlights
Targets
Emphasis mainly on achieving high national income.
The First Plan was implemented within certain obvious handicaps and limitations and its release was delayed by two Years.
In practice, this plan was not implemented, however, mainly because political instability led to a neglect of economic policy, but government, Deputy Chairman Planning Board (Commission) Said Hassan announces the plan in 1957.
The development expenditures were regarded as the foundation for rapid progress in the future and plans explicitly affirmed that some sectors of the economy must be expanded much more rapidly than others in order to secure maximum gains.
The size of the First Plan initially was Rs. 11.5 billion which was revised and decreased to 10.8 billion out of which Rs. 750 million for the public sector and Rs. 3.3 billion for the private sector was allocated. Of the total plan amount of Rs. 6.6 billion from the internal sources and R.s 4.2 billion was to be achieve from the foreign sources in the form of loans and aid.
First Five Year Plan (1955-1960) Highlights
Achievements/Failure
Currently pi network is not tradable on binance or any other exchange because we are still in the enclosed mainnet.
Right now the only way to sell pi coins is by trading with a verified merchant.
What is a pi merchant?
A pi merchant is someone verified by pi network team and allowed to barter pi coins for goods and services.
Since pi network is not doing any pre-sale The only way exchanges like binance/huobi or crypto whales can get pi is by buying from miners. And a merchant stands in between the exchanges and the miners.
I will leave the telegram contact of my personal pi merchant. I and my friends has traded more than 6000pi coins successfully
Tele-gram
@Pi_vendor_247
how to sell pi coins in all Africa Countries.DOT TECH
Yes. You can sell your pi network for other cryptocurrencies like Bitcoin, usdt , Ethereum and other currencies And this is done easily with the help from a pi merchant.
What is a pi merchant ?
Since pi is not launched yet in any exchange. The only way you can sell right now is through merchants.
A verified Pi merchant is someone who buys pi network coins from miners and resell them to investors looking forward to hold massive quantities of pi coins before mainnet launch in 2026.
I will leave the telegram contact of my personal pi merchant to trade with.
@Pi_vendor_247
Turin Startup Ecosystem 2024 - Ricerca sulle Startup e il Sistema dell'Innov...Quotidiano Piemontese
Turin Startup Ecosystem 2024
Una ricerca de il Club degli Investitori, in collaborazione con ToTeM Torino Tech Map e con il supporto della ESCP Business School e di Growth Capital
Poonawalla Fincorp and IndusInd Bank Introduce New Co-Branded Credit Cardnickysharmasucks
The unveiling of the IndusInd Bank Poonawalla Fincorp eLITE RuPay Platinum Credit Card marks a notable milestone in the Indian financial landscape, showcasing a successful partnership between two leading institutions, Poonawalla Fincorp and IndusInd Bank. This co-branded credit card not only offers users a plethora of benefits but also reflects a commitment to innovation and adaptation. With a focus on providing value-driven and customer-centric solutions, this launch represents more than just a new product—it signifies a step towards redefining the banking experience for millions. Promising convenience, rewards, and a touch of luxury in everyday financial transactions, this collaboration aims to cater to the evolving needs of customers and set new standards in the industry.
Latino Buying Power - May 2024 Presentation for Latino CaucusDanay Escanaverino
Unlock the potential of Latino Buying Power with this in-depth SlideShare presentation. Explore how the Latino consumer market is transforming the American economy, driven by their significant buying power, entrepreneurial contributions, and growing influence across various sectors.
**Key Sections Covered:**
1. **Economic Impact:** Understand the profound economic impact of Latino consumers on the U.S. economy. Discover how their increasing purchasing power is fueling growth in key industries and contributing to national economic prosperity.
2. **Buying Power:** Dive into detailed analyses of Latino buying power, including its growth trends, key drivers, and projections for the future. Learn how this influential group’s spending habits are shaping market dynamics and creating opportunities for businesses.
3. **Entrepreneurial Contributions:** Explore the entrepreneurial spirit within the Latino community. Examine how Latino-owned businesses are thriving and contributing to job creation, innovation, and economic diversification.
4. **Workforce Statistics:** Gain insights into the role of Latino workers in the American labor market. Review statistics on employment rates, occupational distribution, and the economic contributions of Latino professionals across various industries.
5. **Media Consumption:** Understand the media consumption habits of Latino audiences. Discover their preferences for digital platforms, television, radio, and social media. Learn how these consumption patterns are influencing advertising strategies and media content.
6. **Education:** Examine the educational achievements and challenges within the Latino community. Review statistics on enrollment, graduation rates, and fields of study. Understand the implications of education on economic mobility and workforce readiness.
7. **Home Ownership:** Explore trends in Latino home ownership. Understand the factors driving home buying decisions, the challenges faced by Latino homeowners, and the impact of home ownership on community stability and economic growth.
This SlideShare provides valuable insights for marketers, business owners, policymakers, and anyone interested in the economic influence of the Latino community. By understanding the various facets of Latino buying power, you can effectively engage with this dynamic and growing market segment.
Equip yourself with the knowledge to leverage Latino buying power, tap into their entrepreneurial spirit, and connect with their unique cultural and consumer preferences. Drive your business success by embracing the economic potential of Latino consumers.
**Keywords:** Latino buying power, economic impact, entrepreneurial contributions, workforce statistics, media consumption, education, home ownership, Latino market, Hispanic buying power, Latino purchasing power.
The secret way to sell pi coins effortlessly.DOT TECH
Well as we all know pi isn't launched yet. But you can still sell your pi coins effortlessly because some whales in China are interested in holding massive pi coins. And they are willing to pay good money for it. If you are interested in selling I will leave a contact for you. Just telegram this number below. I sold about 3000 pi coins to him and he paid me immediately.
Telegram: @Pi_vendor_247
Resume
• Real GDP growth slowed down due to problems with access to electricity caused by the destruction of manoeuvrable electricity generation by Russian drones and missiles.
• Exports and imports continued growing due to better logistics through the Ukrainian sea corridor and road. Polish farmers and drivers stopped blocking borders at the end of April.
• In April, both the Tax and Customs Services over-executed the revenue plan. Moreover, the NBU transferred twice the planned profit to the budget.
• The European side approved the Ukraine Plan, which the government adopted to determine indicators for the Ukraine Facility. That approval will allow Ukraine to receive a EUR 1.9 bn loan from the EU in May. At the same time, the EU provided Ukraine with a EUR 1.5 bn loan in April, as the government fulfilled five indicators under the Ukraine Plan.
• The USA has finally approved an aid package for Ukraine, which includes USD 7.8 bn of budget support; however, the conditions and timing of the assistance are still unknown.
• As in March, annual consumer inflation amounted to 3.2% yoy in April.
• At the April monetary policy meeting, the NBU again reduced the key policy rate from 14.5% to 13.5% per annum.
• Over the past four weeks, the hryvnia exchange rate has stabilized in the UAH 39-40 per USD range.
how to sell pi coins at high rate quickly.DOT TECH
Where can I sell my pi coins at a high rate.
Pi is not launched yet on any exchange. But one can easily sell his or her pi coins to investors who want to hold pi till mainnet launch.
This means crypto whales want to hold pi. And you can get a good rate for selling pi to them. I will leave the telegram contact of my personal pi vendor below.
A vendor is someone who buys from a miner and resell it to a holder or crypto whale.
Here is the telegram contact of my vendor:
@Pi_vendor_247
Falcon stands out as a top-tier P2P Invoice Discounting platform in India, bridging esteemed blue-chip companies and eager investors. Our goal is to transform the investment landscape in India by establishing a comprehensive destination for borrowers and investors with diverse profiles and needs, all while minimizing risk. What sets Falcon apart is the elimination of intermediaries such as commercial banks and depository institutions, allowing investors to enjoy higher yields.
how can I sell my pi coins for cash in a pi APPDOT TECH
You can't sell your pi coins in the pi network app. because it is not listed yet on any exchange.
The only way you can sell is by trading your pi coins with an investor (a person looking forward to hold massive amounts of pi coins before mainnet launch) .
You don't need to meet the investor directly all the trades are done with a pi vendor/merchant (a person that buys the pi coins from miners and resell it to investors)
I Will leave The telegram contact of my personal pi vendor, if you are finding a legitimate one.
@Pi_vendor_247
#pi network
#pi coins
#money
US Economic Outlook - Being Decided - M Capital Group August 2021.pdfpchutichetpong
The U.S. economy is continuing its impressive recovery from the COVID-19 pandemic and not slowing down despite re-occurring bumps. The U.S. savings rate reached its highest ever recorded level at 34% in April 2020 and Americans seem ready to spend. The sectors that had been hurt the most by the pandemic specifically reduced consumer spending, like retail, leisure, hospitality, and travel, are now experiencing massive growth in revenue and job openings.
Could this growth lead to a “Roaring Twenties”? As quickly as the U.S. economy contracted, experiencing a 9.1% drop in economic output relative to the business cycle in Q2 2020, the largest in recorded history, it has rebounded beyond expectations. This surprising growth seems to be fueled by the U.S. government’s aggressive fiscal and monetary policies, and an increase in consumer spending as mobility restrictions are lifted. Unemployment rates between June 2020 and June 2021 decreased by 5.2%, while the demand for labor is increasing, coupled with increasing wages to incentivize Americans to rejoin the labor force. Schools and businesses are expected to fully reopen soon. In parallel, vaccination rates across the country and the world continue to rise, with full vaccination rates of 50% and 14.8% respectively.
However, it is not completely smooth sailing from here. According to M Capital Group, the main risks that threaten the continued growth of the U.S. economy are inflation, unsettled trade relations, and another wave of Covid-19 mutations that could shut down the world again. Have we learned from the past year of COVID-19 and adapted our economy accordingly?
“In order for the U.S. economy to continue growing, whether there is another wave or not, the U.S. needs to focus on diversifying supply chains, supporting business investment, and maintaining consumer spending,” says Grace Feeley, a research analyst at M Capital Group.
While the economic indicators are positive, the risks are coming closer to manifesting and threatening such growth. The new variants spreading throughout the world, Delta, Lambda, and Gamma, are vaccine-resistant and muddy the predictions made about the economy and health of the country. These variants bring back the feeling of uncertainty that has wreaked havoc not only on the stock market but the mindset of people around the world. MCG provides unique insight on how to mitigate these risks to possibly ensure a bright economic future.
2. INTRODUCTION
Industrialisation plays an important role in the
economic development of a country. According to
R. Nagraj in his article “Industrial growth”, Industry
contributes 27 % percent of India’s domestic output in
2001. It employed 17.5% of the workforce and 43% of
the renewable capital stock. Between 1951 and 2000,
industrial output grew at annual rate of 5.5%. Output
shifted from simple consumer goods to complicated
and sophisticated capital goods that are required by
modern industries.
3. PHASE PLAN COVERED
High growth phase (1951-66) Phase I 1st Plan (1951-56)
2nd Plan (1956-61)
3rd Plan (1961-66)
Low growth phase (1966-74)
Recovery phase (1974-80)
Phase II Three Annual Plan (1966-
69)
4th Plan (1969-74)
5th Plan (1974-79)
High growth phase (1980-90) Phase III 4th Plan (1969-74)
5th Plan (1974-79)
The Reform phase Phase IV Annual Plan (1992-97)
8th Plan (1992-97)
9th Plan (1997-2002)
10th Plan (2002-07)
11th Plan (2007-12)
4. • Phase I
1st Plan (1951-56)
o The aim of the plan was to have fuller
utilisation of existing capacity in producer
goods and consumer good industries.
o The plan with an outlay of just Rs.55 crore
for the industrial sector.
o It laid down an ambitious foundation for
establishment of basic industries such as
steel, machines, buildings, chemicals etc
5. 2nd Plan (1956-61)
o 2nd Plan was based on Mahalanobis Model
o The second plan envisaged expansion of
public sector in areas like iron steel, coal,
cement, non-ferrous metals, etc.
o Setting up of the three steel plants in the
public sector at Bhilai, Rourkela and
Durgapur.
o An outlay of Rs.938 crore was kept for the
industrial sector.
6. 3rd Plan (1961-66)
o 3rd plan was to hasten the process of
industrial and technological change.
o The basic strategy was the same as it was
in the second plan.
o The targets laid down for industrial sector
were realised only to the extent of 70%
o Indian steel was probably one of the
cheapest steel in the world.
7. • Phase II
4th Plan (1969-74)
o The three years plan holiday from 66-69
had a depressing effect on industrial
development.
o Good weather conditions in almost all
parts of the country could with a marked
improvement in wheat output raised food
grain productions to a new peak.
8. o The objectives of this plan were completing
the ongoing Projects and expanding the
capacities of levels needed for future
development.
o Industrial production during the 4rth plan
was increased by 4% per annum against
the target of 8 to 10% per annum.
9. 5th Plan (1974-79)
o The programme of industrial development
with an outlay of ₹9000 crore during the
fifth plan was so formulated as to achieve
the twin objectives of self-reliance and
growth with social justice.
o To achieve this objective, the plan gave
priority to the core sector industries,
export expansion and adequate supply of
mass consumption goods.
o The achieved growth rate in industrial
production during the plan was around
5.2%.
10. Reasons for the slow industrial growth, these were:-
-consecutive crop failures in 1965 and 1966
-border conflicts with neighbours
-freezing of US aid
-currency devaluation
11. • Phase Iii
6th Plan (1980-85)
o Export industrial products.
o Development of indigenous research and
optimum utilisation of existing capacity
o Dispersal of industries in backward area.
o The industrial and trade policy were
liberated substantially.
o The growth targeted up to 7% p.a. but the
actual was 5.5%
12. 7th Plan (1985-90)
o Adequate supply of wage goods.
o Full utilization of established industrial
units.
o Development of industries.
Reason for high growth rate
o Green revolution
o Shift in the barter terms
o Increase in the share of public sector.
o Improvement in infrastructure.
13. 8th Plan (1992-96)
o Expected growth rate - 7.5%
o Policy of Liberalization, Industrialization
and Globalization.
o Achieved growth rate - 8.1%.
Year Growth rate of Industrial
production
1992-1993 4.2%
1993-1994 6.8%
1994-1995 9.4%
1995-1996 12.3%
1996-1997 7.7%
Phase IV
14. 9th Plan (1997-2002)
o During 1997-1998 and 1998-1999, industrial
products registered a growth of 3.8%.
oCAUSES OF SLOWDOWN:-
High real interest rates.
Lower speculative demand for
automobiles and real estate.
Outdated technologies.
15. 10th Plan (2002-07)
oTARGETED GROWTH RATE - 10%
oIndustry Has to face much more
INTERNATIONAL COMPETITIONS.
oRole of public sector declined.
oIndustrial sector GROWTH RATE - :
2005-2006 - 8.2%
2006-2007 - 10.6%
Automobile components, pharmaceutical, special
chemicals, textiles have shown a marked increase in
global competitiveness.
17. •Rapid and inclusive growth.
•Emphasis on social sector.
•Empowerment through education and skill
development.
•Growth rate of industrial sector to 10%.
OIL SHOCK
18. Challenges faced by INDUSTRIAL SECTOR in 12th
plan
a) Cost effective.
b) Environment and Security concerns.
c) Need to facilitate growth of labour intensive
industries.
d) Large investment plan made for
infrastructure.
19. o Increasing role of public sector and technology
incentive industries.
o Mahalanobis strategy was based upon the
assumption that lack of capital goods industries
was the barrier to maximising long-term growth.
o To meet the employment objectives, protection
was given to domestic and local industries.
20. o Indian industry is pre-deominantly domestically
financed.
o Foreign capital is often tied in with the
technology import requirements for very large
operations. Since the 1990s, the role of foreign
capital has increased.
o Commercial banks meet most of the long-term
finance requirements of the industries.
o The stock market has played a limited role, that
too mainly financing very large companies.
21. The industrial labour market remains dualistic. That
is, there is existence of :
1. Organised Labour
(a) They are factory workers.
(b) They are protected by numerous labour
laws.
(c) Size of organised industrial labour
is decreasing due to decline in strength
of labour.
22. 2. Unorganised Labour
(a) They are part of growing urban unorganised
labour market.
(b)Due to excess supply of unskilled labour, there
is competitive
equilibrium of wages that is marginally higher
than that for those in rural areas, adjusted. For
cost differences.
(c) These workers have better access to education,
vocational training and healthcare.
23. 1. Classical Economic View
In a large agrarian economy, industrial growth is
explained by size and growth of agricultural
surplus and of exports. Since the trade ratios for
large economies are small, agricultural
productivity mainly determines industrial demand.
There is inadequate, public investment in irrigation
and power, which have resulted in low agricultural
productivity.
24. 2. Alternate Economic View
Industrial sector is small because of policy-induced
restrictions on output and investment, which have
cut off the foreign market for domestic players.
International trade and investment opportunity
have proved to be an effective transition
mechanism for increase in domestic demand and
technology.