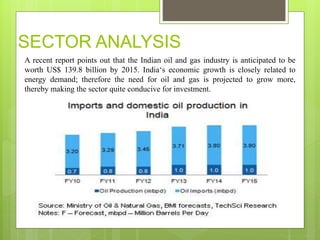
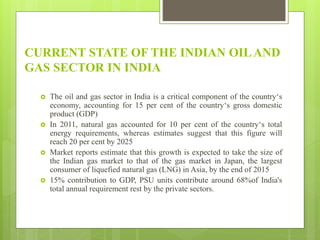
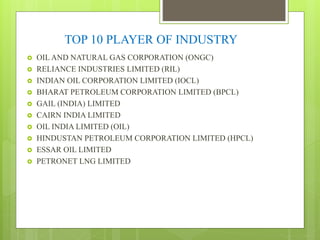
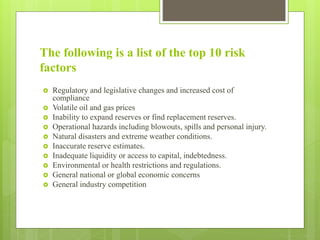
INDUSTRY
ANALYSIS
Topic: Oil and Gas Industry
Group – 10 MBA – 1
Anurag Roy Chowdhury
Aditya Kumar Das
Saheb Kumar
Lungthao thai pou
UNIT 1
SECTOR ANALYSIS
A recent report points out that the Indian oil and gas industry is anticipated to be
worth US$ 139.8 billion by 2015. India‘s economic growth is closely related to
energy demand; therefore the need for oil and gas is projected to grow more,
thereby making the sector quite conducive for investment.
CURRENT STATE OF THE INDIAN OILAND
GAS SECTOR IN INDIA
 The oil and gas sector in India is a critical component of the country‘s
economy, accounting for 15 per cent of the country‘s gross domestic
product (GDP)
 In 2011, natural gas accounted for 10 per cent of the country‘s total
energy requirements, whereas estimates suggest that this figure will
reach 20 per cent by 2025
 Market reports estimate that this growth is expected to take the size of
the Indian gas market to that of the gas market in Japan, the largest
consumer of liquefied natural gas (LNG) in Asia, by the end of 2015
 15% contribution to GDP, PSU units contribute around 68%of India's
total annual requirement rest by the private sectors.
TOP 10 PLAYER OF INDUSTRY
 OIL AND NATURAL GAS CORPORATION (ONGC)
 RELIANCE INDUSTRIES LIMITED (RIL)
 INDIAN OIL CORPORATION LIMITED (IOCL)
 BHARAT PETROLEUM CORPORATION LIMITED (BPCL)
 GAIL (INDIA) LIMITED
 CAIRN INDIA LIMITED
 OIL INDIA LIMITED (OIL)
 HINDUSTAN PETROLEUM CORPORATION LIMITED (HPCL)
 ESSAR OIL LIMITED
 PETRONET LNG LIMITED
Type Of Competition:-
 A competitive oligopoly is a market that is dominated by only a
few large firms. These firms prefer not to compete via price wars
and therefore compete in various other ways, such as advertising,
product differentiation and barriers.
Geographical spread of plants
 HPCL Visakhapatnam - 7.50
 Hindustan Petroleum Corporation Limited (HPCL) Mumbai - 5.50
 Chennai Petroleum Corporation Limited (CPCL) Tamilnadu - 9.50
 Bharat Petroleum Corporation Limited (BPCL) Mumbai - 6.90
 Kochi Refineries Ltd. (KRL) Kochi - 7.50
 CPCL Nagapattnam - 1.00
 Mangalore Refinery & Petrochemicals Ltd. (MRPL) Mangalore -
9.69
 Numaligarh Refinery Ltd. (NRL) Numaligarh - 3.00
 Reliance Petroleum Ltd. (RPL). Jamnagar (Private Sector) - 33.00
 Tatipaka Refinery (ONGC) Andhra Pradesh - 0.078
Demand for Petroleum Products
Various groups have estimated long-term demand projections for oil
for the country from time to time. Some of the main projections are
contained in:
 India Vision 2020,
 India Hydrocarbon Vision 2025
 Energy Information Administration (EIA) and
 International Energy Agency (IEA)
While the projections by IEA and EIA are based on lower GDP growth
rates and are in the range of 230 MMT to 264 MMT, India
Hydrocarbon Vision (IHV) 2025 projects the demand for the year 2025
in the range of 235 MMT to 368 MMT.
Approach Adopted to Estimate Future Demand
 The following two approaches have been considered for
assessing the oil requirements for future.
 Top-down Approach: Overall energy requirements with
share of various fuels in the primary commercial energy basket
(considered by Planning Commission and reported in IEP) by
linking GDP with energy elasticity.
 Bottom-up Approach: End use approach considering the
impact of various parameters. While assessing the
requirements factors like impact of gas, vehicle population
growth, improved fuel efficiency, technological improvements in
engine designs.
Demand for petroleum products
Professional trade bodies of oil and gas
industry in India
 ALGA PROCESSING LLC
We are an oil and gas processing consulting and equipment company.
Our main services and products are mainly used in oil and gas industry
such as separation, oil treating, etc. Many of the products we provide
are customized according to the project.
Website: www.algaprocessing.com
 Illinois Oil & Gas Associaation
The voice of the oil and gas producing industry for over 50 years for
Illinois
Website: www.ioga.com
UNIT 2
Chairman & Managing Director
of Top Three players
 Hindustan Petroleum Corporation Ltd
 India's third largest oil marketing company
 Mr. Mukesh Kumar Surana
 A Mechanical Engineer with Master‘s degree
in Financial Management
 Surana joined HPCL in the year 1982.
 Handled a wide range of responsibilities
including leadership positions in Refineries,
Corporate, Information Systems and upstream
business of HPCL.
Hindustan Oil
Exploration Company
Ltd
 P Elango
 Holds a Masters degree in Business Administration and
began his career with ONGC in 1985.
 One of the five finalist for Platts' first-ever Asia CEO
of the Year award 2013
 He was the Chief Executive Officer & Whole Time
Director of Cairn India Limited.
Chairman of Green Gas Ltd
 Shri M. Ravindran
 His focus is to help Green Gas in its endeavor of Growth and
Corporate Governance
 He was also working as Director (HR) of GAIL (India) Limited
since1st June, 2013
 He replaces K K Gupta, Director (Marketing), Bharat Petroleum
Corporation Ltd (BPCL)
 Child Care
 Education
 Health Care
 Skill Development
 Sports
 Environment & Community Development
CSR Policy of Hindustan Petroleum Ltd
Hindustan Oil Exploration Corporation Ltd
CSR Policy
 Promote local content by developing entrepreneurship
 Improve access to clean drinking water;
 Enhance the quality of education in our Operating Area;
 Promote personal safety, environmental and technology awareness
 Support promotion of local culture and sports
UNIT 3
Controlling body of the industry
Petroleum and Natural Gas
Sector
Central level State level
Energy
Directorates
DGH (Upstream)
Other Government
bodies
Regulators
Oil Industry development
Board
Central or High Technology
Oil Industry Safety Directorate
PNGRB
(Downstream)
Department of
commerce and
industry
Ministry of
Petroleum and
Natural Gas
Petroleum Conservation and
Research Association
Petroleum Planning
and Analysis Cell
The following is a list of the top 10 risk
factors
 Regulatory and legislative changes and increased cost of
compliance
 Volatile oil and gas prices
 Inability to expand reserves or find replacement reserves.
 Operational hazards including blowouts, spills and personal injury.
 Natural disasters and extreme weather conditions.
 Inaccurate reserve estimates.
 Inadequate liquidity or access to capital, indebtedness.
 Environmental or health restrictions and regulations.
 General national or global economic concerns
 General industry competition
Steps taken to Promote Oil and Gas Industry
 24 x 7 LPG service via web launched to provide LPG consumers an
integrated solution to carry out all services at one place, through
MyLPG.in, from the comfort of their home.
 Government of India entered into bilateral discussion with Norway
to extend co-operation between the two countries in the field of oil
and natural gas and hydrocarbon exploration.
 oil diplomacy initiatives have been intensified through meaningful
engagements with hydrocarbon rich countries
Environmental issues due in Oil and Gas
industry
 Machinery, gas flares and light pollution disrupt scenic views and
clear night skies
 Dangerous methane emissions contribute to climate change
UNIT 4
0
5
10
15
20
25
30
Current Ratio Quick Ratio Debt Equity
Ratio
Stock Turnover
Ratio
Debtors
Turnover Ratio
EPS Ratios P.E Ratios
1.57
1.26
0.01
14.03
7.64
20.73
14.8
1.56
1.26
0
14.53
11.21
25.83
12.34
1.74
1.41
0
15.33
12.76
24.46
12.74
2015
2014
2013
0
10
20
30
40
50
60
70
80
90
Current Ratio Quick Ratio Debt Equity
Ratio
Stock Turnover
Ratio
Debtors
Turnover Ratio
EPS Ratios P.E Ratios
4
3.95
0
44.78
7.37
7.04
30.37
4.92
4.87
0
73.46
7.44
39.08
8.52
4.85
4.81
0
85.96
15.73
77.2
3.53
2015
2014
2013
0
5
10
15
20
25
Current Ratio Quick Ratio Debt Equity
Ratio
Stock Turnover
Ratio
Debtors
Turnover Ratio
EPS Ratios P.E Ratios
1.87
1.25
0.47
11.77
23.52
11.77
14.57
1.26
0.98
0.66
9.49
20.37
9.49
14.43
1.18
0.88
0.68
15.32
21.15
15.32
8.84
2015
2014
2013
0
5
10
15
20
25
30
35
Current Ratio Quick Ratio Debt Equity
Ratio
Stock Turnover
Ratio
Debtors
Turnover Ratio
EPS Ratios P.E Ratios
1.06
0.85
0.33
23.96
19.46
23.96
16.23
1.17
0.93
0.38
34.49
21.73
34.49
10.89
1.01
0.84
0.37
31.71
21.63
31.71
10.07
2015
2014
2013
0
10
20
30
40
50
60
70
80
90
Current Ratio Quick Ratio Debt Equity
Ratio
Stock Turnover
Ratio
Debtors
Turnover Ratio
EPS Ratios P.E Ratios
4
3.95
0
44.78
7.37
7.04
30.37
4.92
4.87
0
73.46
7.44
39.08
8.52
4.85
4.81
0
85.96
15.73
77.2
3.53
2015
2014
2013
0
5
10
15
20
25
Current Ratio Quick Ratio Debt Equity
Ratio
Stock Turnover
Ratio
Debtors
Turnover Ratio
EPS Ratios P.E Ratios
1.87
1.25
0.47
11.77
23.52
11.77
14.57
1.26
0.98
0.66
9.49
20.37
9.49
14.43
1.18
0.88
0.68
15.32
21.15
15.32
8.84
2015
2014
2013
0
5
10
15
20
25
Current Ratio Quick Ratio Debt Equity
Ratio
Stock Turnover
Ratio
Debtors
Turnover Ratio
EPS Ratios P.E Ratios
1.87
1.25
0.47
11.77
23.52
11.77
14.57
1.26
0.98
0.66
9.49
20.37
9.49
14.43
1.18
0.88
0.68
15.32
21.15
15.32
8.84
2015
2014
2013
0
5
10
15
20
25
Current Ratio Quick Ratio Debt Equity
Ratio
Stock Turnover
Ratio
Debtors
Turnover Ratio
EPS Ratios P.E Ratios
1.87
1.25
0.47
11.77
23.52
11.77
14.57
1.26
0.98
0.66
9.49
20.37
9.49
14.43
1.18
0.88
0.68
15.32
21.15
15.32
8.84
2015
2014
2013
The biggest mistake that oil and gas companies can make in this difficult
business landscape is to focus solely on reducing costs (either operating or
general and administrative) and spending; this strategy is effective only in a
very narrow range of market conditions and rarely effective enough to make
businesses successful over the long term. Rather, companies should carefully
consider the supply of assets, analyze the logistics of accessing available
markets, and ensure a long-term presence in these markets without getting into
a bidding war. Oversupply and lower prices represent a real challenge to the
industry, but that doesn’t mean the future is all gloom. It just means that
producers and refiners need to be prepared and adopt strategies that take
advantage of the new reality.
Conclusion
INDUSTRY ppt

INDUSTRY ppt

  • 1.
    INDUSTRY ANALYSIS Topic: Oil andGas Industry Group – 10 MBA – 1 Anurag Roy Chowdhury Aditya Kumar Das Saheb Kumar Lungthao thai pou
  • 2.
  • 3.
    SECTOR ANALYSIS A recentreport points out that the Indian oil and gas industry is anticipated to be worth US$ 139.8 billion by 2015. India‘s economic growth is closely related to energy demand; therefore the need for oil and gas is projected to grow more, thereby making the sector quite conducive for investment.
  • 4.
    CURRENT STATE OFTHE INDIAN OILAND GAS SECTOR IN INDIA  The oil and gas sector in India is a critical component of the country‘s economy, accounting for 15 per cent of the country‘s gross domestic product (GDP)  In 2011, natural gas accounted for 10 per cent of the country‘s total energy requirements, whereas estimates suggest that this figure will reach 20 per cent by 2025  Market reports estimate that this growth is expected to take the size of the Indian gas market to that of the gas market in Japan, the largest consumer of liquefied natural gas (LNG) in Asia, by the end of 2015  15% contribution to GDP, PSU units contribute around 68%of India's total annual requirement rest by the private sectors.
  • 5.
    TOP 10 PLAYEROF INDUSTRY  OIL AND NATURAL GAS CORPORATION (ONGC)  RELIANCE INDUSTRIES LIMITED (RIL)  INDIAN OIL CORPORATION LIMITED (IOCL)  BHARAT PETROLEUM CORPORATION LIMITED (BPCL)  GAIL (INDIA) LIMITED  CAIRN INDIA LIMITED  OIL INDIA LIMITED (OIL)  HINDUSTAN PETROLEUM CORPORATION LIMITED (HPCL)  ESSAR OIL LIMITED  PETRONET LNG LIMITED
  • 6.
    Type Of Competition:- A competitive oligopoly is a market that is dominated by only a few large firms. These firms prefer not to compete via price wars and therefore compete in various other ways, such as advertising, product differentiation and barriers.
  • 7.
    Geographical spread ofplants  HPCL Visakhapatnam - 7.50  Hindustan Petroleum Corporation Limited (HPCL) Mumbai - 5.50  Chennai Petroleum Corporation Limited (CPCL) Tamilnadu - 9.50  Bharat Petroleum Corporation Limited (BPCL) Mumbai - 6.90  Kochi Refineries Ltd. (KRL) Kochi - 7.50  CPCL Nagapattnam - 1.00  Mangalore Refinery & Petrochemicals Ltd. (MRPL) Mangalore - 9.69  Numaligarh Refinery Ltd. (NRL) Numaligarh - 3.00  Reliance Petroleum Ltd. (RPL). Jamnagar (Private Sector) - 33.00  Tatipaka Refinery (ONGC) Andhra Pradesh - 0.078
  • 8.
    Demand for PetroleumProducts Various groups have estimated long-term demand projections for oil for the country from time to time. Some of the main projections are contained in:  India Vision 2020,  India Hydrocarbon Vision 2025  Energy Information Administration (EIA) and  International Energy Agency (IEA) While the projections by IEA and EIA are based on lower GDP growth rates and are in the range of 230 MMT to 264 MMT, India Hydrocarbon Vision (IHV) 2025 projects the demand for the year 2025 in the range of 235 MMT to 368 MMT.
  • 9.
    Approach Adopted toEstimate Future Demand  The following two approaches have been considered for assessing the oil requirements for future.  Top-down Approach: Overall energy requirements with share of various fuels in the primary commercial energy basket (considered by Planning Commission and reported in IEP) by linking GDP with energy elasticity.  Bottom-up Approach: End use approach considering the impact of various parameters. While assessing the requirements factors like impact of gas, vehicle population growth, improved fuel efficiency, technological improvements in engine designs.
  • 10.
  • 11.
    Professional trade bodiesof oil and gas industry in India  ALGA PROCESSING LLC We are an oil and gas processing consulting and equipment company. Our main services and products are mainly used in oil and gas industry such as separation, oil treating, etc. Many of the products we provide are customized according to the project. Website: www.algaprocessing.com  Illinois Oil & Gas Associaation The voice of the oil and gas producing industry for over 50 years for Illinois Website: www.ioga.com
  • 12.
  • 13.
    Chairman & ManagingDirector of Top Three players  Hindustan Petroleum Corporation Ltd  India's third largest oil marketing company  Mr. Mukesh Kumar Surana  A Mechanical Engineer with Master‘s degree in Financial Management  Surana joined HPCL in the year 1982.  Handled a wide range of responsibilities including leadership positions in Refineries, Corporate, Information Systems and upstream business of HPCL.
  • 14.
    Hindustan Oil Exploration Company Ltd P Elango  Holds a Masters degree in Business Administration and began his career with ONGC in 1985.  One of the five finalist for Platts' first-ever Asia CEO of the Year award 2013  He was the Chief Executive Officer & Whole Time Director of Cairn India Limited.
  • 15.
    Chairman of GreenGas Ltd  Shri M. Ravindran  His focus is to help Green Gas in its endeavor of Growth and Corporate Governance  He was also working as Director (HR) of GAIL (India) Limited since1st June, 2013  He replaces K K Gupta, Director (Marketing), Bharat Petroleum Corporation Ltd (BPCL)
  • 16.
     Child Care Education  Health Care  Skill Development  Sports  Environment & Community Development CSR Policy of Hindustan Petroleum Ltd
  • 17.
    Hindustan Oil ExplorationCorporation Ltd CSR Policy  Promote local content by developing entrepreneurship  Improve access to clean drinking water;  Enhance the quality of education in our Operating Area;  Promote personal safety, environmental and technology awareness  Support promotion of local culture and sports
  • 18.
  • 19.
    Controlling body ofthe industry Petroleum and Natural Gas Sector Central level State level Energy Directorates DGH (Upstream) Other Government bodies Regulators Oil Industry development Board Central or High Technology Oil Industry Safety Directorate PNGRB (Downstream) Department of commerce and industry Ministry of Petroleum and Natural Gas Petroleum Conservation and Research Association Petroleum Planning and Analysis Cell
  • 20.
    The following isa list of the top 10 risk factors  Regulatory and legislative changes and increased cost of compliance  Volatile oil and gas prices  Inability to expand reserves or find replacement reserves.  Operational hazards including blowouts, spills and personal injury.  Natural disasters and extreme weather conditions.  Inaccurate reserve estimates.  Inadequate liquidity or access to capital, indebtedness.  Environmental or health restrictions and regulations.  General national or global economic concerns  General industry competition
  • 21.
    Steps taken toPromote Oil and Gas Industry  24 x 7 LPG service via web launched to provide LPG consumers an integrated solution to carry out all services at one place, through MyLPG.in, from the comfort of their home.  Government of India entered into bilateral discussion with Norway to extend co-operation between the two countries in the field of oil and natural gas and hydrocarbon exploration.  oil diplomacy initiatives have been intensified through meaningful engagements with hydrocarbon rich countries
  • 22.
    Environmental issues duein Oil and Gas industry  Machinery, gas flares and light pollution disrupt scenic views and clear night skies  Dangerous methane emissions contribute to climate change
  • 23.
  • 25.
    0 5 10 15 20 25 30 Current Ratio QuickRatio Debt Equity Ratio Stock Turnover Ratio Debtors Turnover Ratio EPS Ratios P.E Ratios 1.57 1.26 0.01 14.03 7.64 20.73 14.8 1.56 1.26 0 14.53 11.21 25.83 12.34 1.74 1.41 0 15.33 12.76 24.46 12.74 2015 2014 2013
  • 26.
    0 10 20 30 40 50 60 70 80 90 Current Ratio QuickRatio Debt Equity Ratio Stock Turnover Ratio Debtors Turnover Ratio EPS Ratios P.E Ratios 4 3.95 0 44.78 7.37 7.04 30.37 4.92 4.87 0 73.46 7.44 39.08 8.52 4.85 4.81 0 85.96 15.73 77.2 3.53 2015 2014 2013
  • 27.
    0 5 10 15 20 25 Current Ratio QuickRatio Debt Equity Ratio Stock Turnover Ratio Debtors Turnover Ratio EPS Ratios P.E Ratios 1.87 1.25 0.47 11.77 23.52 11.77 14.57 1.26 0.98 0.66 9.49 20.37 9.49 14.43 1.18 0.88 0.68 15.32 21.15 15.32 8.84 2015 2014 2013
  • 28.
    0 5 10 15 20 25 30 35 Current Ratio QuickRatio Debt Equity Ratio Stock Turnover Ratio Debtors Turnover Ratio EPS Ratios P.E Ratios 1.06 0.85 0.33 23.96 19.46 23.96 16.23 1.17 0.93 0.38 34.49 21.73 34.49 10.89 1.01 0.84 0.37 31.71 21.63 31.71 10.07 2015 2014 2013
  • 29.
    0 10 20 30 40 50 60 70 80 90 Current Ratio QuickRatio Debt Equity Ratio Stock Turnover Ratio Debtors Turnover Ratio EPS Ratios P.E Ratios 4 3.95 0 44.78 7.37 7.04 30.37 4.92 4.87 0 73.46 7.44 39.08 8.52 4.85 4.81 0 85.96 15.73 77.2 3.53 2015 2014 2013
  • 30.
    0 5 10 15 20 25 Current Ratio QuickRatio Debt Equity Ratio Stock Turnover Ratio Debtors Turnover Ratio EPS Ratios P.E Ratios 1.87 1.25 0.47 11.77 23.52 11.77 14.57 1.26 0.98 0.66 9.49 20.37 9.49 14.43 1.18 0.88 0.68 15.32 21.15 15.32 8.84 2015 2014 2013
  • 31.
    0 5 10 15 20 25 Current Ratio QuickRatio Debt Equity Ratio Stock Turnover Ratio Debtors Turnover Ratio EPS Ratios P.E Ratios 1.87 1.25 0.47 11.77 23.52 11.77 14.57 1.26 0.98 0.66 9.49 20.37 9.49 14.43 1.18 0.88 0.68 15.32 21.15 15.32 8.84 2015 2014 2013
  • 32.
    0 5 10 15 20 25 Current Ratio QuickRatio Debt Equity Ratio Stock Turnover Ratio Debtors Turnover Ratio EPS Ratios P.E Ratios 1.87 1.25 0.47 11.77 23.52 11.77 14.57 1.26 0.98 0.66 9.49 20.37 9.49 14.43 1.18 0.88 0.68 15.32 21.15 15.32 8.84 2015 2014 2013
  • 33.
    The biggest mistakethat oil and gas companies can make in this difficult business landscape is to focus solely on reducing costs (either operating or general and administrative) and spending; this strategy is effective only in a very narrow range of market conditions and rarely effective enough to make businesses successful over the long term. Rather, companies should carefully consider the supply of assets, analyze the logistics of accessing available markets, and ensure a long-term presence in these markets without getting into a bidding war. Oversupply and lower prices represent a real challenge to the industry, but that doesn’t mean the future is all gloom. It just means that producers and refiners need to be prepared and adopt strategies that take advantage of the new reality. Conclusion