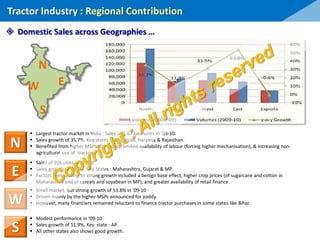
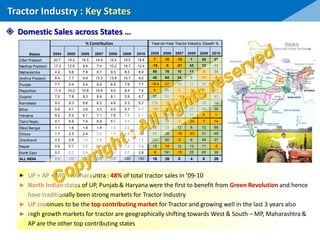
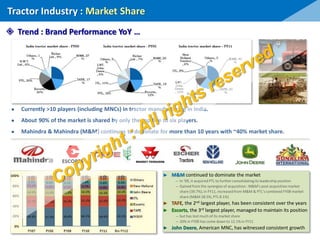
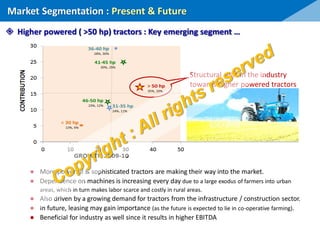
Indian Tractor Market
Market Perspective & Analysis
SMP – 08
IIM Calcutta
Group Assignment
Report
by
Marketing Nuggets by Prof. Majumdar
Vivek Singhal
& Team
16-June-2012 | Nehru Place | Delhi
 Introduction
 Tractor Industry
― Sales Volumes
― Regional contributions
― Key States
― Market Share
 Market Segmentation
― Trend analysis : 2000~11
― Present & Future
 Consumer buying : Behavior analysis
 Leading Brands
― Positioning strategy
― Ad’s & Promotions
 Marketing Strategies
CONTENTS
● Agriculture accounts for approximately 18% of India's GDP.
● Means of livelihood of almost 2/3rd of workforce & employs nearly 62% of
population.
● Accounts for 10% of India’s exports.
● About 42% of geographical area is used for agricultural activity.
….. Hence, considered to be the vital sector of the Indian economy.
Introduction
 Agriculture Growth : Market evolution in India …
• Stagnation in Indian Agriculture
• Few improvementsin seeds,
fertilizers, machinery
• Crop growth rate 0.4%/yr
• Food grains growth : 0.1%/yr
• Land reforms – abolishment of
Zamindar System
• Agri sector had 70% of country
employment, 50% contrib’n to GNP
• Central Govt. providing financing
for agri. programs
• Green revolution
• Self sufficiencyin food grain
production
• Adequate buffer stocks
• Better seeds, improved irrigation
system, use of better quality /
quantity of the fertilizers
• Expanding cereal production
• Generatingsurplus of agricultural
commodity for exports
• Emphasis on dry land farming
• Entry of MNC players in Indian
market, bringing better technology
• Easy availabilityof financing
schemes
1881-1946… 1947-1968… 1969-1990… 1991-now…
● Better Government policies & New technology for farm mechanization : key drivers for growth
● Farm Mechanization = Higher productivity & Greater output
● Tractors form an integral part of farm mechanization & is a highly versatile machinery
● Major usage of Tractors :
―Agriculture : Land reclamation & carrying out various crop cultivation / production operations
―Mode of transport / Electricity generation / Construction industry / Haulage operation
 India : An agricultural country …
● Fast Growth : 50,000 units in early 80’s to 600,000 at present
● Accounts for 1/3rd of global production. Other major tractor markets – China & USA
● Volume growth in the past four decades shows CAGR of 10%, despite
seasonal variations that cause changes in tractor demand and subsequently
impacting industry volumes.
● Increased use of tractors for haulage and non-agricultural applications.
● The opportunities are still huge considering the low farm mechanization
levels in the country, when compared to other.
● Expected to continue from a moderate CAGR rate of 5% to 7% in the long term
largely due to continued thrust government to increase agricultural GDP
● Expected the domestic industry to stabilize at about 500,000 tractors per year
and exports to reach in excess of 75,000 tractors per year by 2012.
● Evolution of industry will continue positioning of tractor as complete solution
to farmer with enhanced performance & advance features (AC cabin, Turbo, etc)
 Indian tractor industry : Largest in the world …
 Industry Growth : Continue in future …
Introduction
► Indian tractors : Cheapest in world… By some
estimates, cost of a tractor produced in India is as much
as cost of its gear box in a developed country.
► Exports improving Year-on-Year (exc ‘10)
─ ~2,700 units in ’00  ~60,000 in ’11
─ In ‘11, exports growth of 68% YoY.
► Exports : ~11% of total tractor sales
► Mainly exports to : USA, Nepal, Bangladesh & Sri
Lanka.
► Cyclic trend
► High growth followed by decline – due to high
dependence on nature and Govt. policies
► Market size : consistently improving Year-on-Year
─ more than doubled in ‘10 compared to ’04
─ close to three fold in ’11 compared to ’04
► Growth @ CAGR of 12.8% in last five years
Tractor Industry : Sales Volumes
 Yearly Sales Volumes …
 Trend : Domestic + Export … Growth momentum continues
 Trend : Export … increase with addition of new destination  tremendous scope
 Largest tractor market in India : Sales of 1.67 lakh units in ‘09-10.
 Sales growth of 35.7%. Key states : UP, Punjab, Haryana & Rajasthan.
 Benefited from higher MSPs (for crops), limited availability of labour (forcing higher mechanisation), & increasing non-
agricultural use of tractors.
 Small market, but strong growth of 53.8% in ‘09-10
 Driven mainly by the higher MSPs announced for paddy.
 However, many financiers remained reluctant to finance tractor purchases in some states like Bihar.
 Sales of 92k units in ‘09-10
 Sales growth of 35.7%. Key States : Maharashtra, Gujarat & MP.
 Factors contributing to strong growth included a benign base effect, higher crop prices (of sugarcane and cotton in
Maharashtra and of cereals and soyabean in MP), and greater availability of retail finance
 Modest performance in ‘09-10
 Sales growth of 11.9%. Key state : AP.
 All other states also shows good growth.
Tractor Industry : Regional Contribution
 Domestic Sales across Geographies …
N
W E
S
N
S
W
E
► UP + AP + MP + Maharashtra : 48% of total tractor sales in ‘09-10
► North Indian states of UP, Punjab & Haryana were the first to benefit from Green Revolution and hence
have traditionally been strong markets for Tractor Industry
► UP continues to be the top contributing market for Tractor and growing well in the last 3 years also
► High growth markets for tractor are geographically shifting towards West & South – MP, Maharashtra &
AP are the other top contributing states
2004 2005 2006 2007 2008 2009 2010
Uttar Pradesh 20.7 19.2 16.5 14.9 15.4 18.5 18.8
Madhya Pradesh 17.3 12.6 9.4 7.4 10.2 10.7 12.4
Maharashtra 4.2 5.6 7.8 8.7 9.3 8.3 8.9
Andhra Pradesh 6.4 7.7 9.9 13.3 13.8 10.7 8.0
Punjab 7.7 5.4 5.4 6.4 6.9 7.6 7.7
Rajasthan 11.4 10.2 10.8 10.8 9.0 8.4 7.4
Gujarat 7.0 7.8 9.3 8.9 8.1 5.9 6.7
Karnataka 5.0 9.3 8.6 6.2 4.8 5.3 6.2
Bihar 5.6 4.1 2.6 3.3 4.0 5.7 6.1
Haryana 6.2 5.2 6.1 7.1 7.6 7.6 6.1
Tamil Nadu 4.1 6.9 7.4 6.9 5.0 4.4 4.0
West Bengal 1.1 1.6 1.6 1.8 1.9 2.0 2.6
Orissa 1.7 2.5 2.4 2.0 1.5 1.9 2.2
Jharkhand 0.3 0.8 1.0 0.9 1.0 1.4 1.5
Nepal 0.9 0.9 0.8 0.9 1.0 1.0 0.8
North East 0.2 0.2 0.4 0.4 0.5 0.7 0.8
ALL INDIA 100 100 100 100 100 100 100
% Contribution
States 2005 2006 2007 2008 2009 2010
Uttar Pradesh 18.8 7 10 -10 7 28 27
MP 12.4 -15 -5 -21 43 12 45
Maharashtra 8.9 56 78 10 11 -5 35
Andhra Pradesh 8.0 40 64 34 8 -17 -6
Punjab 7.7 -18.4 27 19 11 18 27
Rajasthan 7.4 4 36 0 -14 0 11
Gujarat 6.7 30 53 -5 -6 -23 43
Karnataka 6.2 116 19 -29 -19 16 48
Bihar 6.1 -16 -20 29 27 49 35
Haryana 6.1 -2 50 16 11 5 1
Tamil Nadu 4.0 95 38 -7 -24 -7 14
West Bengal 2.6 65 33 12 6 12 66
Orissa 2.2 66 26 -16 -23 31 49
Jharkhand 1.5 201 60 -5 8 49 37
Nepal 0.8 16 14 12 13 11 -5
North-East 0.8 -6 191 -15 25 60 38
ALL INDIA 16 28 0 4 6 26
Year-on-Year Tractor Industry Growth %
Contribution
(2010)States
Tractor Industry : Key States
 Domestic Sales across States …
● Currently >10 players (including MNCs) in tractor manufacturing in India.
● About 90% of the market is shared by only the top five to six players.
● Mahindra & Mahindra (M&M) continues to dominate for more than 10 years with ~40% market share.
Tractor Industry : Market Share
 Trend : Brand Performance YoY …
► M&M continued to dominate the market
― In ‘09, it acquired PTL to further consolidatingits leadership position
― Gained from the synergies of acquisition: M&M’s post acquisition market
share (39.7%),in FY11, increased from M&M & PTL’s combined FY08 market
share (M&M 28.5%, PTL 8.1%)
► TAFE, the 2nd largest player, has been consistent over the years
► Escorts, the 3rd largest player, managed to maintain its position
― but has lost much of its market share
― 20% in FY00 has come down to 12.1% in FY11
► John Deere, American MNC, has witnessed consistent growth
Market Segmentation : Trend analysis
 Sales Trend : Segment-wise movement …
► Broadly classified into 5 segments
(of Horsepower)
─ less than 20 hp
─ 21 to 30 hp
─ 31 to 40 hp
─ 41 to 50 hp
─ more than 50 hp
► Mid segment (31-50 hp) : 70%
► 40+ hp growing fast 29%44% in 5 yr
<20 hp
20-30 hp
31-40 hp
41-50 hp
>51 hp
Consistent decline
221913% (2001, 05, 11)
Gradual decline
555142% (2001, 05, 11)
Steady Growth
152128% (2001, 05, 11)
High Growth
4816% (2001, 05, 11)
Combined share of >40 hp
more than doubled in 10 yr
<20 hp : within 1% (2001-11)
 Sales Trend : Changes in Market Share …
● More powerful & sophisticated tractors are making their way into the market.
● Dependence on machines is increasing every day due to a large exodus of farmers into urban
areas, which in turn makes labor scarce and costly in rural areas.
● Also driven by a growing demand for tractors from the infrastructure / construction sector.
● In future, leasing may gain importance (as the future is expected to lie in co-operative farming).
● Beneficial for industry as well since it results in higher EBITDA
Market Segmentation : Present & Future
 Higher powered ( >50 hp) tractors : Key emerging segment …
Structural shift in the industry
towards higher powered tractors
Consumer Buying : Behavior analysis
 Tractor penetration …
in Indian Farm Household
 Changing expectations …
 Selection of Tractor size : Trade-off between Utility & Price …
● A farmer’s choice of tractor size is typically a trade-off between utility of the
tractor (includes haulage capacity requirement) and its price.
● Despite higher prices, several factors have led to a structural shift in industry
towards higher powered tractors :
― Market expansion … high power required in paddy fields in South
― Scarcity of farm labor … urban migration, NAREGA
― Increasing non-agri application … haulage in infra & construction
― Strong replacement demand … 40% (avg. life cycle reduced to 8 yr  11 yr)
― Govt. initiative … easy credit availability, intention of contract farming
― Cheaper manufacturing … growth in export
++
Low Demand, Low Power,
Basic need of agri
1960’s ~ 80’s 1990’s ~ 2000’s
Powerful tractor with more features,
Purchasing power, Retail finance
●Complete solution to farmer
●Enhanced performance
●Multi purpose tractor
●Advance features & Service/support
2010’s ~
vs
Leading Brands : Positioning Strategy
Mass Market Leader
Complete solution
Leader in High hp segment
Technology makes life easy
Ex-leader in High hp segment
Good output, yet fuel efficient
New in High hp segment
Value for money
Multi Utility
Big Executive
Smart
Value
Multi Utility
Big Executive
Smart
Value
Leading Brands : Ad’s & Promotions
 Continuous communication on product being
Big  Powerful  Complete solution
Marketing Strategy : by Leading Brands
 Customers are targeted to be
Smart & Intelligent
 High level of Campaigns :
Unique offers  Easy finance
 Free offers
 Corporate Ads
 Emphasis on being No.1
(either in country by Mahindra
or in regions by others)
 Focus of Service support : 24x7 call, Web, Van
 Easy Finance
 Campaigns by Mobile Van
Indian Tractor Market
Strategic Perspective & Analysis
Thanks …!
SMP – 08
IIM Calcutta
Group Assignment Report

Indian Tractor Market : Perspective & Analysis

  • 1.
    Indian Tractor Market MarketPerspective & Analysis SMP – 08 IIM Calcutta Group Assignment Report by Marketing Nuggets by Prof. Majumdar Vivek Singhal & Team 16-June-2012 | Nehru Place | Delhi
  • 2.
     Introduction  TractorIndustry ― Sales Volumes ― Regional contributions ― Key States ― Market Share  Market Segmentation ― Trend analysis : 2000~11 ― Present & Future  Consumer buying : Behavior analysis  Leading Brands ― Positioning strategy ― Ad’s & Promotions  Marketing Strategies CONTENTS
  • 3.
    ● Agriculture accountsfor approximately 18% of India's GDP. ● Means of livelihood of almost 2/3rd of workforce & employs nearly 62% of population. ● Accounts for 10% of India’s exports. ● About 42% of geographical area is used for agricultural activity. ….. Hence, considered to be the vital sector of the Indian economy. Introduction  Agriculture Growth : Market evolution in India … • Stagnation in Indian Agriculture • Few improvementsin seeds, fertilizers, machinery • Crop growth rate 0.4%/yr • Food grains growth : 0.1%/yr • Land reforms – abolishment of Zamindar System • Agri sector had 70% of country employment, 50% contrib’n to GNP • Central Govt. providing financing for agri. programs • Green revolution • Self sufficiencyin food grain production • Adequate buffer stocks • Better seeds, improved irrigation system, use of better quality / quantity of the fertilizers • Expanding cereal production • Generatingsurplus of agricultural commodity for exports • Emphasis on dry land farming • Entry of MNC players in Indian market, bringing better technology • Easy availabilityof financing schemes 1881-1946… 1947-1968… 1969-1990… 1991-now… ● Better Government policies & New technology for farm mechanization : key drivers for growth ● Farm Mechanization = Higher productivity & Greater output ● Tractors form an integral part of farm mechanization & is a highly versatile machinery ● Major usage of Tractors : ―Agriculture : Land reclamation & carrying out various crop cultivation / production operations ―Mode of transport / Electricity generation / Construction industry / Haulage operation  India : An agricultural country …
  • 4.
    ● Fast Growth: 50,000 units in early 80’s to 600,000 at present ● Accounts for 1/3rd of global production. Other major tractor markets – China & USA ● Volume growth in the past four decades shows CAGR of 10%, despite seasonal variations that cause changes in tractor demand and subsequently impacting industry volumes. ● Increased use of tractors for haulage and non-agricultural applications. ● The opportunities are still huge considering the low farm mechanization levels in the country, when compared to other. ● Expected to continue from a moderate CAGR rate of 5% to 7% in the long term largely due to continued thrust government to increase agricultural GDP ● Expected the domestic industry to stabilize at about 500,000 tractors per year and exports to reach in excess of 75,000 tractors per year by 2012. ● Evolution of industry will continue positioning of tractor as complete solution to farmer with enhanced performance & advance features (AC cabin, Turbo, etc)  Indian tractor industry : Largest in the world …  Industry Growth : Continue in future … Introduction
  • 5.
    ► Indian tractors: Cheapest in world… By some estimates, cost of a tractor produced in India is as much as cost of its gear box in a developed country. ► Exports improving Year-on-Year (exc ‘10) ─ ~2,700 units in ’00  ~60,000 in ’11 ─ In ‘11, exports growth of 68% YoY. ► Exports : ~11% of total tractor sales ► Mainly exports to : USA, Nepal, Bangladesh & Sri Lanka. ► Cyclic trend ► High growth followed by decline – due to high dependence on nature and Govt. policies ► Market size : consistently improving Year-on-Year ─ more than doubled in ‘10 compared to ’04 ─ close to three fold in ’11 compared to ’04 ► Growth @ CAGR of 12.8% in last five years Tractor Industry : Sales Volumes  Yearly Sales Volumes …  Trend : Domestic + Export … Growth momentum continues  Trend : Export … increase with addition of new destination  tremendous scope
  • 6.
     Largest tractormarket in India : Sales of 1.67 lakh units in ‘09-10.  Sales growth of 35.7%. Key states : UP, Punjab, Haryana & Rajasthan.  Benefited from higher MSPs (for crops), limited availability of labour (forcing higher mechanisation), & increasing non- agricultural use of tractors.  Small market, but strong growth of 53.8% in ‘09-10  Driven mainly by the higher MSPs announced for paddy.  However, many financiers remained reluctant to finance tractor purchases in some states like Bihar.  Sales of 92k units in ‘09-10  Sales growth of 35.7%. Key States : Maharashtra, Gujarat & MP.  Factors contributing to strong growth included a benign base effect, higher crop prices (of sugarcane and cotton in Maharashtra and of cereals and soyabean in MP), and greater availability of retail finance  Modest performance in ‘09-10  Sales growth of 11.9%. Key state : AP.  All other states also shows good growth. Tractor Industry : Regional Contribution  Domestic Sales across Geographies … N W E S N S W E
  • 7.
    ► UP +AP + MP + Maharashtra : 48% of total tractor sales in ‘09-10 ► North Indian states of UP, Punjab & Haryana were the first to benefit from Green Revolution and hence have traditionally been strong markets for Tractor Industry ► UP continues to be the top contributing market for Tractor and growing well in the last 3 years also ► High growth markets for tractor are geographically shifting towards West & South – MP, Maharashtra & AP are the other top contributing states 2004 2005 2006 2007 2008 2009 2010 Uttar Pradesh 20.7 19.2 16.5 14.9 15.4 18.5 18.8 Madhya Pradesh 17.3 12.6 9.4 7.4 10.2 10.7 12.4 Maharashtra 4.2 5.6 7.8 8.7 9.3 8.3 8.9 Andhra Pradesh 6.4 7.7 9.9 13.3 13.8 10.7 8.0 Punjab 7.7 5.4 5.4 6.4 6.9 7.6 7.7 Rajasthan 11.4 10.2 10.8 10.8 9.0 8.4 7.4 Gujarat 7.0 7.8 9.3 8.9 8.1 5.9 6.7 Karnataka 5.0 9.3 8.6 6.2 4.8 5.3 6.2 Bihar 5.6 4.1 2.6 3.3 4.0 5.7 6.1 Haryana 6.2 5.2 6.1 7.1 7.6 7.6 6.1 Tamil Nadu 4.1 6.9 7.4 6.9 5.0 4.4 4.0 West Bengal 1.1 1.6 1.6 1.8 1.9 2.0 2.6 Orissa 1.7 2.5 2.4 2.0 1.5 1.9 2.2 Jharkhand 0.3 0.8 1.0 0.9 1.0 1.4 1.5 Nepal 0.9 0.9 0.8 0.9 1.0 1.0 0.8 North East 0.2 0.2 0.4 0.4 0.5 0.7 0.8 ALL INDIA 100 100 100 100 100 100 100 % Contribution States 2005 2006 2007 2008 2009 2010 Uttar Pradesh 18.8 7 10 -10 7 28 27 MP 12.4 -15 -5 -21 43 12 45 Maharashtra 8.9 56 78 10 11 -5 35 Andhra Pradesh 8.0 40 64 34 8 -17 -6 Punjab 7.7 -18.4 27 19 11 18 27 Rajasthan 7.4 4 36 0 -14 0 11 Gujarat 6.7 30 53 -5 -6 -23 43 Karnataka 6.2 116 19 -29 -19 16 48 Bihar 6.1 -16 -20 29 27 49 35 Haryana 6.1 -2 50 16 11 5 1 Tamil Nadu 4.0 95 38 -7 -24 -7 14 West Bengal 2.6 65 33 12 6 12 66 Orissa 2.2 66 26 -16 -23 31 49 Jharkhand 1.5 201 60 -5 8 49 37 Nepal 0.8 16 14 12 13 11 -5 North-East 0.8 -6 191 -15 25 60 38 ALL INDIA 16 28 0 4 6 26 Year-on-Year Tractor Industry Growth % Contribution (2010)States Tractor Industry : Key States  Domestic Sales across States …
  • 8.
    ● Currently >10players (including MNCs) in tractor manufacturing in India. ● About 90% of the market is shared by only the top five to six players. ● Mahindra & Mahindra (M&M) continues to dominate for more than 10 years with ~40% market share. Tractor Industry : Market Share  Trend : Brand Performance YoY … ► M&M continued to dominate the market ― In ‘09, it acquired PTL to further consolidatingits leadership position ― Gained from the synergies of acquisition: M&M’s post acquisition market share (39.7%),in FY11, increased from M&M & PTL’s combined FY08 market share (M&M 28.5%, PTL 8.1%) ► TAFE, the 2nd largest player, has been consistent over the years ► Escorts, the 3rd largest player, managed to maintain its position ― but has lost much of its market share ― 20% in FY00 has come down to 12.1% in FY11 ► John Deere, American MNC, has witnessed consistent growth
  • 9.
    Market Segmentation :Trend analysis  Sales Trend : Segment-wise movement … ► Broadly classified into 5 segments (of Horsepower) ─ less than 20 hp ─ 21 to 30 hp ─ 31 to 40 hp ─ 41 to 50 hp ─ more than 50 hp ► Mid segment (31-50 hp) : 70% ► 40+ hp growing fast 29%44% in 5 yr <20 hp 20-30 hp 31-40 hp 41-50 hp >51 hp Consistent decline 221913% (2001, 05, 11) Gradual decline 555142% (2001, 05, 11) Steady Growth 152128% (2001, 05, 11) High Growth 4816% (2001, 05, 11) Combined share of >40 hp more than doubled in 10 yr <20 hp : within 1% (2001-11)  Sales Trend : Changes in Market Share …
  • 10.
    ● More powerful& sophisticated tractors are making their way into the market. ● Dependence on machines is increasing every day due to a large exodus of farmers into urban areas, which in turn makes labor scarce and costly in rural areas. ● Also driven by a growing demand for tractors from the infrastructure / construction sector. ● In future, leasing may gain importance (as the future is expected to lie in co-operative farming). ● Beneficial for industry as well since it results in higher EBITDA Market Segmentation : Present & Future  Higher powered ( >50 hp) tractors : Key emerging segment … Structural shift in the industry towards higher powered tractors
  • 11.
    Consumer Buying :Behavior analysis  Tractor penetration … in Indian Farm Household  Changing expectations …  Selection of Tractor size : Trade-off between Utility & Price … ● A farmer’s choice of tractor size is typically a trade-off between utility of the tractor (includes haulage capacity requirement) and its price. ● Despite higher prices, several factors have led to a structural shift in industry towards higher powered tractors : ― Market expansion … high power required in paddy fields in South ― Scarcity of farm labor … urban migration, NAREGA ― Increasing non-agri application … haulage in infra & construction ― Strong replacement demand … 40% (avg. life cycle reduced to 8 yr  11 yr) ― Govt. initiative … easy credit availability, intention of contract farming ― Cheaper manufacturing … growth in export ++ Low Demand, Low Power, Basic need of agri 1960’s ~ 80’s 1990’s ~ 2000’s Powerful tractor with more features, Purchasing power, Retail finance ●Complete solution to farmer ●Enhanced performance ●Multi purpose tractor ●Advance features & Service/support 2010’s ~ vs
  • 12.
    Leading Brands :Positioning Strategy Mass Market Leader Complete solution Leader in High hp segment Technology makes life easy Ex-leader in High hp segment Good output, yet fuel efficient New in High hp segment Value for money Multi Utility Big Executive Smart Value
  • 13.
  • 14.
     Continuous communicationon product being Big  Powerful  Complete solution Marketing Strategy : by Leading Brands  Customers are targeted to be Smart & Intelligent  High level of Campaigns : Unique offers  Easy finance  Free offers  Corporate Ads  Emphasis on being No.1 (either in country by Mahindra or in regions by others)  Focus of Service support : 24x7 call, Web, Van  Easy Finance  Campaigns by Mobile Van
  • 15.
    Indian Tractor Market StrategicPerspective & Analysis Thanks …! SMP – 08 IIM Calcutta Group Assignment Report