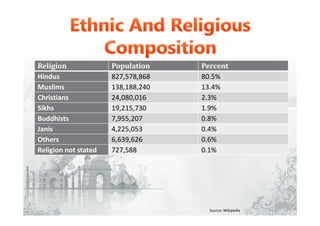
More Related Content Similar to India And It's Economy (20) India And It's Economy5. Religion Population Percent
Hindus 827,578,868 80.5%
Muslims 138,188,240 13.4%
Christians 24,080,016 2.3%
Sikhs 19,215,730 1.9%
Buddhists 7,955,207 0.8%
Janis 4,225,053 0.4%
Others 6,639,626 0.6%
Religion not stated 727,588 0.1%
Source: Wikipedia
28. Source: Panagariya, A. (2008).
0
1
2
3
4
5
6
7
8
1951-1965 1965-1981 1981-1988 1988-2006
2.9
2.1 2.1
3.4
6.7
4
6.3 6.5
4.7
4.3
6.5
7.8
4.1
3.5
4.8
6.3
Agriculture Industry Services Total
29. Source: Panagariya, A. (2008).
0
10
20
30
40
50
60
1950-51 1964-65 1980-81 1987-88 1995-96 2004-05 2006-07
57
49
40
33
24
21
18
15
23 24 26 27 26 2728
31
36
41
49
53 55
Agriculture Industry Services
33. Source: Eco. Survey 2008-09
0
50
100
150
200
250
300
350
400
450
500
FY 2002 FY2003 FY2004 FY 2005 FY2006 FY 2007 FY 2008 FY 2009
51 61 78
112
149
186
251
288
44 53 64
84
103
126
163 169
95 114
142
196
252
312
414
457
Imports Exports Total
39. 0
5
10
15
20
25
30
35
40
2003-04 2004-05 2005-06 2006-07 2007-08
29.8
31.7
34.2
35.7
37.7
27.6
32.1
35.5 36.9
39.1
25
28.4
31
32.5
34
Gross Domestic Saving Gross Capital Formation (Investment) Gross Fixed Capital Formation
Source: Eco. Survey 2008-09
40. 2000-01 2004-05 2005-06 2006-07 2007-08 2008-09
GDP(At Current Prices Rs. Cr) 1925017 2877701 3282385 3779384 4320892 4933183
GDP(At Constant Prices Rs. Cr) 1864300 2388768 2616101 2871120 3129717 3339374
Per Capita Net National
Product (At Constant Prices
Rs.)
16172 19331 20868 22580 24295 25494
Index of Agricultural
Production
165.7 177.3 191.9 200.7 207.1 188.7
Index of Industrial
Production
162.6 204.8 221.5 247.1 268.0 274.3
Wholesale Price Index
Average
155.7 187.3 195.6 206.2 215.8 234.0
Consumer Price Index
for Industrial Workers
Average
444.0 520.0 542.0 125 133 145
Source: Eco. Survey 2008-09
41. 2000-01 2004-05 2005-06 2006-07 2007-08 2008-09
Foodgrains 196.8 198.4 208.6 217.3 230.8 229.9
Finished Steele 31.2 41.3 44.4 50.2 53.3 53.5
Cement 99.2 125.3 140.5 154.7 167.6 181.4
Coal and Lignite 332.6 413.0 437.1 462.1 491.1 na
Crude Oil 32.4 34.0 32.2 34.0 34.1 33.5
Electricity Generated
(utilities only) (Billion KWH)
499 587 617 663 704 724
Plan outlay (Rs. Crore) 185737 193114 247178 244230 292336 375486
* million tons
Source: Eco. Survey 2008-09
42. 2000-01 2004-05 2005-06 2006-07 2007-08 2008-09
Population (Million) 1019 1089 1106 1122 1138 1154
Birth Rate (per 1000) 25.4 23.8 23.5 23.1 na na
Death Rate (per 1000) 8.4 7.6 7.5 7.4 na na
Life Expectancy at Birth (in
Years)
62.5 na na 63.5 na na
(a) Male 61.6 na na 62.6 na na
(b) Female 63.3 na na 64.2 na na
Education: Literacy Rate (%) 64.8 na 67.6 na na na
(a) Male 75.3 na na na na na
(b) Female 53.7 na na na na na
Health & Family Welfare RMP
(Thousand)
577.1 660.8 na na na na
RMP/10,000 population 5.6 6.0 na na na na
Source: Eco. Survey 2008-09
53. 0
20
40
60
80
100
120
Unskilled Male Skilled Male Unskilled Female Skilled Female
40.46
88.61
30.29
49.6950.81
119.38
44.48
49.87
Wages In India Agriculture Sector Wages In India Non-agriculture Sector
Source: http://labourbureau.nic.in/WRI-2003-04%20Exe%20Summary.htm