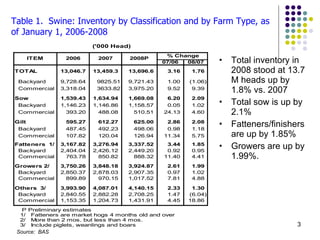
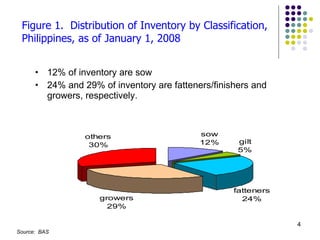
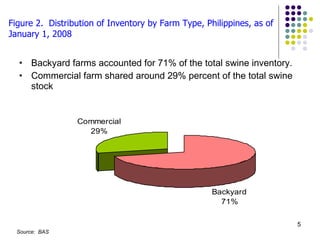
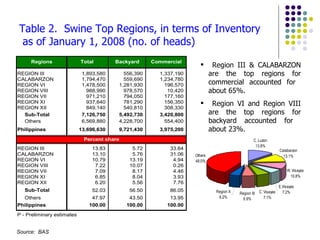
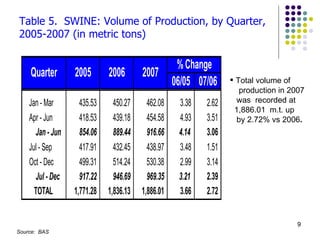
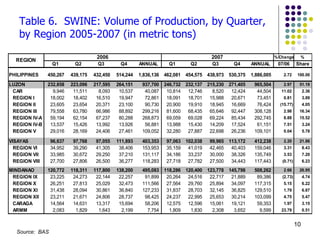
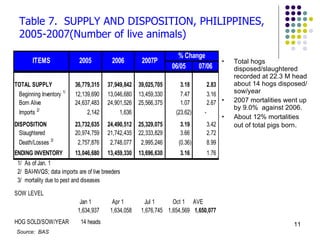
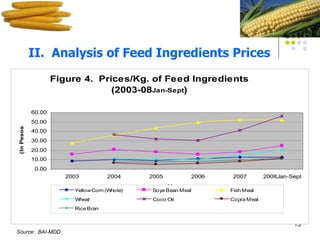
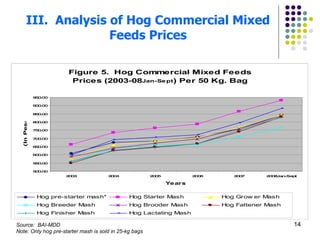
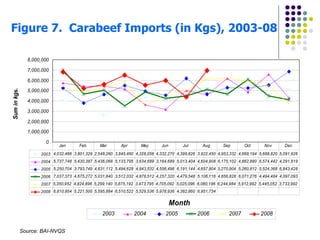
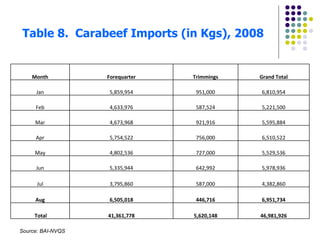
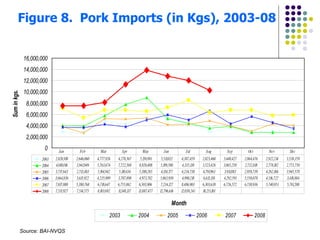
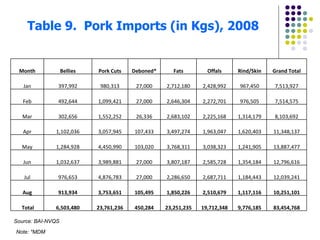
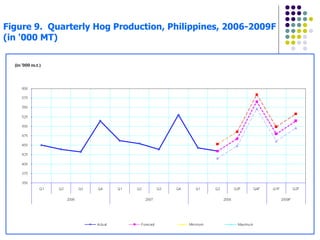
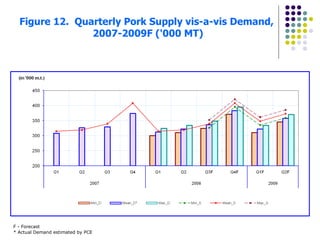
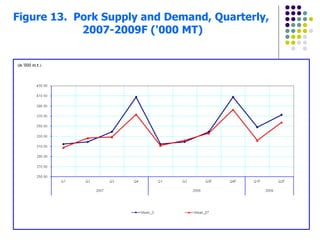
SWINE SITUATION REPORT  2008 Prepared by:   Lary Nel B. Abao, MBA Bureau of Animal Industry-Marketing Development Division
I. Swine Industry Performance
Table 1.  Swine: Inventory by Classification and by Farm Type, as of January 1, 2006-2008 Total inventory in 2008 stood at 13.7 M heads up by 1.8% vs. 2007 Total sow is up by 2.1% Fatteners/finishers are up by 1.85% Growers are up by 1.99%. Source:  BAS
Figure 1.  Distribution of Inventory by Classification,  Philippines, as of January 1, 2008 12% of inventory are sow 24% and 29% of inventory are fatteners/finishers and growers, respectively. Source:  BAS
Figure 2.  Distribution of Inventory by Farm Type, Philippines, as of January 1, 2008 Backyard farms accounted for 71% of the total swine inventory. Commercial farm shared around 29% percent of the total swine stock Source:  BAS
Table 2.  Swine Top Regions, in terms of Inventory  as of January 1, 2008 (no. of heads) Region III & CALABARZON are the top regions for commercial accounted for  about 65%. Region VI and Region VIII are the top regions for backyard accounted for  about 23%. Source:  BAS
Table 3.  Inventory Series by Age and By Quarter, 2006 – 2007 (Number of Head) P – Preliminary estimates Source:  BAS
Table 4.  SWINE:  Total Farm Inventory, by Region, by Quarter, 2006-2007 Almost half (45%) of swine inventory came from Luzon Source:  BAS
Table 5.  SWINE: Volume of Production, by Quarter, 2005-2007 (in metric tons) Total volume of  production in 2007  was  recorded at 1,886.01  m.t. up  by 2.72% vs 2006 . Source:  BAS
Table 6.  SWINE: Volume of Production, by Quarter, by Region 2005-2007 (in metric tons) Source:  BAS
Table 7.  SUPPLY AND DISPOSITION, PHILIPPINES, 2005-2007(Number of live animals) Total hogs disposed/slaughtered recorded at 22.3 M head about 14 hogs disposed/sow/year 2007 mortalities went up by 9.0%  against 2006. About 12% mortalities out of total pigs born . Source:  BAS
Source:  BAI-MDD
II.  Analysis of Feed Ingredients Prices Source:  BAI-MDD
III.  Analysis of Hog Commercial Mixed Feeds Prices Source:  BAI-MDD Note: Only hog pre-starter mash is sold in 25-kg bags
Figure 6.  Logistics Situation: Hogs (Live) Source: BAI-MDD; UNDP Study on Seed to Shelf HOG FARM P.72/kg P0.17/kg P12.42/kg P0.17/kg P2.31 P0.84/kg --- P18.65 Slaughter house • GSC Port • stevedoring • arastre Manila Port • stevedoring • arastre Includes • shipping • feeds • labor • shrinkage • mortality P93.00/kg • P4.00 Shipper’s  Margin P100.48/kg • P4.50 Wholesaler’s  Margin P126.78kg • P17.31 supermarket’s margin P144.09/kg P157.07kg • P30.29 Wet market’s margin
Figure 7.  Carabeef Imports (in Kgs), 2003-08 Source: BAI-NVQS
Table 8.  Carabeef Imports (in Kgs), 2008 Source: BAI-NVQS Month Forequarter Trimmings Grand Total Jan 5,859,954 951,000 6,810,954 Feb 4,633,976 587,524 5,221,500 Mar 4,673,968 921,916 5,595,884 Apr 5,754,522 756,000 6,510,522 May 4,802,536 727,000 5,529,536 Jun 5,335,944 642,992 5,978,936 Jul 3,795,860 587,000 4,382,860 Aug 6,505,018 446,716 6,951,734   Total 41,361,778 5,620,148 46,981,926
Figure 8.  Pork Imports (in Kgs), 2003-08 Source: BAI-NVQS
Table 9.  Pork Imports (in Kgs), 2008 Source: BAI-NVQS Note: *MDM Month Bellies Pork Cuts Deboned* Fats Offals Rind/Skin Grand Total Jan 397,992 980,313 27,000 2,712,180 2,428,992 967,450 7,513,927 Feb 492,644 1,099,421 27,000 2,646,304 2,272,701 976,505 7,514,575 Mar 302,656 1,552,252 26,336 2,683,102 2,225,168 1,314,179 8,103,692 Apr 1,102,036 3,057,945 107,433 3,497,274 1,963,047 1,620,403 11,348,137 May 1,284,928 4,450,990 103,020 3,768,311 3,038,323 1,241,905 13,887,477 Jun 1,032,637 3,989,881 27,000 3,807,187 2,585,728 1,354,184 12,796,616 Jul 976,653 4,876,783 27,000 2,286,650 2,687,711 1,184,443 12,039,241 Aug 913,934 3,753,651 105,495 1,850,226 2,510,679 1,117,116 10,251,101   Total 6,503,480 23,761,236 450,284 23,251,235 19,712,348 9,776,185 83,454,768
CURRENT:  Supply = Production current  + Total Imports where HProd = c + FAT t-1  +   GROW t-1  + SOW t-4  +  e VII. Pork Supply Forecast for 2008
Figure 9.  Quarterly Hog Production, Philippines, 2006-2009F  (in '000 MT)
Table 10.  Quarterly Hog Production, 2006-2009F  (in '000 MT) Month Production Percent Change Actual Forecast 07/06 08/07 09/08 2006 2007 2008 2008 2009 min mean min mean Q1 450.27 462.08 442.70     460.93 479.75 2.62  (4.19) 8.37  Q2 439.18 454.58 434.25     495.63 514.45 3.51  (4.47) 18.47  SEM1 889.45 916.66 876.95     956.56 994.20 3.06 (4.33) 13.37  Q3 432.45 438.97   448.25 467.06     1.51  6.40  #DIV/0! Q4 514.24 530.38   546.65  565.47     3.14  6.62  #DIV/0! SEM2 946.69 969.35   994.90 1032.53     2.39 6.52    ANNUAL 1,836.14  1,886.00  876.95  994.90  1,032.53      2.72  1.24   
Table 11.  Quarterly Pork Imports,  2006 - 2008F ('000 MT) Qtr Year % Change 2007 2008 2009 08/07 09/08 Q1 2.05  4.83  12.16  135.36  151.98  Q2 2.68  14.92  12.20  456.87  (18.22) Sem 1 4.73  19.74  24.36  317.49  23.38  Q3 5.06  12.07    138.84    Q4 3.66  12.12    230.72    Sem 2 8.72  24.19  0.00  177.45    Total 13.45 43.93 24.36 226.70    F - Forecast
Figure 10.  Quarterly Pork Supply, Phils.,  2006-2009F ('000 MT)
Table 12.  Quarterly Pork Supply, 2007-2009F  ('000 MT) Qtr 2007 2008 2008 2009 % Change 2008F min 2008F 2008F max 2009F min 2009F 2009F max 08/07 09Fmin/ 08 09F/ 08 09Fmax/08 Q1 325.51  314.72        334.95  347.98  361.02  (3.32) 6.43  10.57  14.71  Q2 320.88  318.89        359.27  372.31  385.35  (0.62) 12.66  16.75  20.84  Sem 1 646.39  633.61        694.22  720.30  746.37  (1.98) 9.57  13.68  17.80  Q3 312.34    325.98  339.02  352.06        (100.00) #DIV/0! #DIV/0! #DIV/0! Q4 374.93    394.90  407.94  420.98        (100.00) #DIV/0! #DIV/0! #DIV/0! Sem 2 687.26  0.00  720.89  746.96  773.04  0.00  0.00  0.00  (100.00)       Total 1,333.65  633.61  720.89  746.96  773.04  694.22  720.30  746.37  3.52  9.57  13.68  17.80  F–Forecast
CURRENT: Regression Model Dependent Variable  – based on household pork consumption of FIES (1994-2003) Independent variables : PCE at current prices, wholesale price of pork in MM Error term is normal, heteroscedastic, has serial correlation but no multicollinearity R 2  = 95.9%  MAPE = 2.08%  where HDem = c + PCE c  +   WPP BAS  +   e VIII. Pork Demand Forecast for 2008
Figure 11.  Quarterly Pork Demand, Philippines, 2007-2009F  ('000 MT)* F - Forecast *used 70% to convert as carcass
Table 13.  Quarterly Pork Demand,  2007-2009F ('000 MT) Qtr Year % Change 2007 2008 min 2008 2008 max 2009F min 2009F 2009F max 08Fmin/ 07 08F/ 07 08Fmax/07 09Fmin/ 08F 09F/ 08F 09Fmax/ 08F Q1 307.99 299.65 311.79 323.93 309.71 321.85 333.99 (2.71) 1.23  5.17  (0.67) 3.23  7.12  Q2 326.49 309.69 321.83 333.97 345.55 357.69 369.83 (5.15) (1.43) 2.29  7.37  11.14  14.92  Sem 1 634.48 609.33 633.61 657.89 655.26 679.54 703.82 (3.96) (0.14) 3.69  3.42  7.25  11.08  Q3 328.91 324.15 336.29 348.43       (1.45) 2.24  5.94  (100.00) (100.00) (100.00) Q4 373.39 370.65 382.79 394.93       (0.74) 2.52  5.77  (100.00) (100.00) (100.00) Sem 2 702.30 694.80 719.08 743.36       (1.07) 2.39  5.85        Total 1,336.78 1,304.13 1,352.69 1,401.25 655.26 679.54 703.82 (2.44) 1.19  4.82        F-Forecast Revised PCE from NSCB Latest FIES is 2006 from NSO 2006 pork fies based on 2003 ratio
IX. Pork Supply & Demand Forecast  for 2008
Figure 12.  Quarterly Pork Supply vis-a-vis Demand,  2007-2009F ('000 MT) F - Forecast * Actual Demand estimated by PCE
Figure 13.  Pork Supply and Demand, Quarterly,  2007-2009F ('000 MT)
Thank you very much!

Lery Abao Presentation Farm Foundation

  • 1.
    SWINE SITUATION REPORT 2008 Prepared by: Lary Nel B. Abao, MBA Bureau of Animal Industry-Marketing Development Division
  • 2.
    I. Swine IndustryPerformance
  • 3.
    Table 1. Swine: Inventory by Classification and by Farm Type, as of January 1, 2006-2008 Total inventory in 2008 stood at 13.7 M heads up by 1.8% vs. 2007 Total sow is up by 2.1% Fatteners/finishers are up by 1.85% Growers are up by 1.99%. Source: BAS
  • 4.
    Figure 1. Distribution of Inventory by Classification, Philippines, as of January 1, 2008 12% of inventory are sow 24% and 29% of inventory are fatteners/finishers and growers, respectively. Source: BAS
  • 5.
    Figure 2. Distribution of Inventory by Farm Type, Philippines, as of January 1, 2008 Backyard farms accounted for 71% of the total swine inventory. Commercial farm shared around 29% percent of the total swine stock Source: BAS
  • 6.
    Table 2. Swine Top Regions, in terms of Inventory as of January 1, 2008 (no. of heads) Region III & CALABARZON are the top regions for commercial accounted for about 65%. Region VI and Region VIII are the top regions for backyard accounted for about 23%. Source: BAS
  • 7.
    Table 3. Inventory Series by Age and By Quarter, 2006 – 2007 (Number of Head) P – Preliminary estimates Source: BAS
  • 8.
    Table 4. SWINE: Total Farm Inventory, by Region, by Quarter, 2006-2007 Almost half (45%) of swine inventory came from Luzon Source: BAS
  • 9.
    Table 5. SWINE: Volume of Production, by Quarter, 2005-2007 (in metric tons) Total volume of production in 2007 was recorded at 1,886.01 m.t. up by 2.72% vs 2006 . Source: BAS
  • 10.
    Table 6. SWINE: Volume of Production, by Quarter, by Region 2005-2007 (in metric tons) Source: BAS
  • 11.
    Table 7. SUPPLY AND DISPOSITION, PHILIPPINES, 2005-2007(Number of live animals) Total hogs disposed/slaughtered recorded at 22.3 M head about 14 hogs disposed/sow/year 2007 mortalities went up by 9.0% against 2006. About 12% mortalities out of total pigs born . Source: BAS
  • 12.
  • 13.
    II. Analysisof Feed Ingredients Prices Source: BAI-MDD
  • 14.
    III. Analysisof Hog Commercial Mixed Feeds Prices Source: BAI-MDD Note: Only hog pre-starter mash is sold in 25-kg bags
  • 15.
    Figure 6. Logistics Situation: Hogs (Live) Source: BAI-MDD; UNDP Study on Seed to Shelf HOG FARM P.72/kg P0.17/kg P12.42/kg P0.17/kg P2.31 P0.84/kg --- P18.65 Slaughter house • GSC Port • stevedoring • arastre Manila Port • stevedoring • arastre Includes • shipping • feeds • labor • shrinkage • mortality P93.00/kg • P4.00 Shipper’s Margin P100.48/kg • P4.50 Wholesaler’s Margin P126.78kg • P17.31 supermarket’s margin P144.09/kg P157.07kg • P30.29 Wet market’s margin
  • 16.
    Figure 7. Carabeef Imports (in Kgs), 2003-08 Source: BAI-NVQS
  • 17.
    Table 8. Carabeef Imports (in Kgs), 2008 Source: BAI-NVQS Month Forequarter Trimmings Grand Total Jan 5,859,954 951,000 6,810,954 Feb 4,633,976 587,524 5,221,500 Mar 4,673,968 921,916 5,595,884 Apr 5,754,522 756,000 6,510,522 May 4,802,536 727,000 5,529,536 Jun 5,335,944 642,992 5,978,936 Jul 3,795,860 587,000 4,382,860 Aug 6,505,018 446,716 6,951,734   Total 41,361,778 5,620,148 46,981,926
  • 18.
    Figure 8. Pork Imports (in Kgs), 2003-08 Source: BAI-NVQS
  • 19.
    Table 9. Pork Imports (in Kgs), 2008 Source: BAI-NVQS Note: *MDM Month Bellies Pork Cuts Deboned* Fats Offals Rind/Skin Grand Total Jan 397,992 980,313 27,000 2,712,180 2,428,992 967,450 7,513,927 Feb 492,644 1,099,421 27,000 2,646,304 2,272,701 976,505 7,514,575 Mar 302,656 1,552,252 26,336 2,683,102 2,225,168 1,314,179 8,103,692 Apr 1,102,036 3,057,945 107,433 3,497,274 1,963,047 1,620,403 11,348,137 May 1,284,928 4,450,990 103,020 3,768,311 3,038,323 1,241,905 13,887,477 Jun 1,032,637 3,989,881 27,000 3,807,187 2,585,728 1,354,184 12,796,616 Jul 976,653 4,876,783 27,000 2,286,650 2,687,711 1,184,443 12,039,241 Aug 913,934 3,753,651 105,495 1,850,226 2,510,679 1,117,116 10,251,101   Total 6,503,480 23,761,236 450,284 23,251,235 19,712,348 9,776,185 83,454,768
  • 20.
    CURRENT: Supply= Production current + Total Imports where HProd = c + FAT t-1 + GROW t-1 + SOW t-4 + e VII. Pork Supply Forecast for 2008
  • 21.
    Figure 9. Quarterly Hog Production, Philippines, 2006-2009F (in '000 MT)
  • 22.
    Table 10. Quarterly Hog Production, 2006-2009F (in '000 MT) Month Production Percent Change Actual Forecast 07/06 08/07 09/08 2006 2007 2008 2008 2009 min mean min mean Q1 450.27 462.08 442.70     460.93 479.75 2.62 (4.19) 8.37 Q2 439.18 454.58 434.25     495.63 514.45 3.51 (4.47) 18.47 SEM1 889.45 916.66 876.95     956.56 994.20 3.06 (4.33) 13.37 Q3 432.45 438.97   448.25 467.06     1.51 6.40 #DIV/0! Q4 514.24 530.38   546.65 565.47     3.14 6.62 #DIV/0! SEM2 946.69 969.35   994.90 1032.53     2.39 6.52   ANNUAL 1,836.14 1,886.00 876.95 994.90 1,032.53     2.72 1.24  
  • 23.
    Table 11. Quarterly Pork Imports, 2006 - 2008F ('000 MT) Qtr Year % Change 2007 2008 2009 08/07 09/08 Q1 2.05 4.83 12.16 135.36 151.98 Q2 2.68 14.92 12.20 456.87 (18.22) Sem 1 4.73 19.74 24.36 317.49 23.38 Q3 5.06 12.07   138.84   Q4 3.66 12.12   230.72   Sem 2 8.72 24.19 0.00 177.45   Total 13.45 43.93 24.36 226.70   F - Forecast
  • 24.
    Figure 10. Quarterly Pork Supply, Phils., 2006-2009F ('000 MT)
  • 25.
    Table 12. Quarterly Pork Supply, 2007-2009F ('000 MT) Qtr 2007 2008 2008 2009 % Change 2008F min 2008F 2008F max 2009F min 2009F 2009F max 08/07 09Fmin/ 08 09F/ 08 09Fmax/08 Q1 325.51 314.72       334.95 347.98 361.02 (3.32) 6.43 10.57 14.71 Q2 320.88 318.89       359.27 372.31 385.35 (0.62) 12.66 16.75 20.84 Sem 1 646.39 633.61       694.22 720.30 746.37 (1.98) 9.57 13.68 17.80 Q3 312.34   325.98 339.02 352.06       (100.00) #DIV/0! #DIV/0! #DIV/0! Q4 374.93   394.90 407.94 420.98       (100.00) #DIV/0! #DIV/0! #DIV/0! Sem 2 687.26 0.00 720.89 746.96 773.04 0.00 0.00 0.00 (100.00)       Total 1,333.65 633.61 720.89 746.96 773.04 694.22 720.30 746.37 3.52 9.57 13.68 17.80 F–Forecast
  • 26.
    CURRENT: Regression ModelDependent Variable – based on household pork consumption of FIES (1994-2003) Independent variables : PCE at current prices, wholesale price of pork in MM Error term is normal, heteroscedastic, has serial correlation but no multicollinearity R 2 = 95.9% MAPE = 2.08% where HDem = c + PCE c + WPP BAS + e VIII. Pork Demand Forecast for 2008
  • 27.
    Figure 11. Quarterly Pork Demand, Philippines, 2007-2009F ('000 MT)* F - Forecast *used 70% to convert as carcass
  • 28.
    Table 13. Quarterly Pork Demand, 2007-2009F ('000 MT) Qtr Year % Change 2007 2008 min 2008 2008 max 2009F min 2009F 2009F max 08Fmin/ 07 08F/ 07 08Fmax/07 09Fmin/ 08F 09F/ 08F 09Fmax/ 08F Q1 307.99 299.65 311.79 323.93 309.71 321.85 333.99 (2.71) 1.23 5.17 (0.67) 3.23 7.12 Q2 326.49 309.69 321.83 333.97 345.55 357.69 369.83 (5.15) (1.43) 2.29 7.37 11.14 14.92 Sem 1 634.48 609.33 633.61 657.89 655.26 679.54 703.82 (3.96) (0.14) 3.69 3.42 7.25 11.08 Q3 328.91 324.15 336.29 348.43       (1.45) 2.24 5.94 (100.00) (100.00) (100.00) Q4 373.39 370.65 382.79 394.93       (0.74) 2.52 5.77 (100.00) (100.00) (100.00) Sem 2 702.30 694.80 719.08 743.36       (1.07) 2.39 5.85       Total 1,336.78 1,304.13 1,352.69 1,401.25 655.26 679.54 703.82 (2.44) 1.19 4.82       F-Forecast Revised PCE from NSCB Latest FIES is 2006 from NSO 2006 pork fies based on 2003 ratio
  • 29.
    IX. Pork Supply& Demand Forecast for 2008
  • 30.
    Figure 12. Quarterly Pork Supply vis-a-vis Demand, 2007-2009F ('000 MT) F - Forecast * Actual Demand estimated by PCE
  • 31.
    Figure 13. Pork Supply and Demand, Quarterly, 2007-2009F ('000 MT)
  • 32.