Download as PDF, PPTX


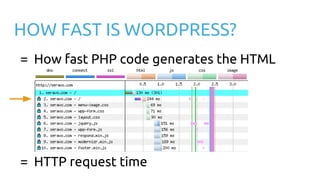
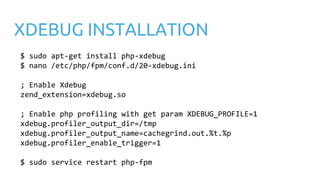
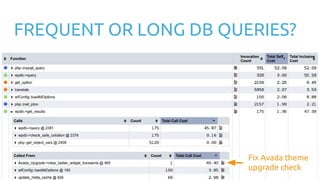
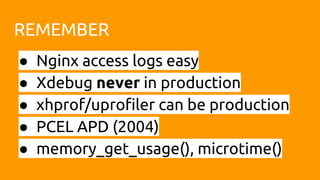
![LOG HTTP REQUEST TIME
[29/May/2017:10:02:45 +0300] "POST /wp-admin/admin-ajax.php
HTTP/1.1" 200 58 "Mozilla/5.0 (KHTML, like Gecko)
Chrome/58.0.3029.110 Safari/537.36" - - 0.028
nginx.conf
log_format extensive '$host '
'$remote_addr - $remote_user [$time_local] '
'"$request" $status $body_bytes_sent '
'"$http_referer" "$http_user_agent" '
'$upstream_cache_status - '
'$request_time';](https://image.slidesharecdn.com/improvingwordpressperformancexdebugandprofiling-ottokeklinen-171209164249/85/Improving-WordPress-performance-xdebug-and-profiling-16-320.jpg)


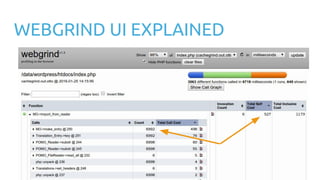


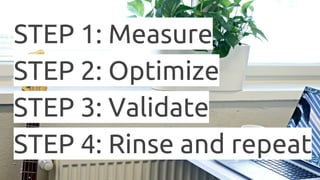
The document discusses optimizing WordPress performance using methods like measuring, optimizing, validating, and repeating the process. It highlights common challenges such as security and speed, provides tools for measuring performance, and shares techniques for identifying bottlenecks using tools like Xdebug and WP-CLI. Additionally, it includes a case study to demonstrate the effectiveness of optimizations made to the Twenty Seventeen theme.


![谷歌留痕技术教程[ 𝙩𝙤𝙥 𝟮𝟯𝟯. 𝙘 𝙤𝙢 ]](https://cdn.slidesharecdn.com/ss_thumbnails/top233-260130173900-2eb784f9-thumbnail.jpg?width=640&height=640&fit=bounds)

