Download to read offline


![LOG HTTP REQUEST TIME
[29/May/2017:10:02:45 +0300] "POST /wp-admin/admin-ajax.php
HTTP/1.1" 200 58 "Mozilla/5.0 (KHTML, like Gecko)
Chrome/58.0.3029.110 Safari/537.36" - - 0.028
nginx.conf
log_format extensive '$host '
'$remote_addr - $remote_user [$time_local] '
'"$request" $status $body_bytes_sent '
'"$http_referer" "$http_user_agent" '
'$upstream_cache_status - '
'$request_time';](https://image.slidesharecdn.com/xxmattdqkiho5ezswjlp-signature-7c360c7111327169948ebaecfb91660a51131bcced8de3e0cb646737df44e7cd-poli-170622081858/85/Improving-WordPress-Performance-Xdebug-and-PHP-profiling-16-320.jpg)

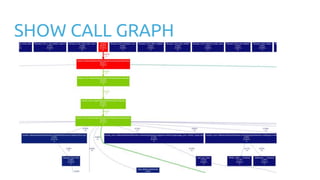
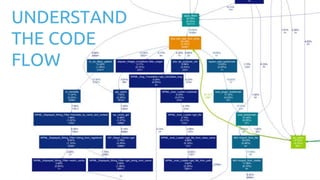

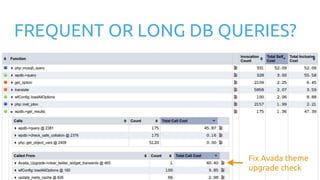
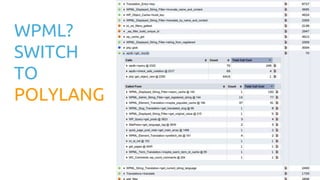


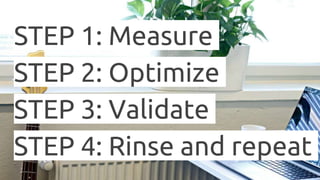
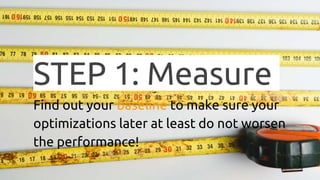
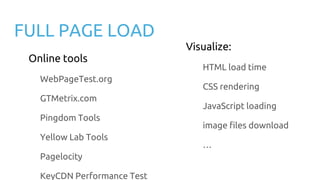
The document is a presentation by Otto Kekäläinen focusing on improving WordPress performance through tools like Xdebug and PHP profiling. It outlines a four-step process for performance optimization: measure, optimize, validate, and repeat, emphasizing the importance of identifying bottlenecks and utilizing various testing tools. The presentation also includes practical examples and best practices for developers to enhance website speed and decrease load times in WordPress applications.


![20260201 [FOSDEM] gomodjail - library sandboxing for Go modules.pdf](https://cdn.slidesharecdn.com/ss_thumbnails/20260201fosdemgomodjail-librarysandboxingforgomodules-260201225659-76609ec4-thumbnail.jpg?width=640&height=640&fit=bounds)


