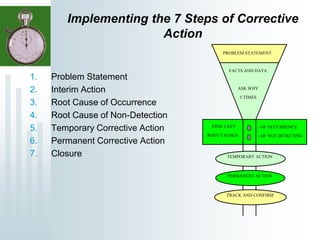
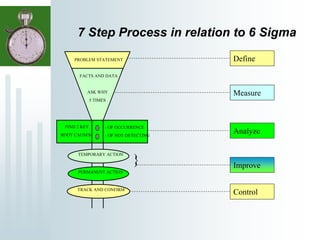
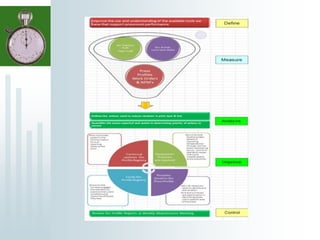
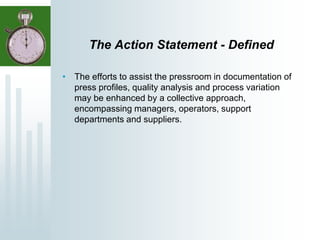
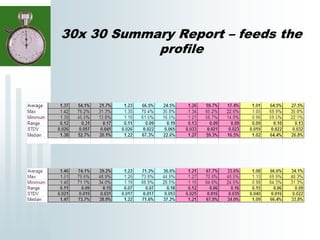
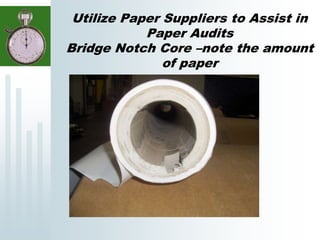
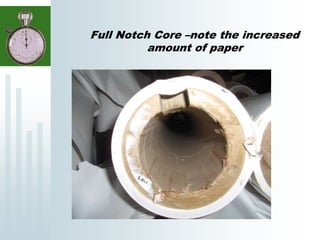
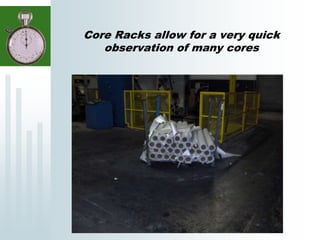
This document outlines a Lean and Total Productive Maintenance project implemented in a retail printing facility to improve productivity. It describes a 7-step corrective action methodology used to define problems, analyze root causes, and implement temporary and permanent corrective actions. A variety of measurement tools were utilized including process variation analysis, downtime tracking, waste analysis, and quality metrics. The project focused on enhancing press performance through documentation of press profiles, quality analysis, and reducing process variation using a collaborative approach across departments and with suppliers. Regular audits and meetings were used to monitor progress and ensure controls remained in place.
Six Sigma Process Capability Study (PCS) Training Module Frank-G. Adler
The Process Capability Study (PCS) Training Module v3.0 includes:
1. MS PowerPoint Presentation including 98 slides covering Introduction to Six Sigma, Creating and analyzing a Histogram, Basic Statistics & Product Capability, Statistical Process Control for Variable Data, Definitions of Process Capability Indices, Confidence Interval Analysis for Capability Indices, Capability Study for Non-Normal Distributed Processes, and several Exercises.
2. MS Excel Confidence Interval Analysis Calculator making it really easy to calculate Confidence Intervals for Capability Indices and other Statistics.
Incremental improvements in OEE lead to additional uptime, increased capacity, better quality, lower costs, and the ability to grow without adding more machinery. OEE experts from TBM discuss three key areas of opportunity and what you can do now to move the needle and make a big impact.
Essential Statistical Methods for Process & Product OptimizationSafetyChain Software
Many companies face a unique dilemma: they’re data rich but information poor. Join Allise Wachs, Ph.D., for statistical concepts and methods that manufacturers can use to optimize products, processes, and decisions
OEE (Overall Equipment Effectiveness), is *not* just about your machines or downtime improvements, it's a holistic indicator of your plant's health, efficiency, and productivity. Learn about the benefits of OEE and how to get started calculating this "best practices" KPI with resources at hand.
Line Crew Optimisation is a process that reviews and optimises the established flow patterns, links process steps in order to minimise cycle times and travel distance, and eliminates crossover points in order to achieve a continuous flow process
Do you have an OEE calculator? TBM Operations consultants share their framework for demonstrating process improvements in financial terms so you can convince senior management that OEE improvement should be a top priority in 2022.
[To download this poster, visit:
https://www.oeconsulting.com.sg/training-presentations]
The Quality Maintenance (Hinshitsu Hozen) Poster describes the systematic approach for establishing and maintaining zero-defect conditions to create 100% good products.
The poster comes in four monochrome variations. Formatted in PDF and in editable PPTX, the poster can be easily printed on an A3 or A4-sized paper from an office copier machine and displayed on employee workstations, or distributed together with your workshop handouts.
The Quality Maintenance Poster complements the 'Quality Maintenance (Hinshitsu Hozen)' training presentation materials. It serves as a takeaway and summary of your TPM and Quality Maintenance presentation.
The 8 Steps of Quality Maintenance are:
Step 1: Verify the Existing Situation
Step 2: Investigate the Processes where Defects Occur
Step 3: Identify & Analyze 4M Conditions
Step 4: Plan Action to Correct Deficiencies
Step 5: Establish Conditions that Allow Good Products to be Achieved
Step 6: Eliminate Flaws in 4M Conditions and Finalize
Step 7: Consolidate Checking Methods
Step 8: Determine Standard Values for Checks & Revise Standards
To downoad this poster, visit:
https://www.oeconsulting.com.sg/training-presentations
Learn the secret, frequently missing value in CoQ calculations, how to quantify conformance & non-conformance costs, ways to measure prevention, appraisal, and internal/external failure costs, why quality failures drain production capacity, and get tips for reducing CoQ in your facility.
Process Mapping and Process Improvement for the Small Business OwnerMichiko Diby
This is a low-key, simple presentation for the small business owner.
Use this method to get a visual on bottlenecks, and create new processes that make work productive and fun.
Proactive Internal Auditing -- The Key to Improving Your Quality SystemSafetyChain Software
Auditing against a standard like ISO 9001 or one of the GFSI schemes isn’t easy and is rarely effective without the proper training, guidance, and tools. IJ Arora, CEO of Quality Management International Inc. (QMII) provides tips on the Internal Auditing process.
UAS Manajemen Kualitas dan Standar Mutu - Total Quality ManagementCandy Chua
Ujian Akhir Semester
Manajemen Kualitas dan Standar Mutu
Total Quality Management
Dosen: Prof. Ir. Syamsir Abduh, MM. Ph.D
Nama Anggota Kelompok:
Antony S 222160505
Candy 222160506
Jonathan 222160509
Program Doktor Strategik
Universitas Trisakti
The basic concept of TQM
Works methods
Processes and practices
If the participants happen to be an instructor, they will become high-quality instructor and will able to develop high-quality students who can be matched with the global standards.
Chapter 10 of ICT Project Management based on IOE Engineering syllabus. This chapter includes topic related to quality theories, quality planning, cost of quality and more on quality management of project. Provided by Project Management Sir of KU.
'How To Apply Lean Test Management' by Bob van de BurgtTEST Huddle
Cost reductions and the quest for more efficiency are more evident in today’s business world. It also follows that our testing processes will ultimately be affected. When test techniques and methods for structured testing are introduced, this results in improvements in the production of more consistent and predictable results.
Introducing a risk based approach to testing makes it easier for the business to determine to what extent testing is necessary and most efficient. The resulting Go/No- Go decision process may not be sufficient for all companies so other creative methods need to be investigated. Many management theories speak about “Lean” as being one of the solutions. One of the key steps in using “Lean” is the identification of which steps add value to the customer and which do not. This track will give you information to start using “Lean” within testing and more specifically within test management.
The presenter will also look at Lean Six Sigma as being one of the more popular theories that introduces the concept of “Lean” in combination with obtaining higher quality products. This subject will also be explained in combination with testing and test management. This track will focus on applying Lean Six Sigma techniques to test management processes using practical examples from customer cases. The audience can take home a practical “Lean Test Management” overview which they can apply in their own companies.
This track is especially of interest to business managers, IT managers, QA managers and test managers that are involved in improving the quality of test management processes.
During the module, we will run a lean improvement simulation. This simulation will involve your team running a ‘bad’ process alongside another team and through various iterations of improvement turning it into a ‘good’ process.
The team project report needs to analyse the decisions that you made during the simulation.
You should present some of the key data from the simulation – WIP, throughput time and improvement decisions. The report should then analyse what happened using process improvement and lean terminology.
In particular, the report should identify what happened (in terms of the decisions that you made) the impact of these decisions on the operation and then lastly make recommendations for what might be done differently next time (key learning points)
Please note:
• Limit your work to 8 pages
• The page count is all-inclusive and includes any graphs, tables, or references.
• As a formatting guideline use: Arial 12 point with 25mm margins on all four sides, A4 paper
• Cover pages, etc. are not required.
2. Problem Solving 101
Studies have shown that fixing a problem requires 90%
of the time spent in finding the root cause……..
3. 7 Steps of Corrective Action
•“7 Steps approach” is a problem-solving methodology
for product and process improvement.
•It is structured into seven disciplines, emphasizing team
synergy.
•The team as whole is better and smarter than any 1 of
us
•Each discipline is supported by a checklist of
assessment questions,
such as “what is wrong with what”, “what, when, where,
how much”.
4. Implementing the 7 Steps of Corrective
Action
1. Problem Statement
2. Interim Action
3. Root Cause of Occurrence
4. Root Cause of Non-Detection
5. Temporary Corrective Action
6. Permanent Corrective Action
7. Closure
FIND 2 KEY
ROOT CAUSES:
PROBLEM STATEMENT
FACTS AND DATA
ASK WHY
5 TIMES
TEMPORARY ACTION
PERMANENT ACTION
TRACK AND CONFIRM
- OF OCCURRENCE
- OF NOT DETECTING
5. 7 Step Process in relation to 6 Sigma
FIND 2 KEY
ROOT CAUSES:
PROBLEM STATEMENT
FACTS AND DATA
ASK WHY
5 TIMES
TEMPORARY ACTION
PERMANENT ACTION
TRACK AND CONFIRM
- OF OCCURRENCE
- OF NOT DETECTING
Define
Measure
Analyze
Improve
Control
}
6.
7. The Action Statement - Defined
• The efforts to assist the pressroom in documentation of
press profiles, quality analysis and process variation
may be enhanced by a collective approach,
encompassing managers, operators, support
departments and suppliers.
8. Define
The purpose of a press profile is determine the issues
that operators face effecting the performance and
efficiency of the press.
Process variation will determine those areas of the
press that fail to remain in control during operation
Quality measurement provides information on the
ability of the press to produce a customers
expectation of Quality
Documentation of these processes assist to develop
action plans needed to improve the process and
determine cost associated to the improvements.
Improvements effect
Customer Satisfaction – Plant Profitability –
Employee’s Work Environment.
9. Define - Measure - Tools
• Process Variation - “30 x 30” - Production Sampling
• Unplanned Downtime - Top 10 Causes - Pivot Table
Report
• Waste - Top 10 Causes - Pivot Table Reports
• Quality Attainment -Curve Measurement - Worksheet
• Press Profile - Operator’s Checklist
• Temperature Profile - Ink Audit Report
• Vibration Analysis - Report
• Paper Performance - Paper Audit
• Broken Windows - Pictures
• Sop Audits
10. Analysis
• Any of the tools previously mentioned are good by
themselves, but when combined together provide direction
and priority to what needs to be accomplished to improve.
• What comes first, the compass or the clock? Before one
can truly manage time (the clock), it is important to know
where you are going, what your priorities and goals are, in
which direction you are headed (the compass). Where you
are headed is more important than how fast you are going.
Rather than always focusing on what's urgent, learn to
focus on what is really important.
11. Improve
• Use the Action Item Register to set time lines and
responsibility
• Insure the TPM program is updated when needed
• Spin off projects
• Training Opportunities
• Feed back to suppliers – ink and paper
• Develop capital plan as required
12. Control
• Saving projects
• Sop Audits
• 5s
• Training Matrix
• Weekly Maintenance Meetings
• Customer Reviews
35. Tools in the Box
• Profile – Weekly Meeting
• Score Cards – Weekly Posted
• 5s Inspections
• Technical Audits
• Ink Supplier Audits
• Roller Program
• Auxiliary Equipment TPM
• Paper Supplier Audits
• 30 by 30 – Press Curve Work Sheet
36. This is an abbreviated
review of an improvement
project developed and
implemented for a wide
web retail Print Facility.
For more information
Contact Information
Tim Hopper (204) 996-9057 or timhopper12@gmail.com