Download to read offline
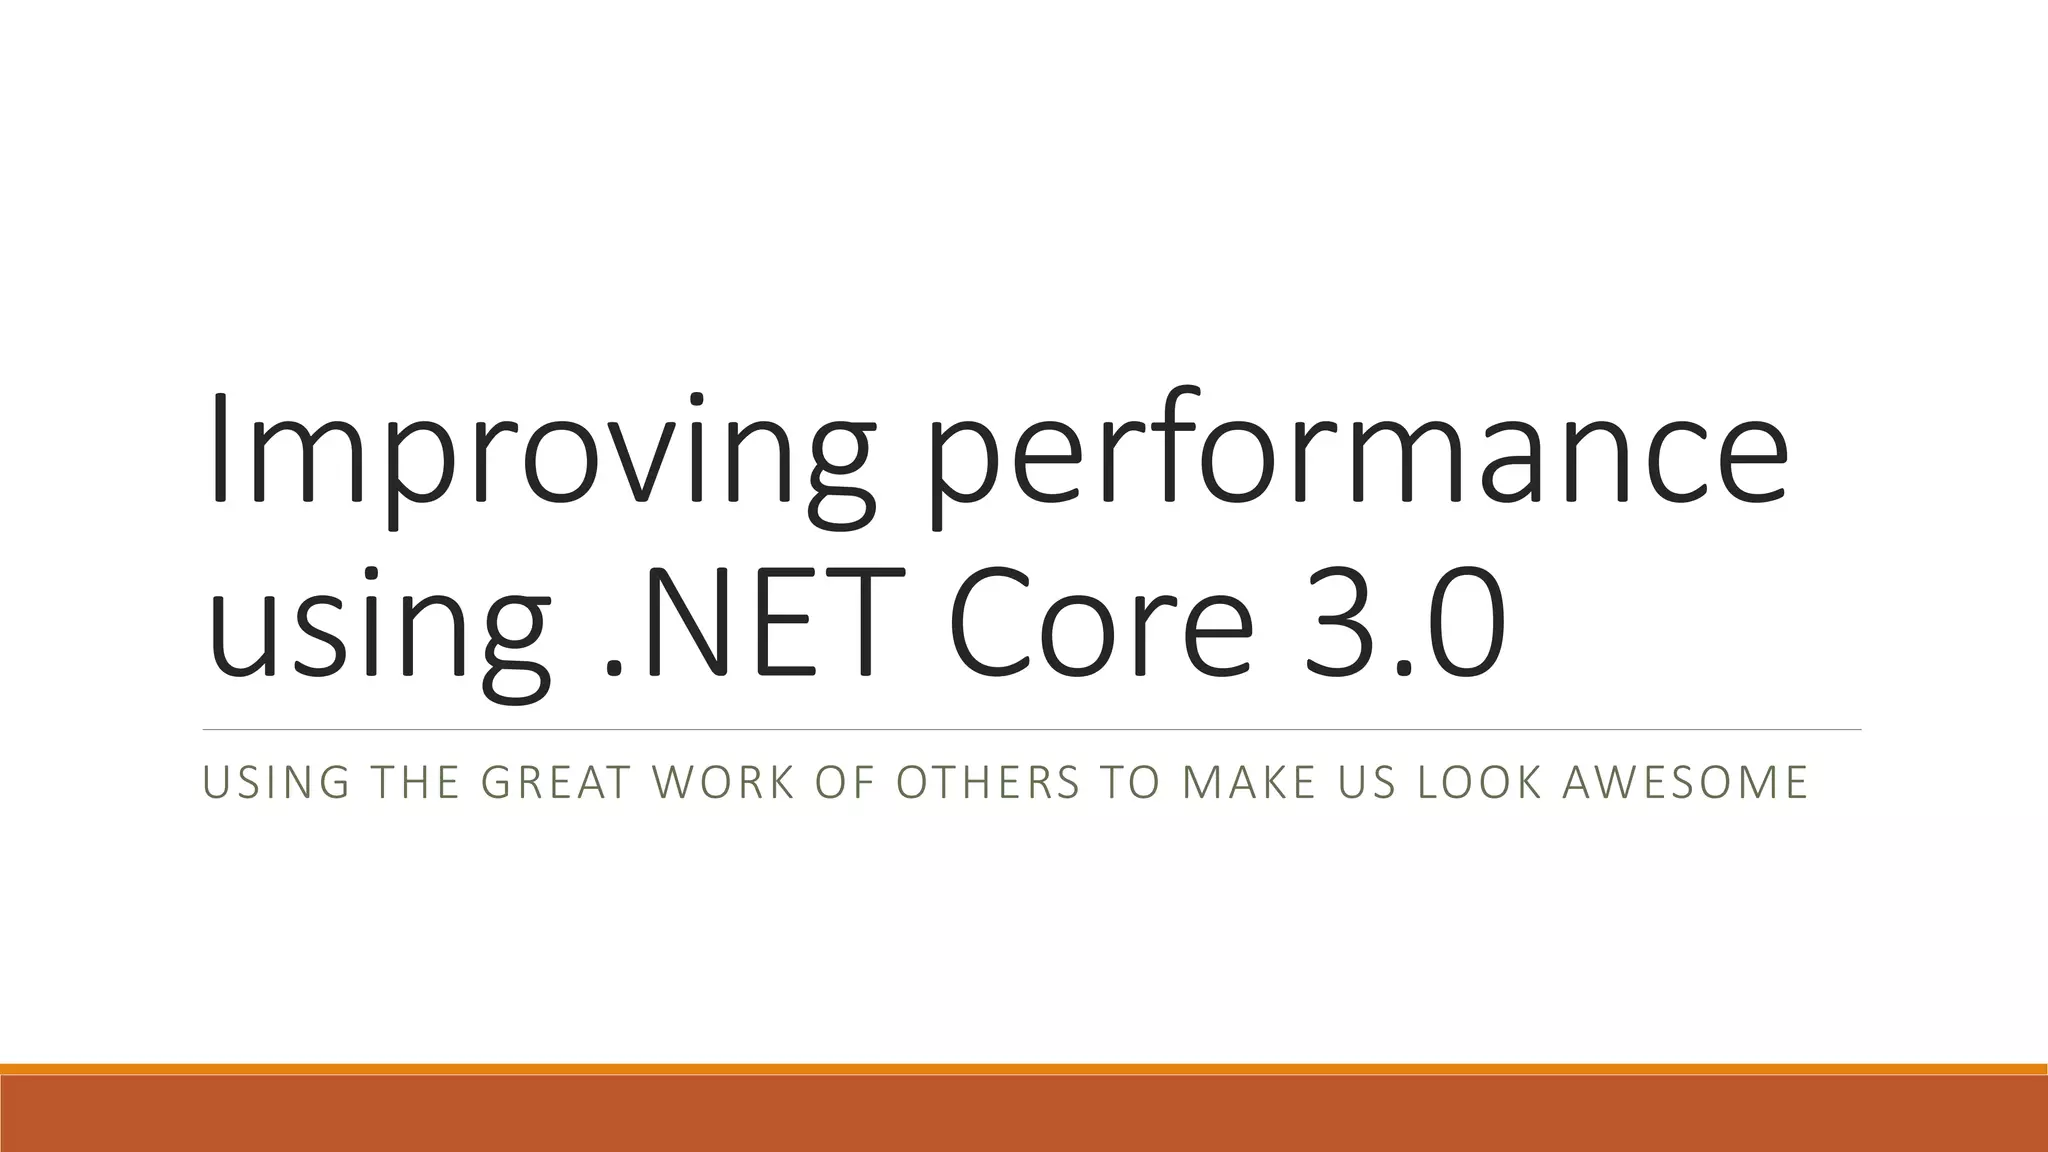
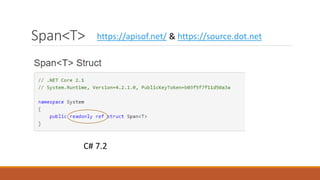
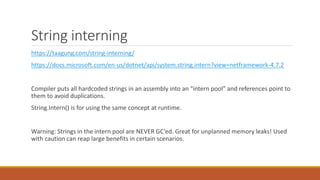
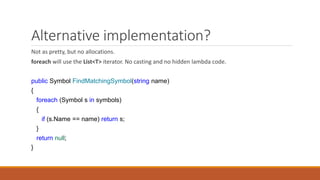
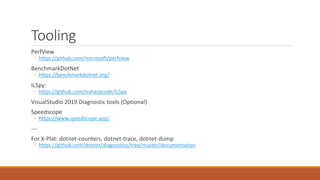
![System.Buffers.ArrayPool
Object pooling pattern - https://www.codeproject.com/articles/20848/c-object-pooling
In .NET Core (System.Buffers) - https://adamsitnik.com/Array-Pool/
var samePool = ArrayPool<byte>.Shared;
byte[] buffer = samePool.Rent(minLength);
try {
Use(buffer);
} finally {
samePool.Return(buffer);
}
Cheaper as soon as you need 1K of memory (or more) – and no allocations required.](https://image.slidesharecdn.com/random-190730213837/85/Improving-app-performance-using-Net-Core-3-0-9-320.jpg)

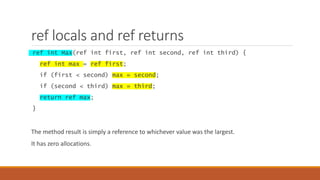
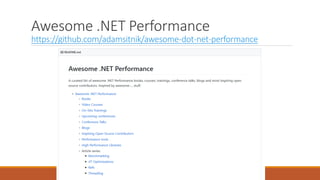
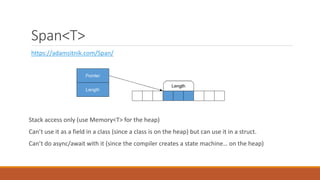
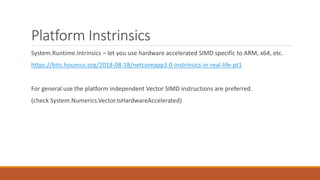
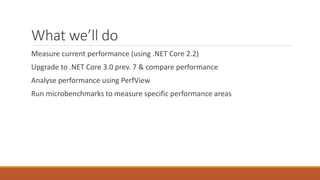
![MemoryMarshal (helps with Spans)
public Span<byte> FloatsToSpanOfBytes() => MemoryMarshal.Cast<float, byte>(arrayOfFloats);
----
[StructLayout(LayoutKind.Explicit)]
public struct Bid {
[FieldOffset(0)] public float Value;
[FieldOffset(4)] public long ProductId;
[FieldOffset(12)] public long UserId;
[FieldOffset(20)] public DateTime Time;
}
…
public Bid Deserialize(ReadOnlySpan<byte> serialized) => MemoryMarshal.Read<Bid>(serialized);](https://image.slidesharecdn.com/random-190730213837/85/Improving-app-performance-using-Net-Core-3-0-16-320.jpg)
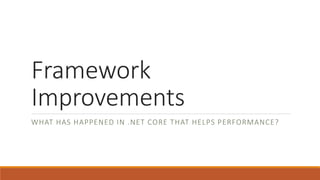
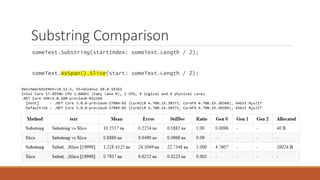
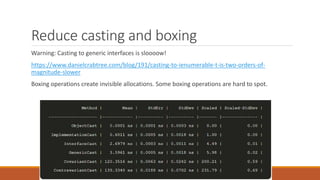
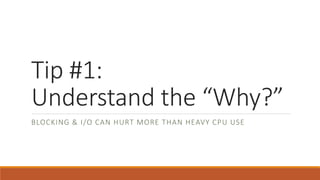
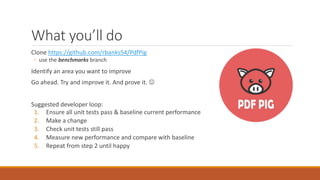
![stackalloc Keyword
Allows you to directly allocate memory on the stack
Don’t overdo it and keep it for short-lived usage
Beware: It’s easy to misuse this and make things worse
Span<byte> bytes = length <= 128 ?
stackalloc byte[length] :
new byte[length];](https://image.slidesharecdn.com/random-190730213837/85/Improving-app-performance-using-Net-Core-3-0-17-320.jpg)


The document discusses performance improvements in .NET Core 3.0, highlighting reduced memory allocations, faster garbage collection, and various enhancements such as the introduction of Span<T> and memory pooling. It emphasizes practical techniques for developers to optimize performance, including string interning, avoiding boxing, and using stackalloc. Additionally, it outlines a performance improvement workflow using tools like PerfView and BenchmarkDotNet for real-world applications, specifically within the context of the PDF library PdfPig.


![[BGOUG] Java GC - Friend or Foe](https://cdn.slidesharecdn.com/ss_thumbnails/javagcfriendorfoe-101125015602-phpapp01-thumbnail.jpg?width=640&height=640&fit=bounds)