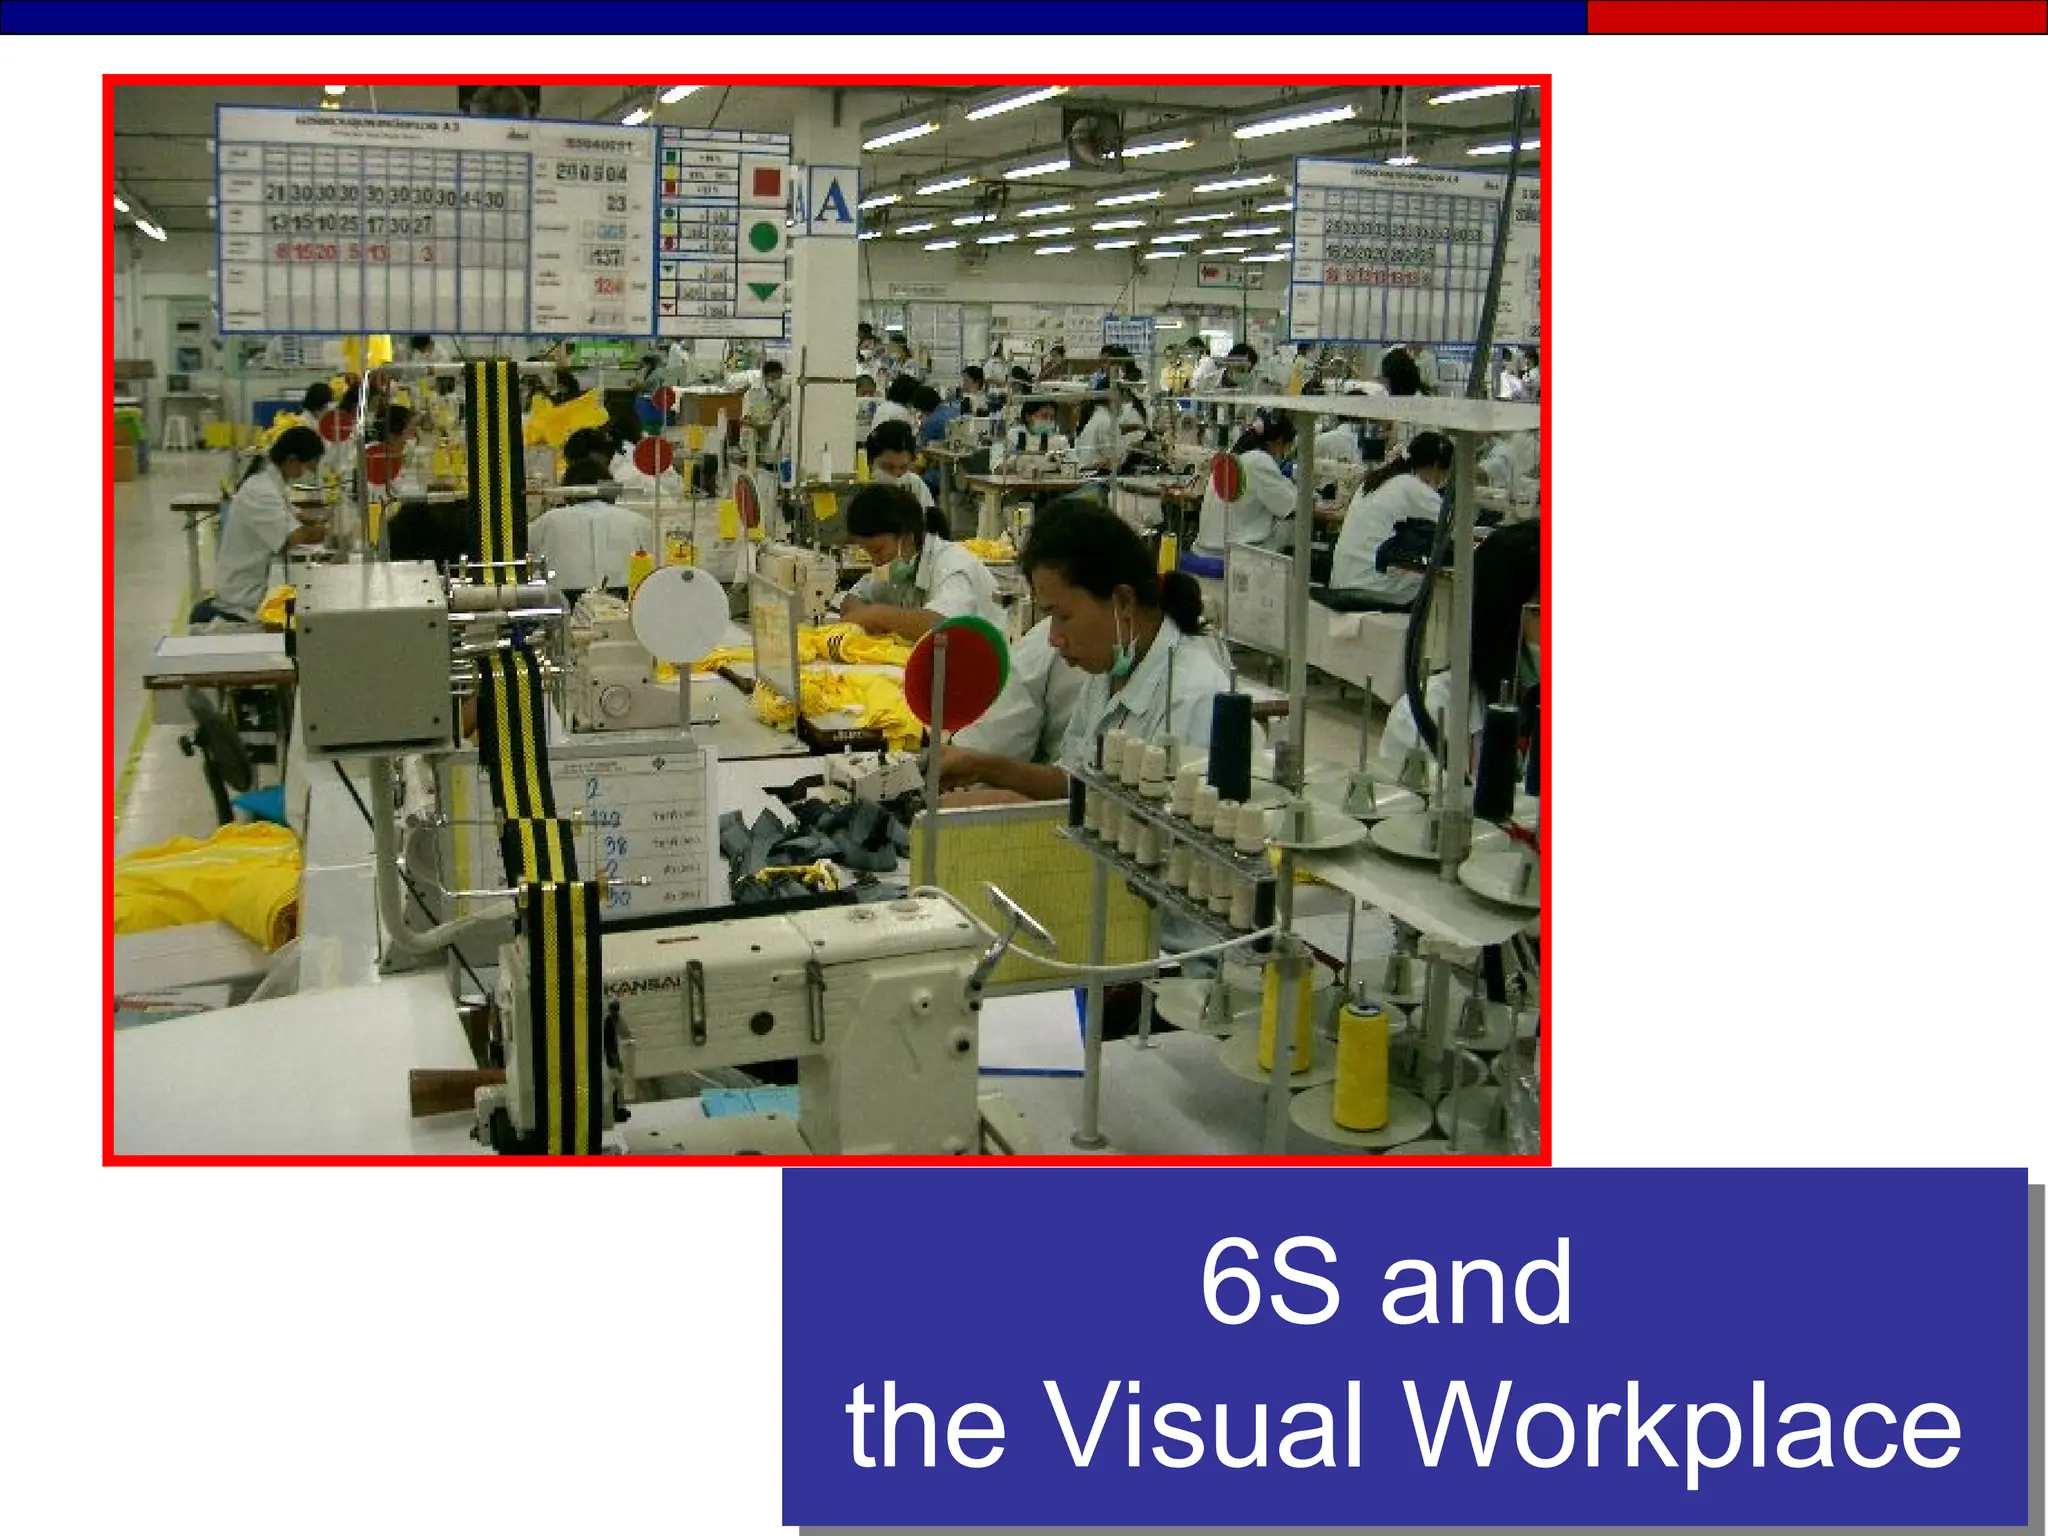
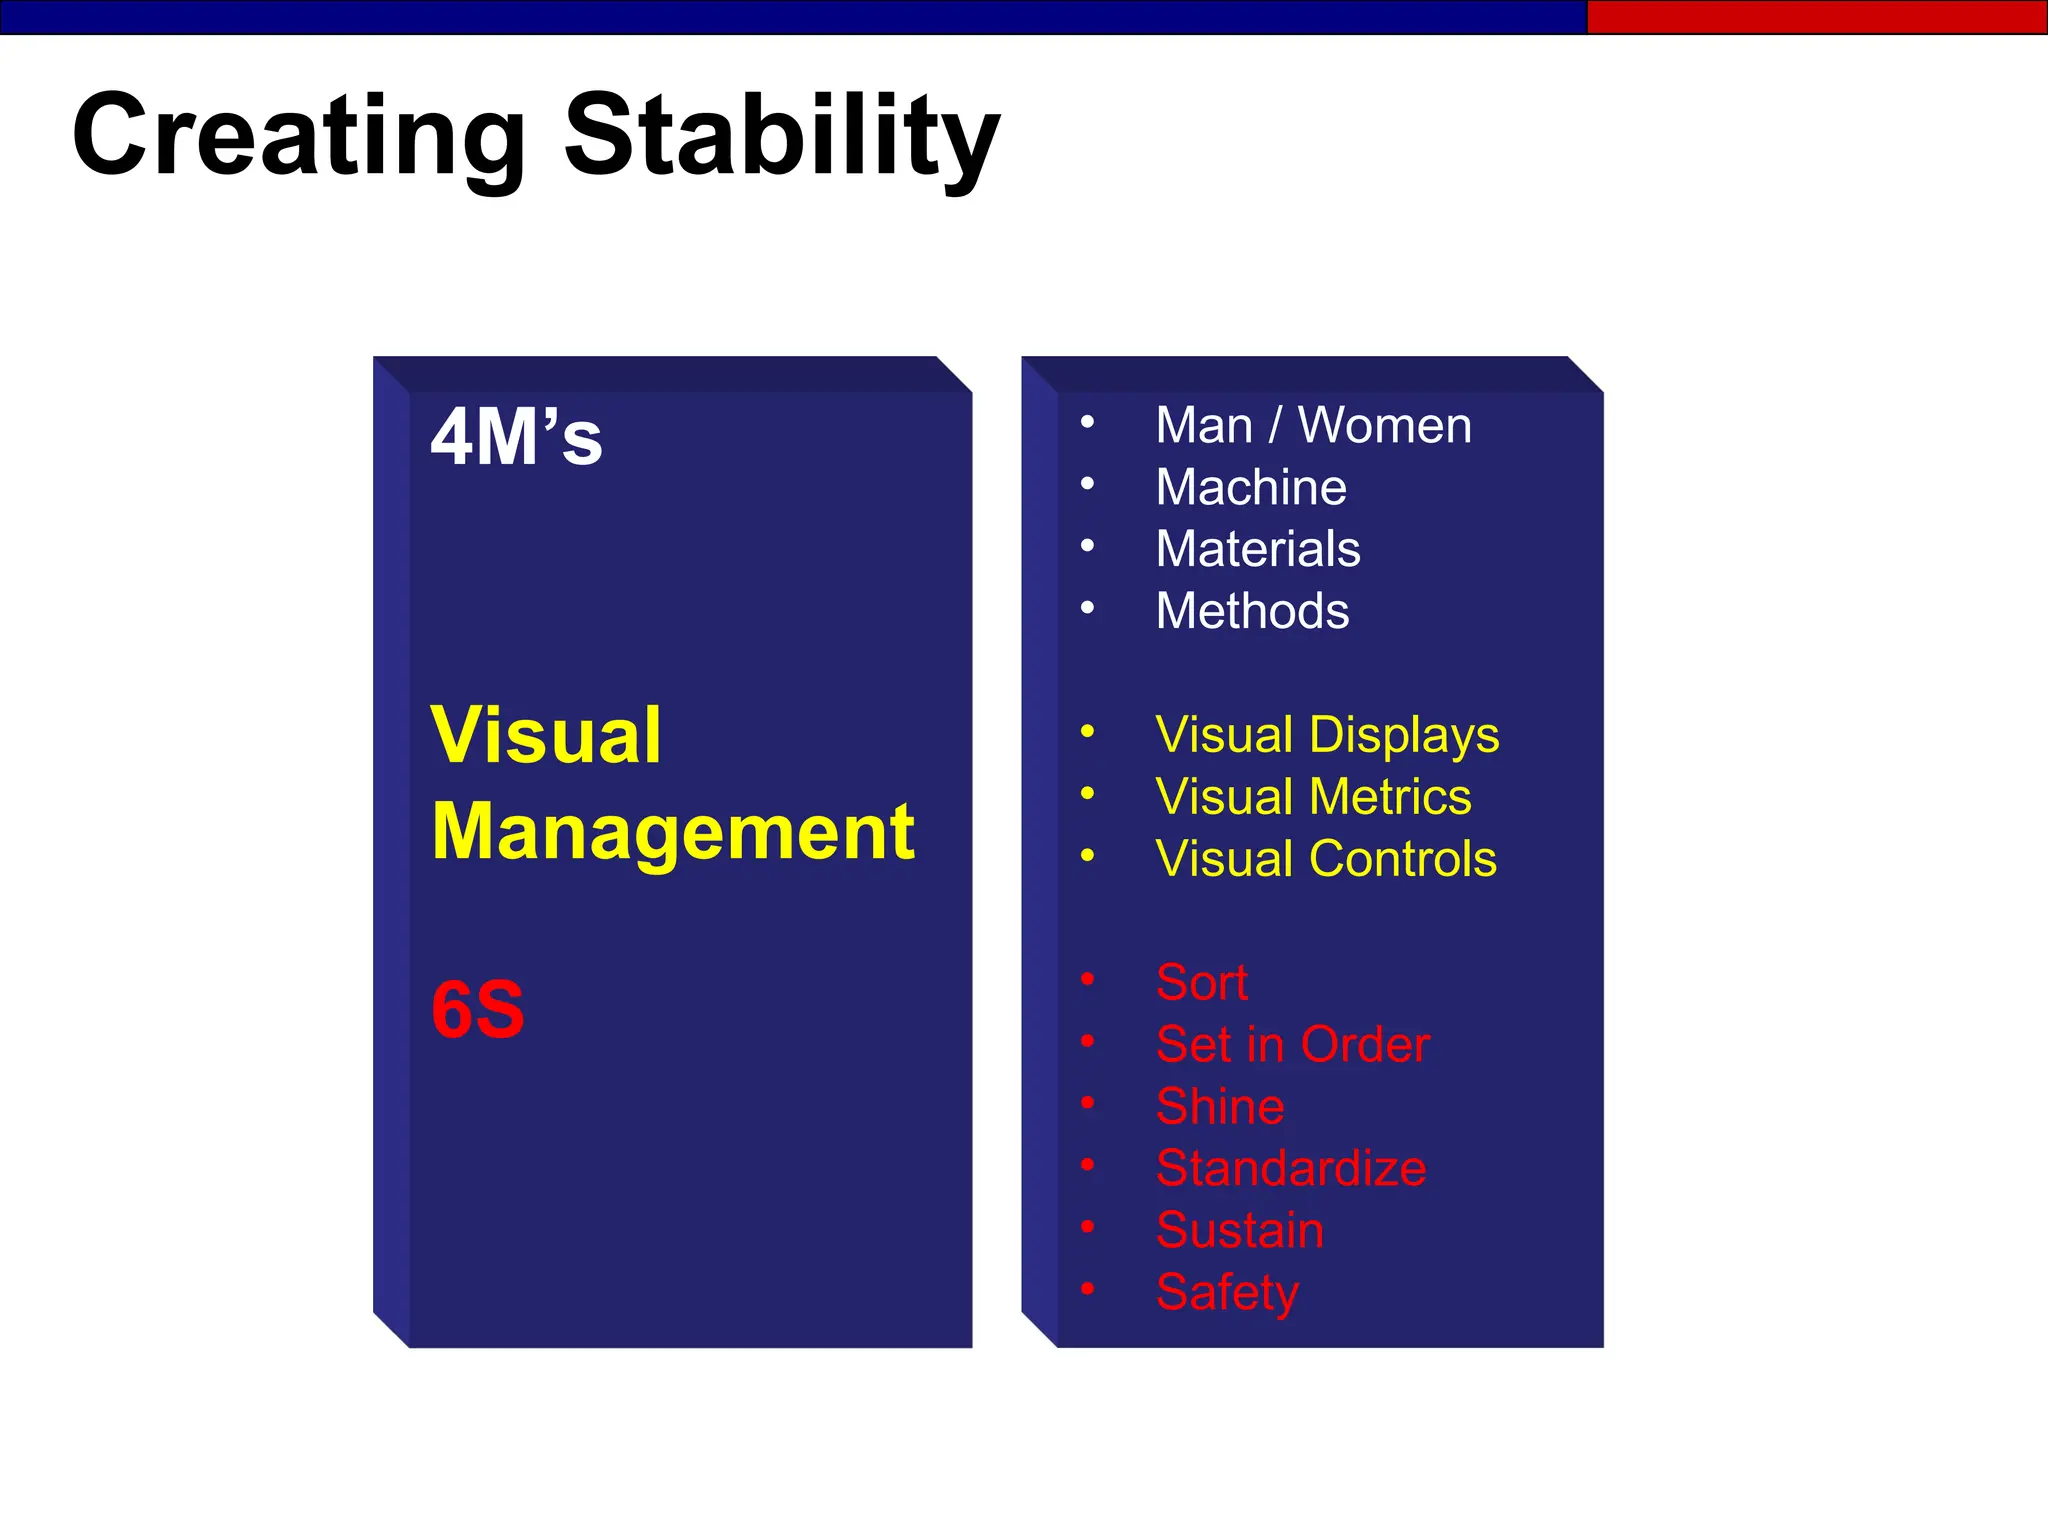
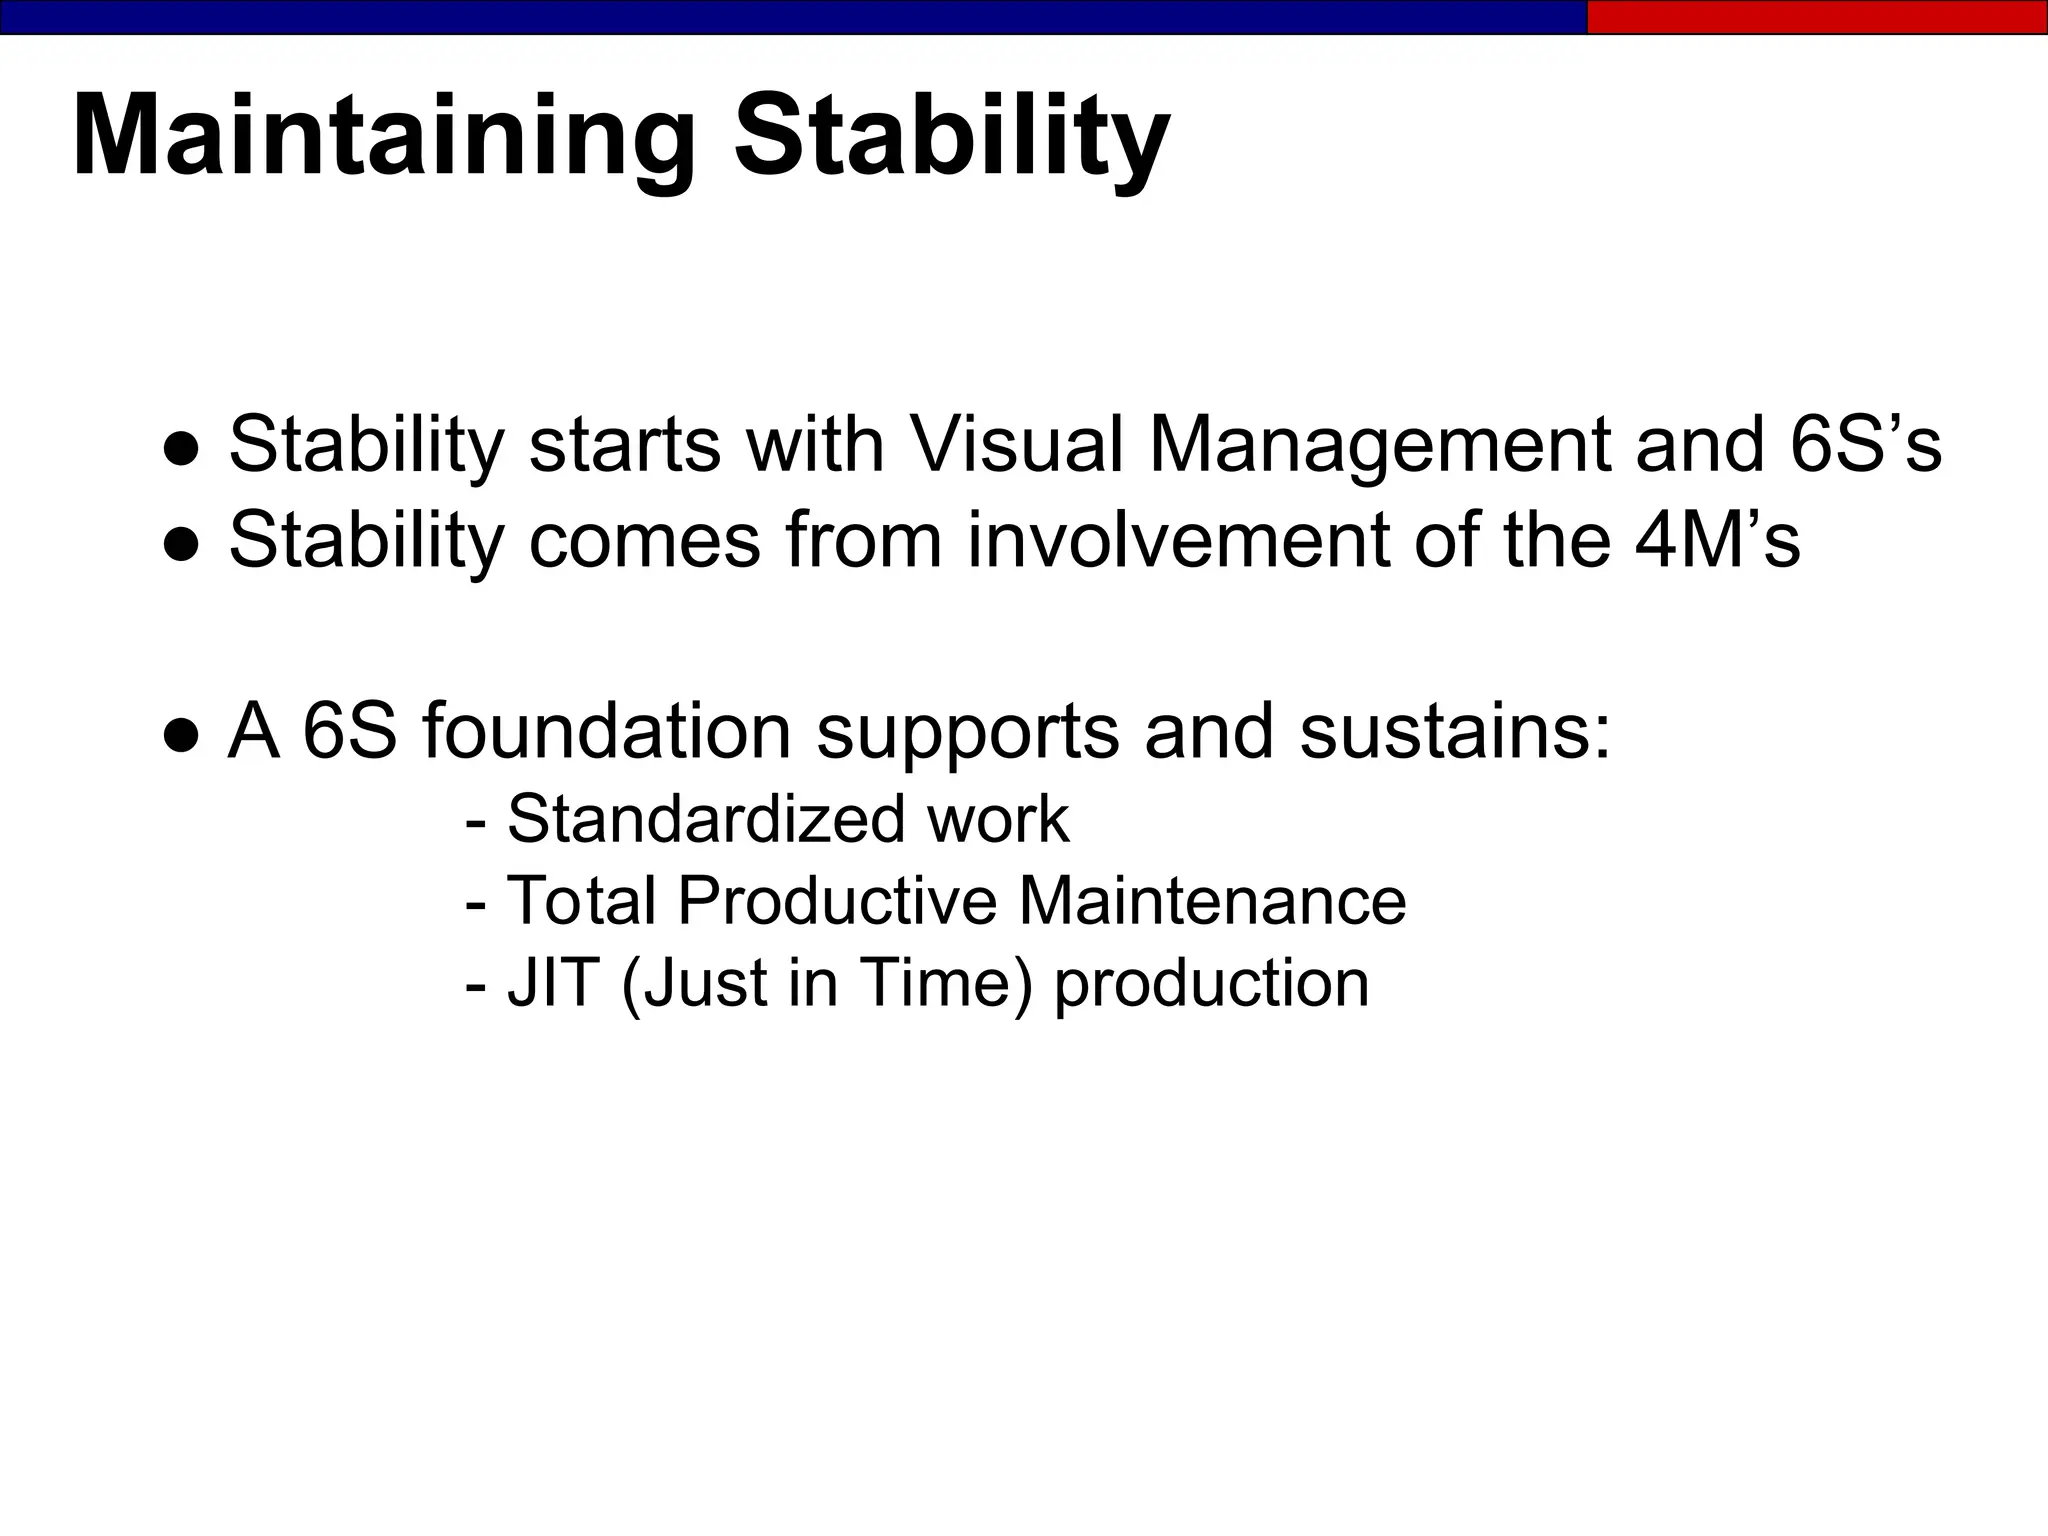
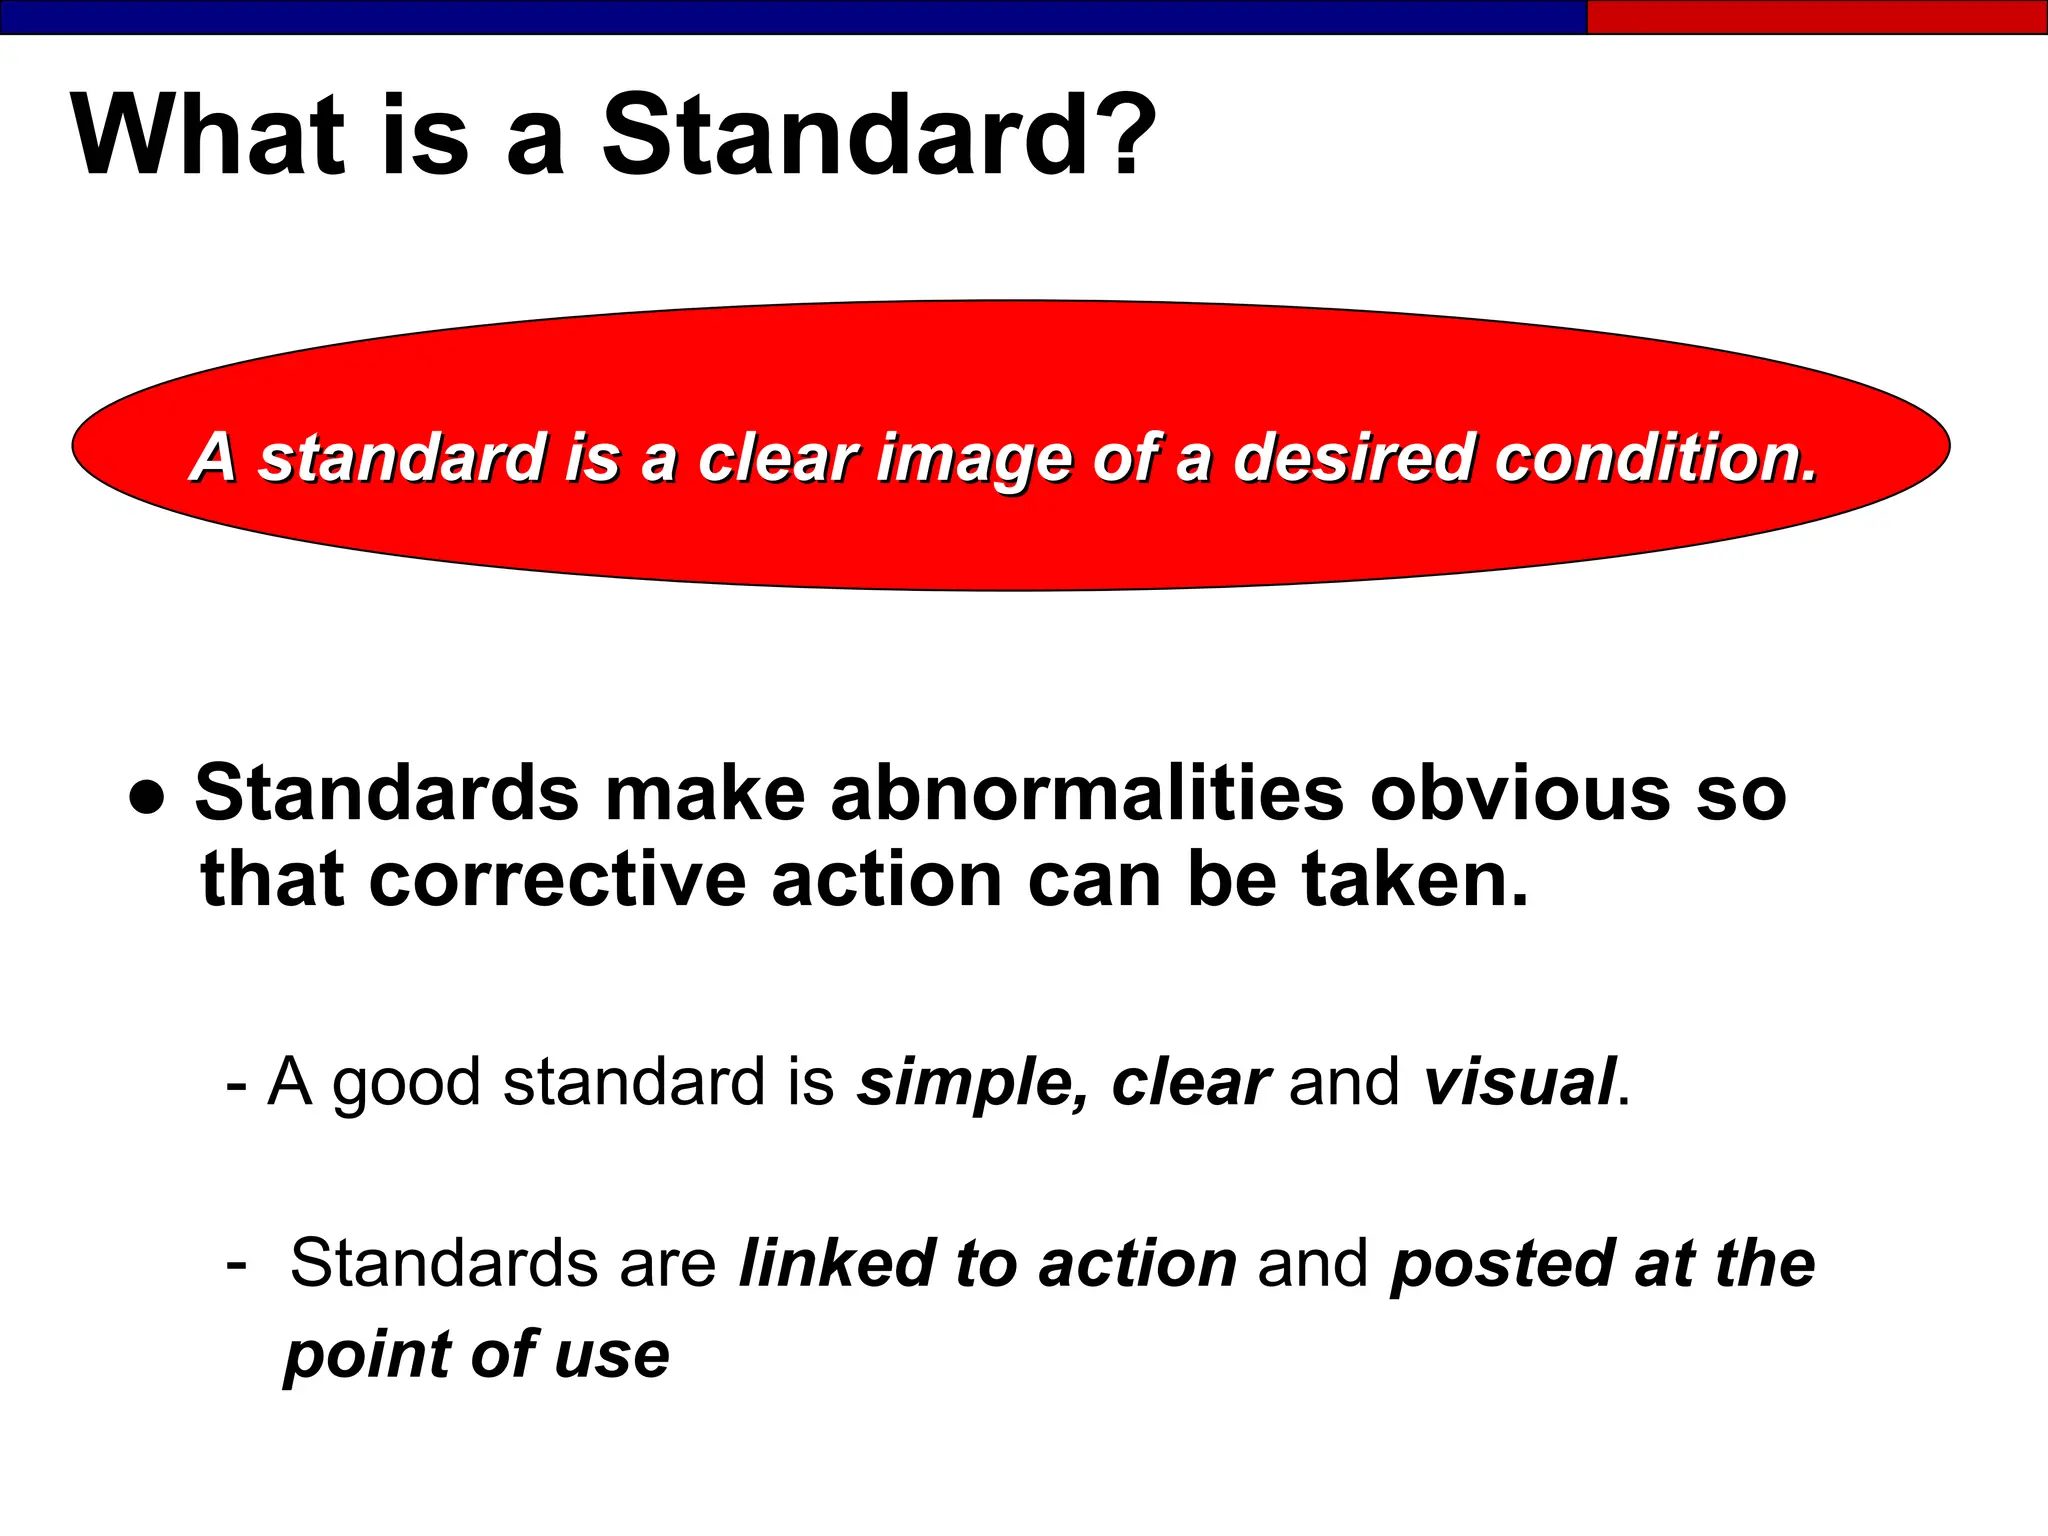
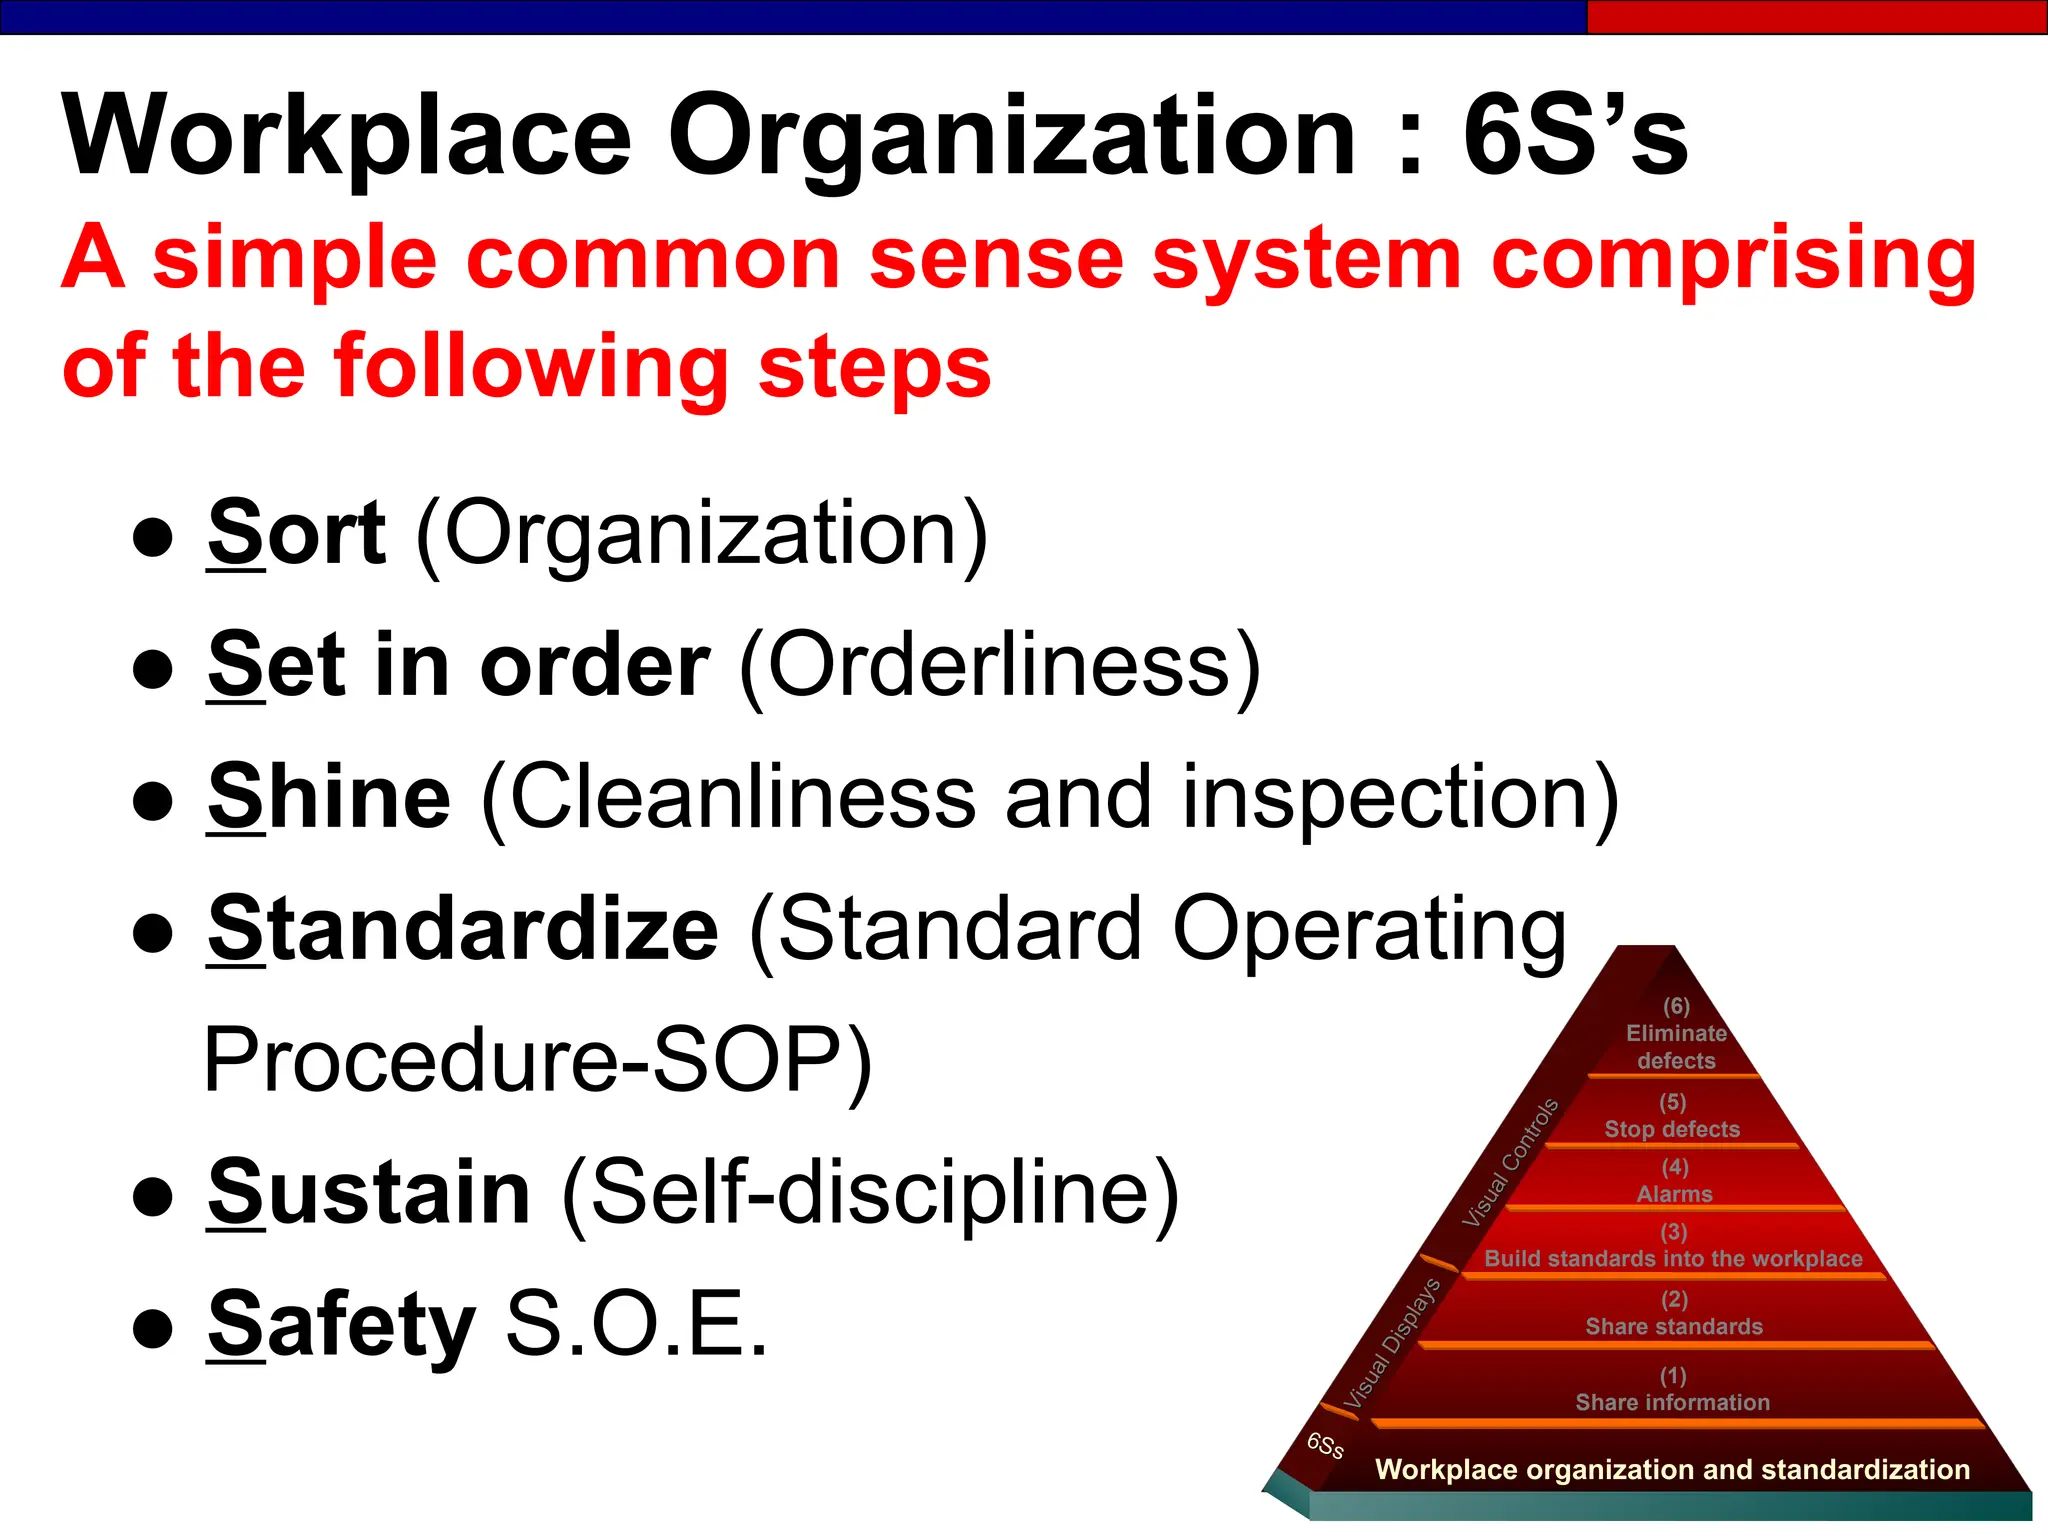
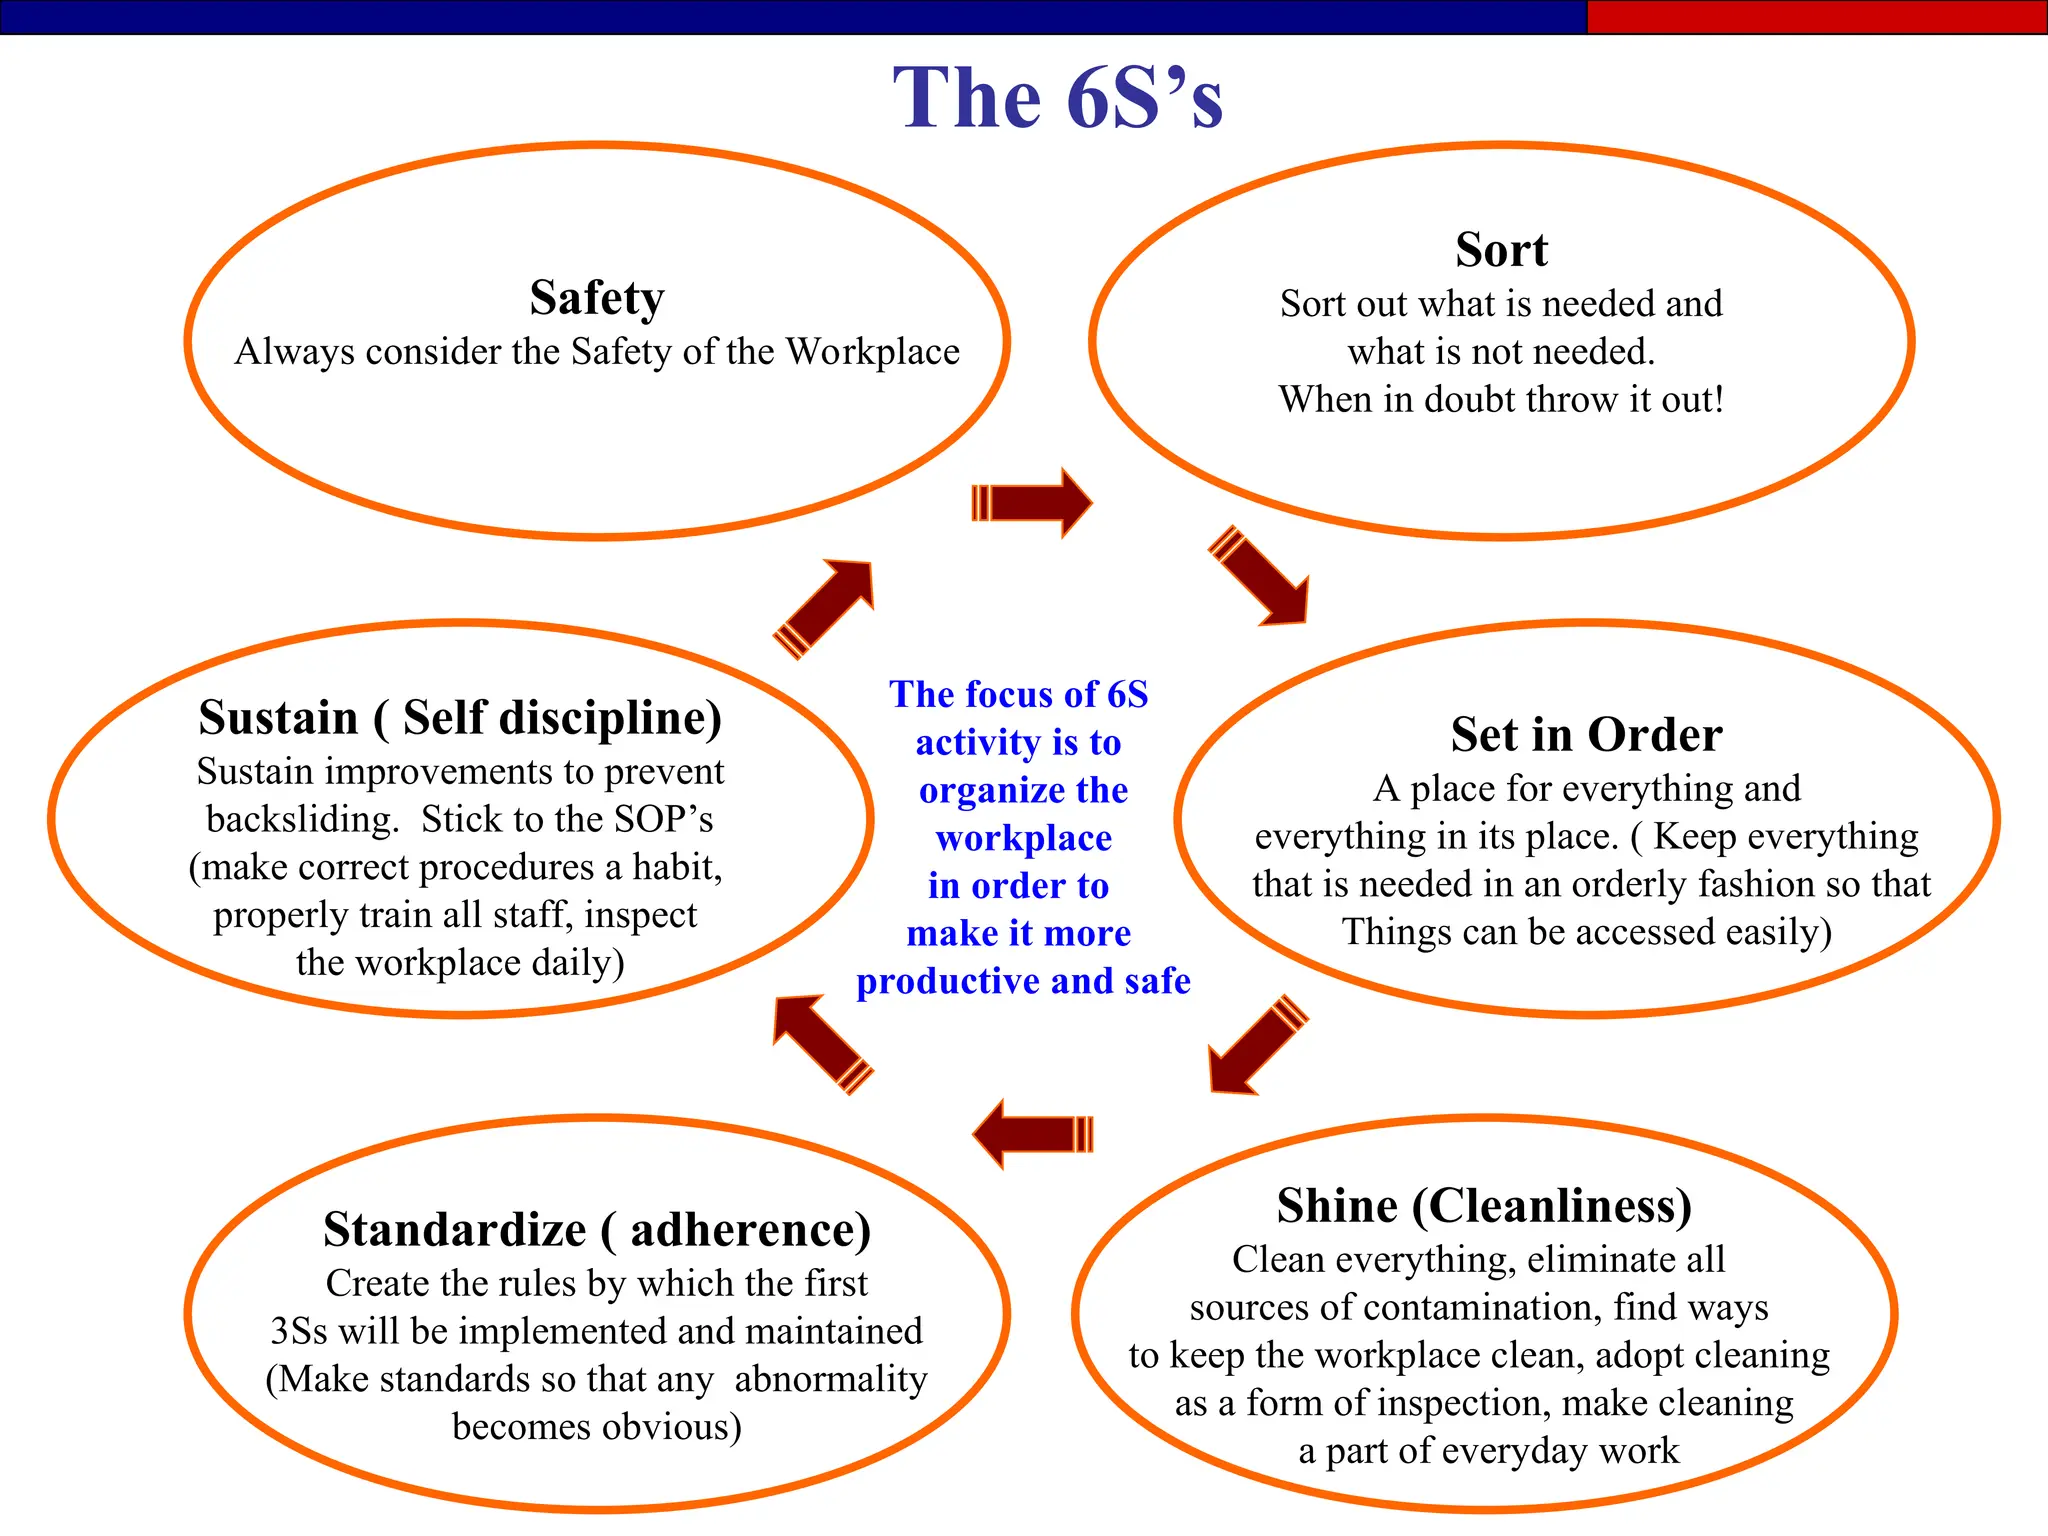
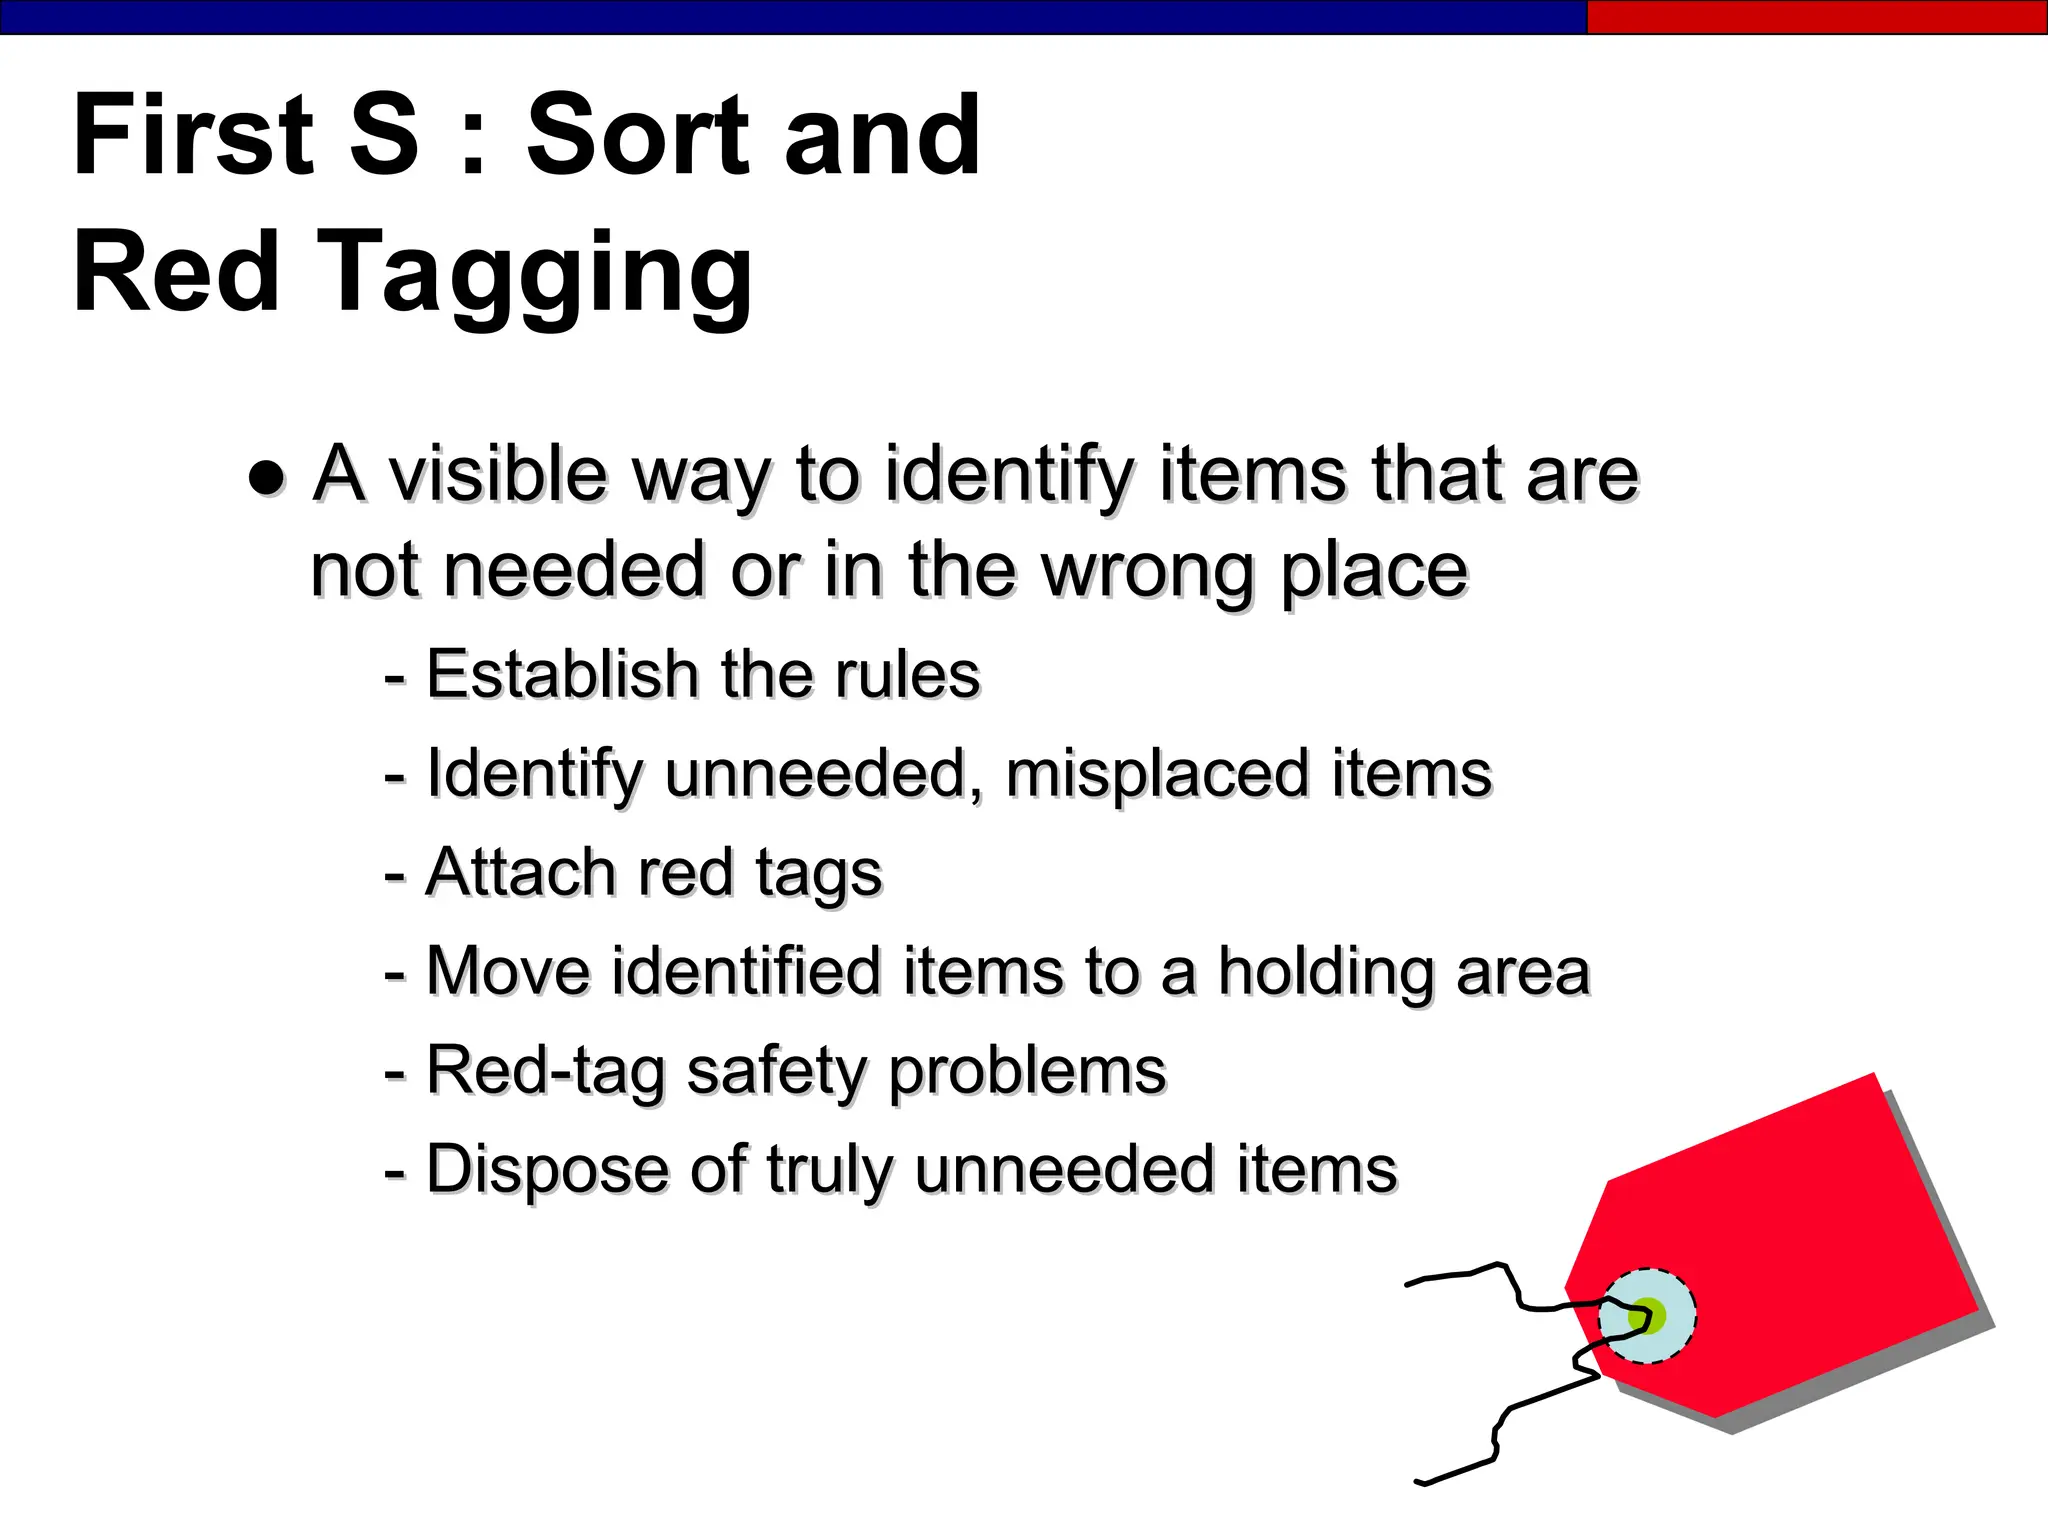
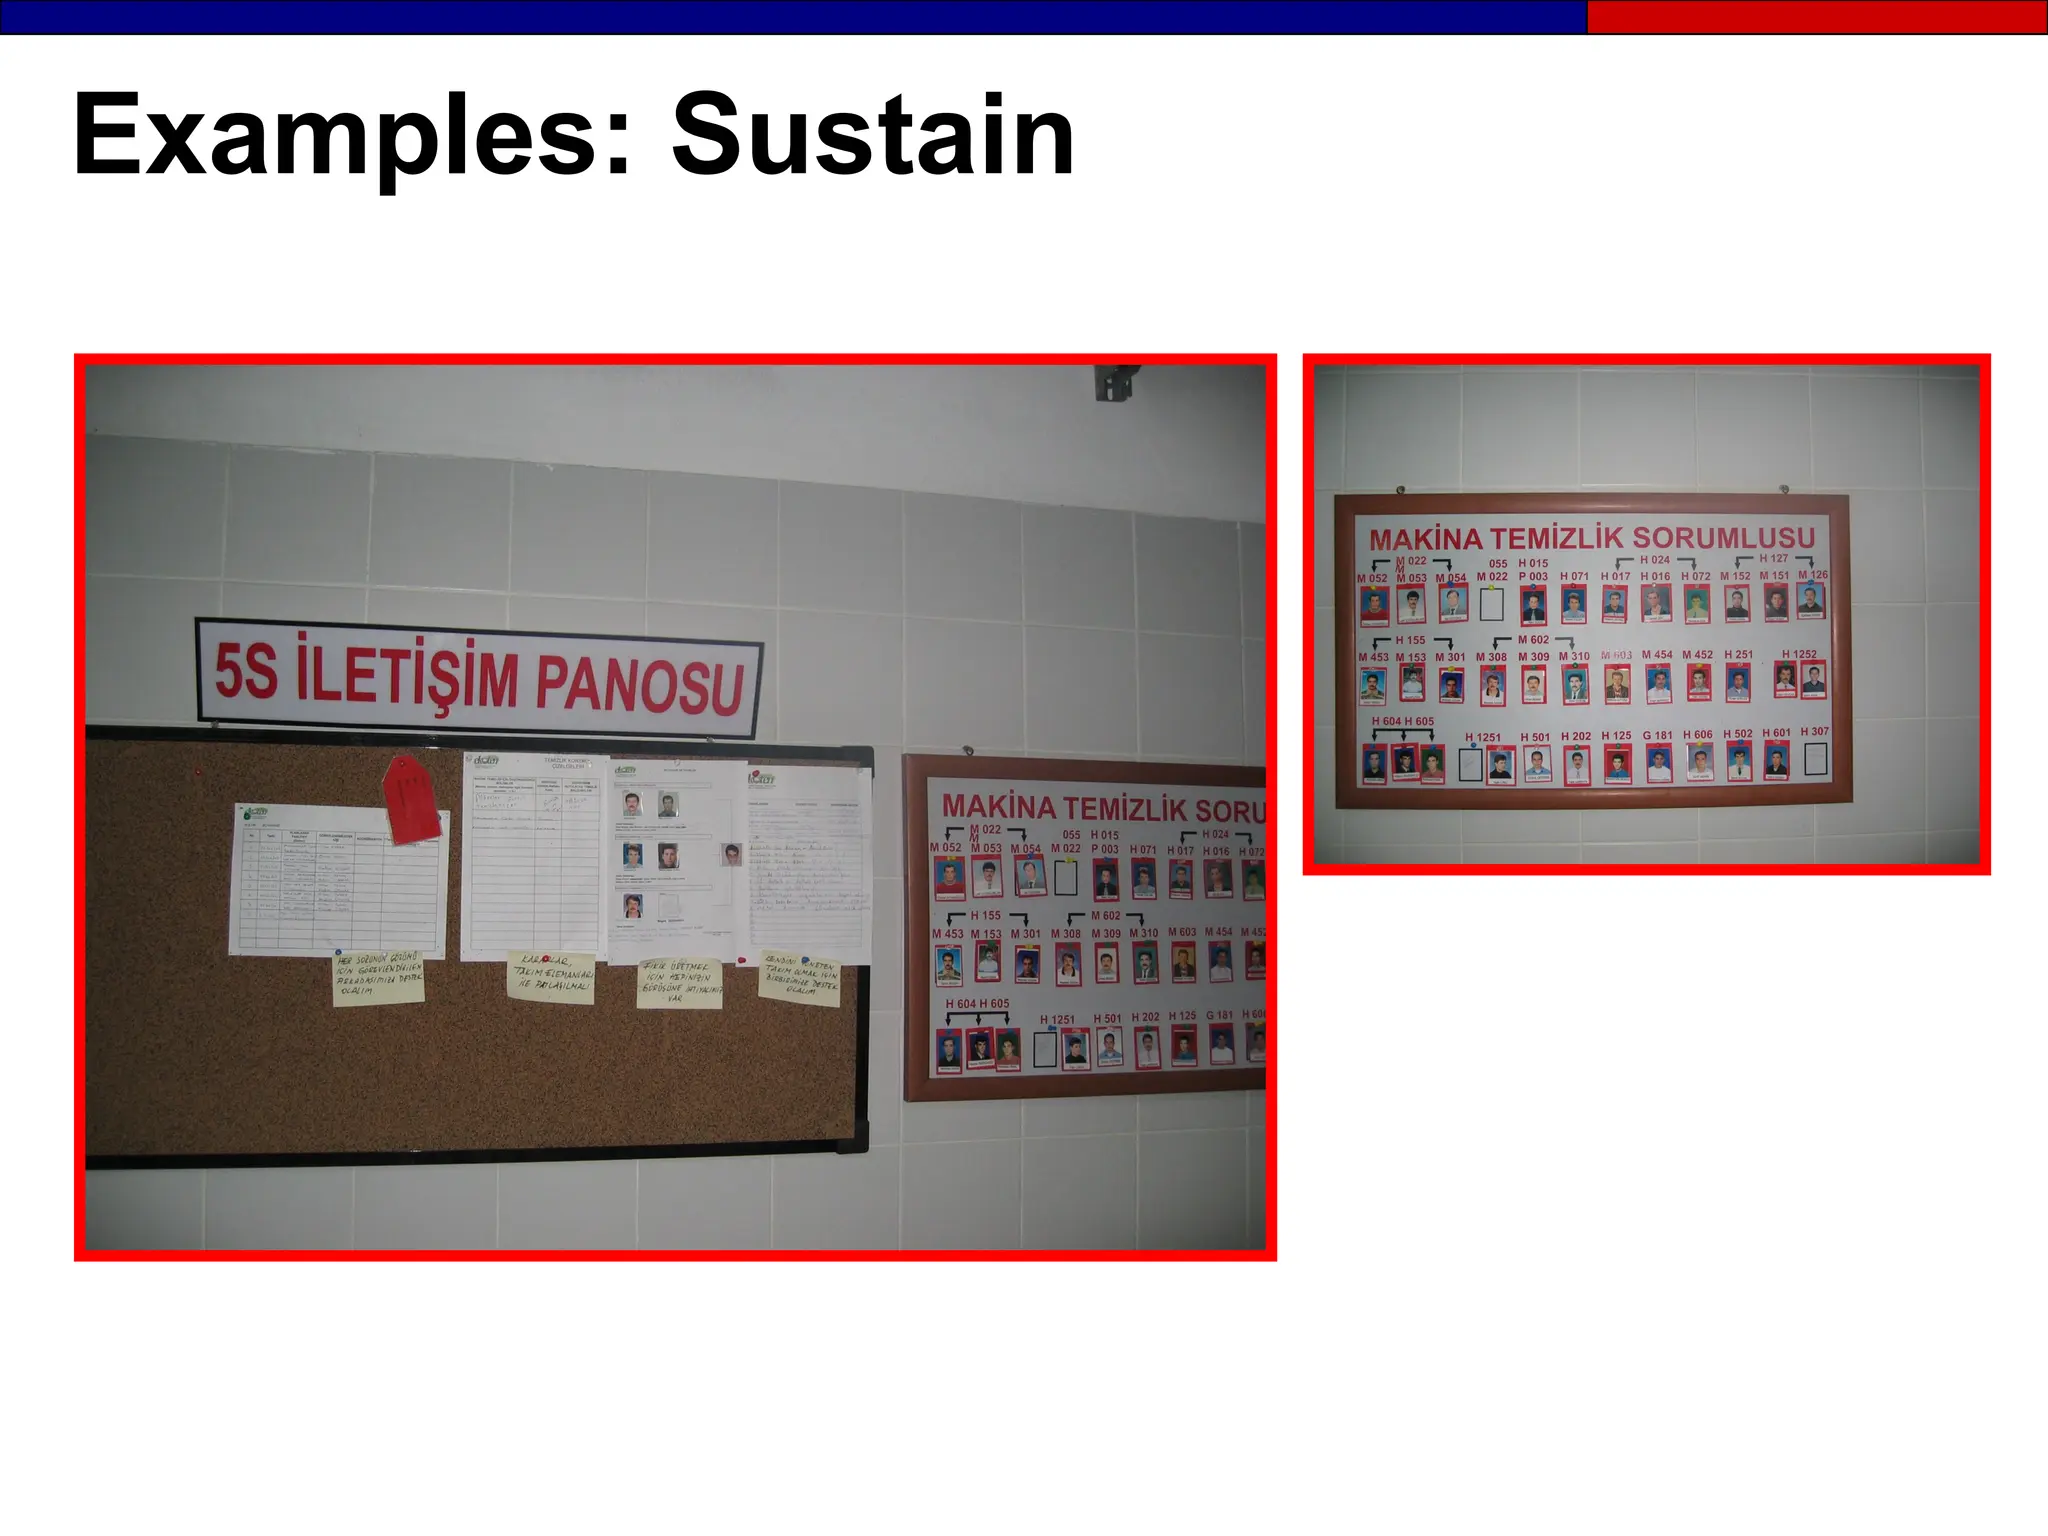
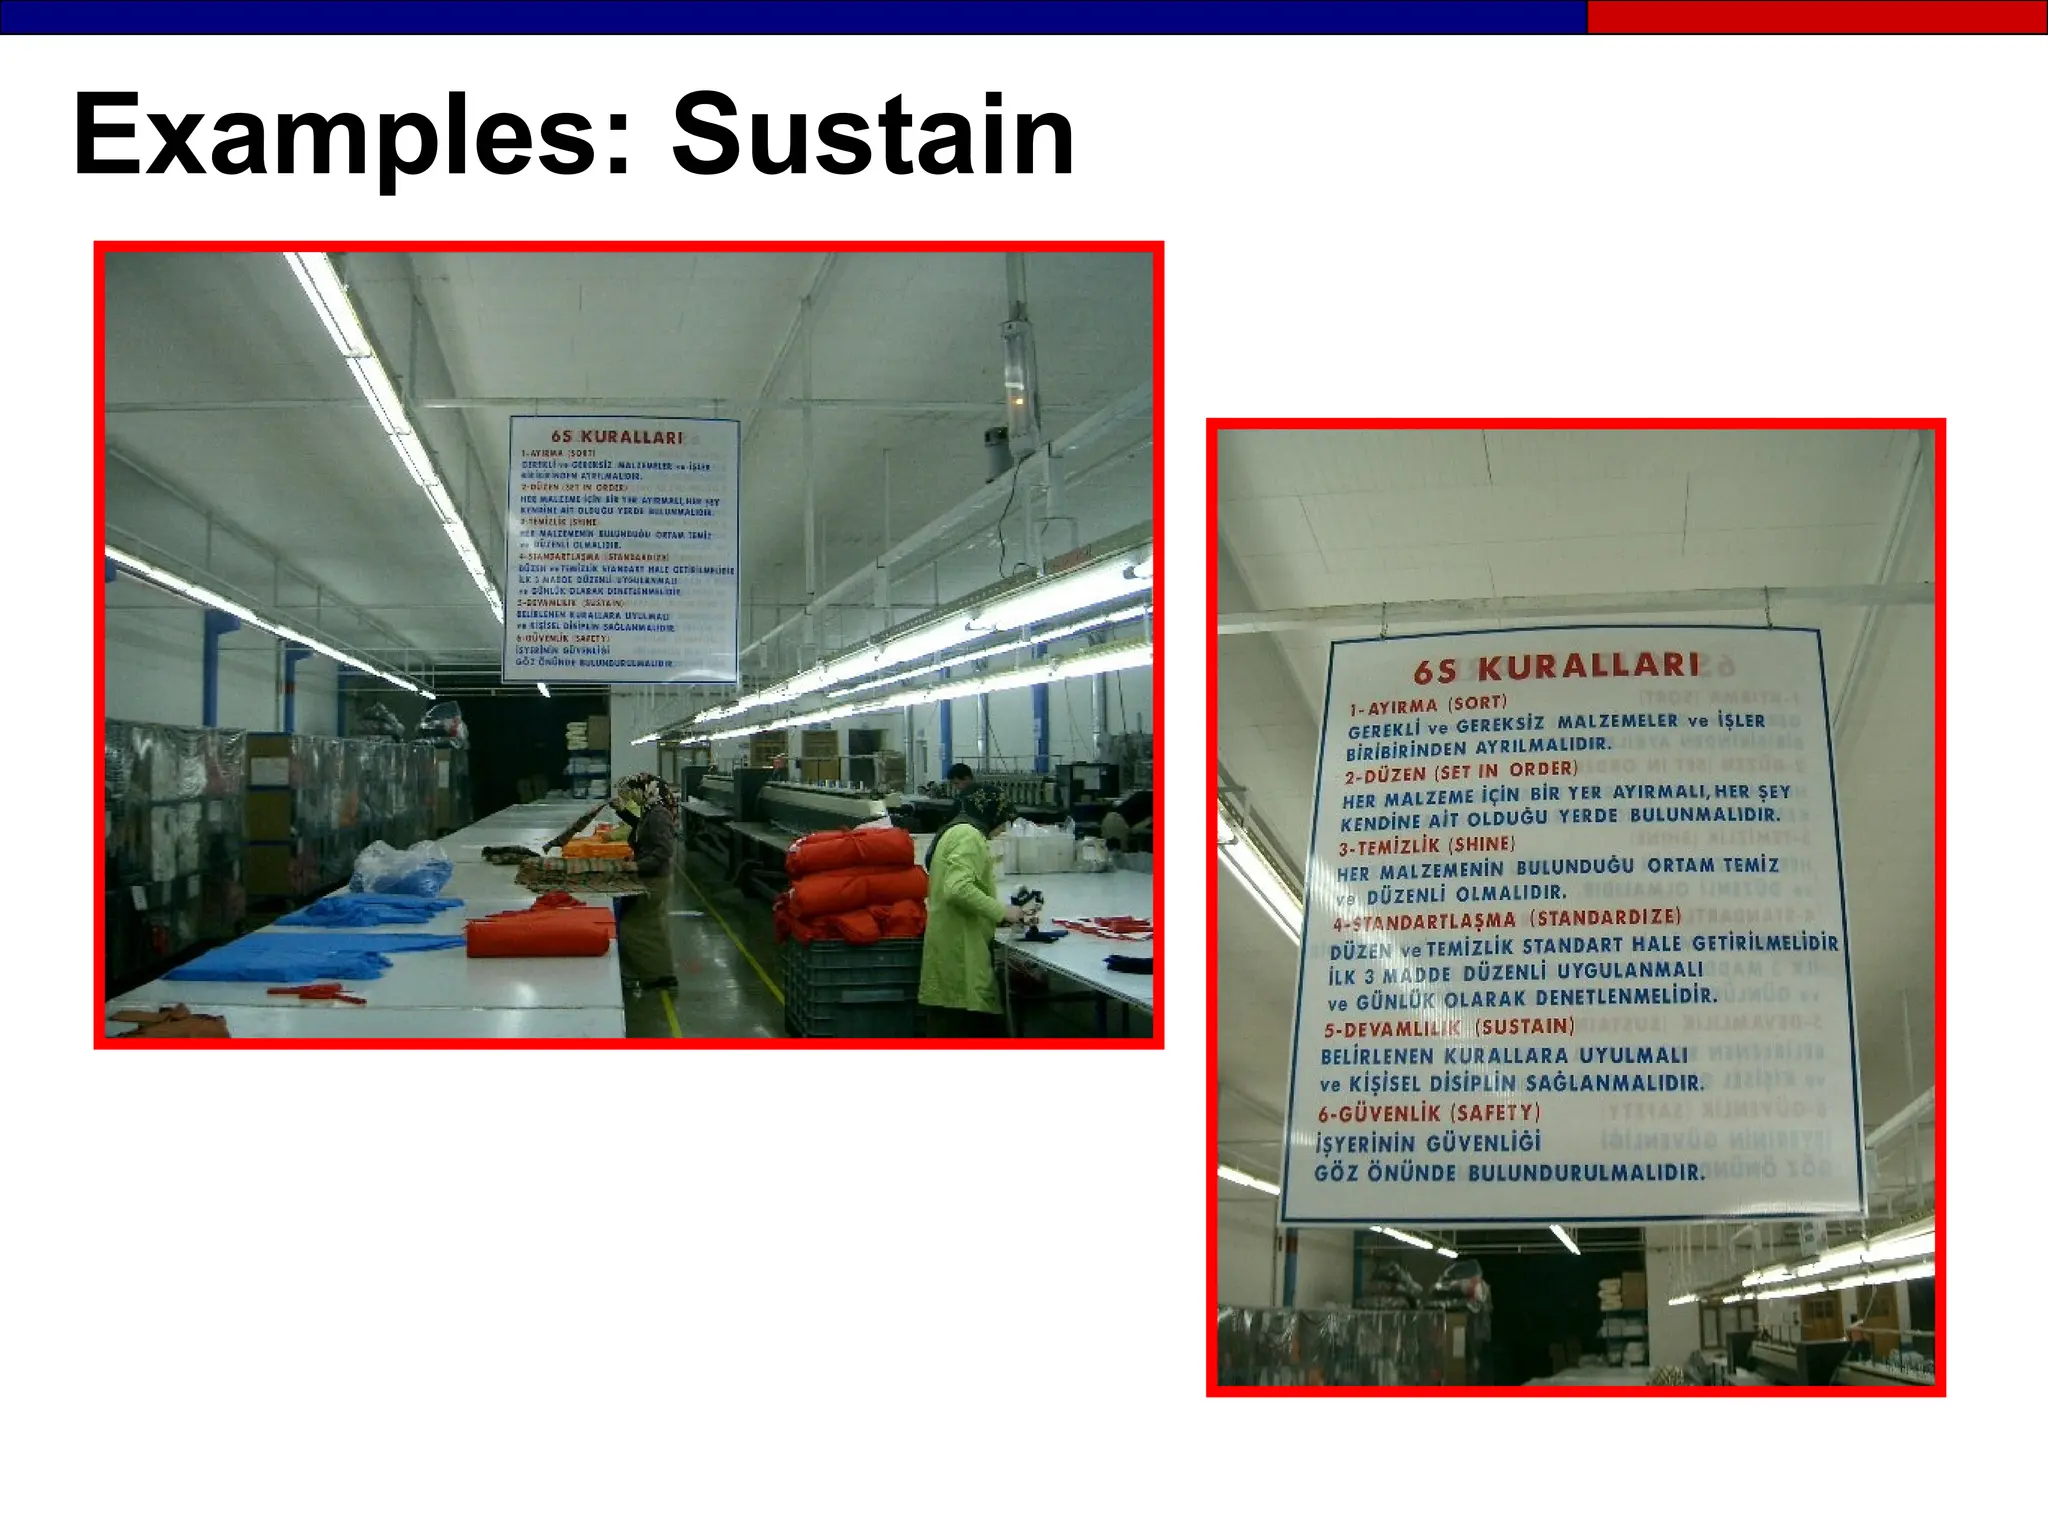
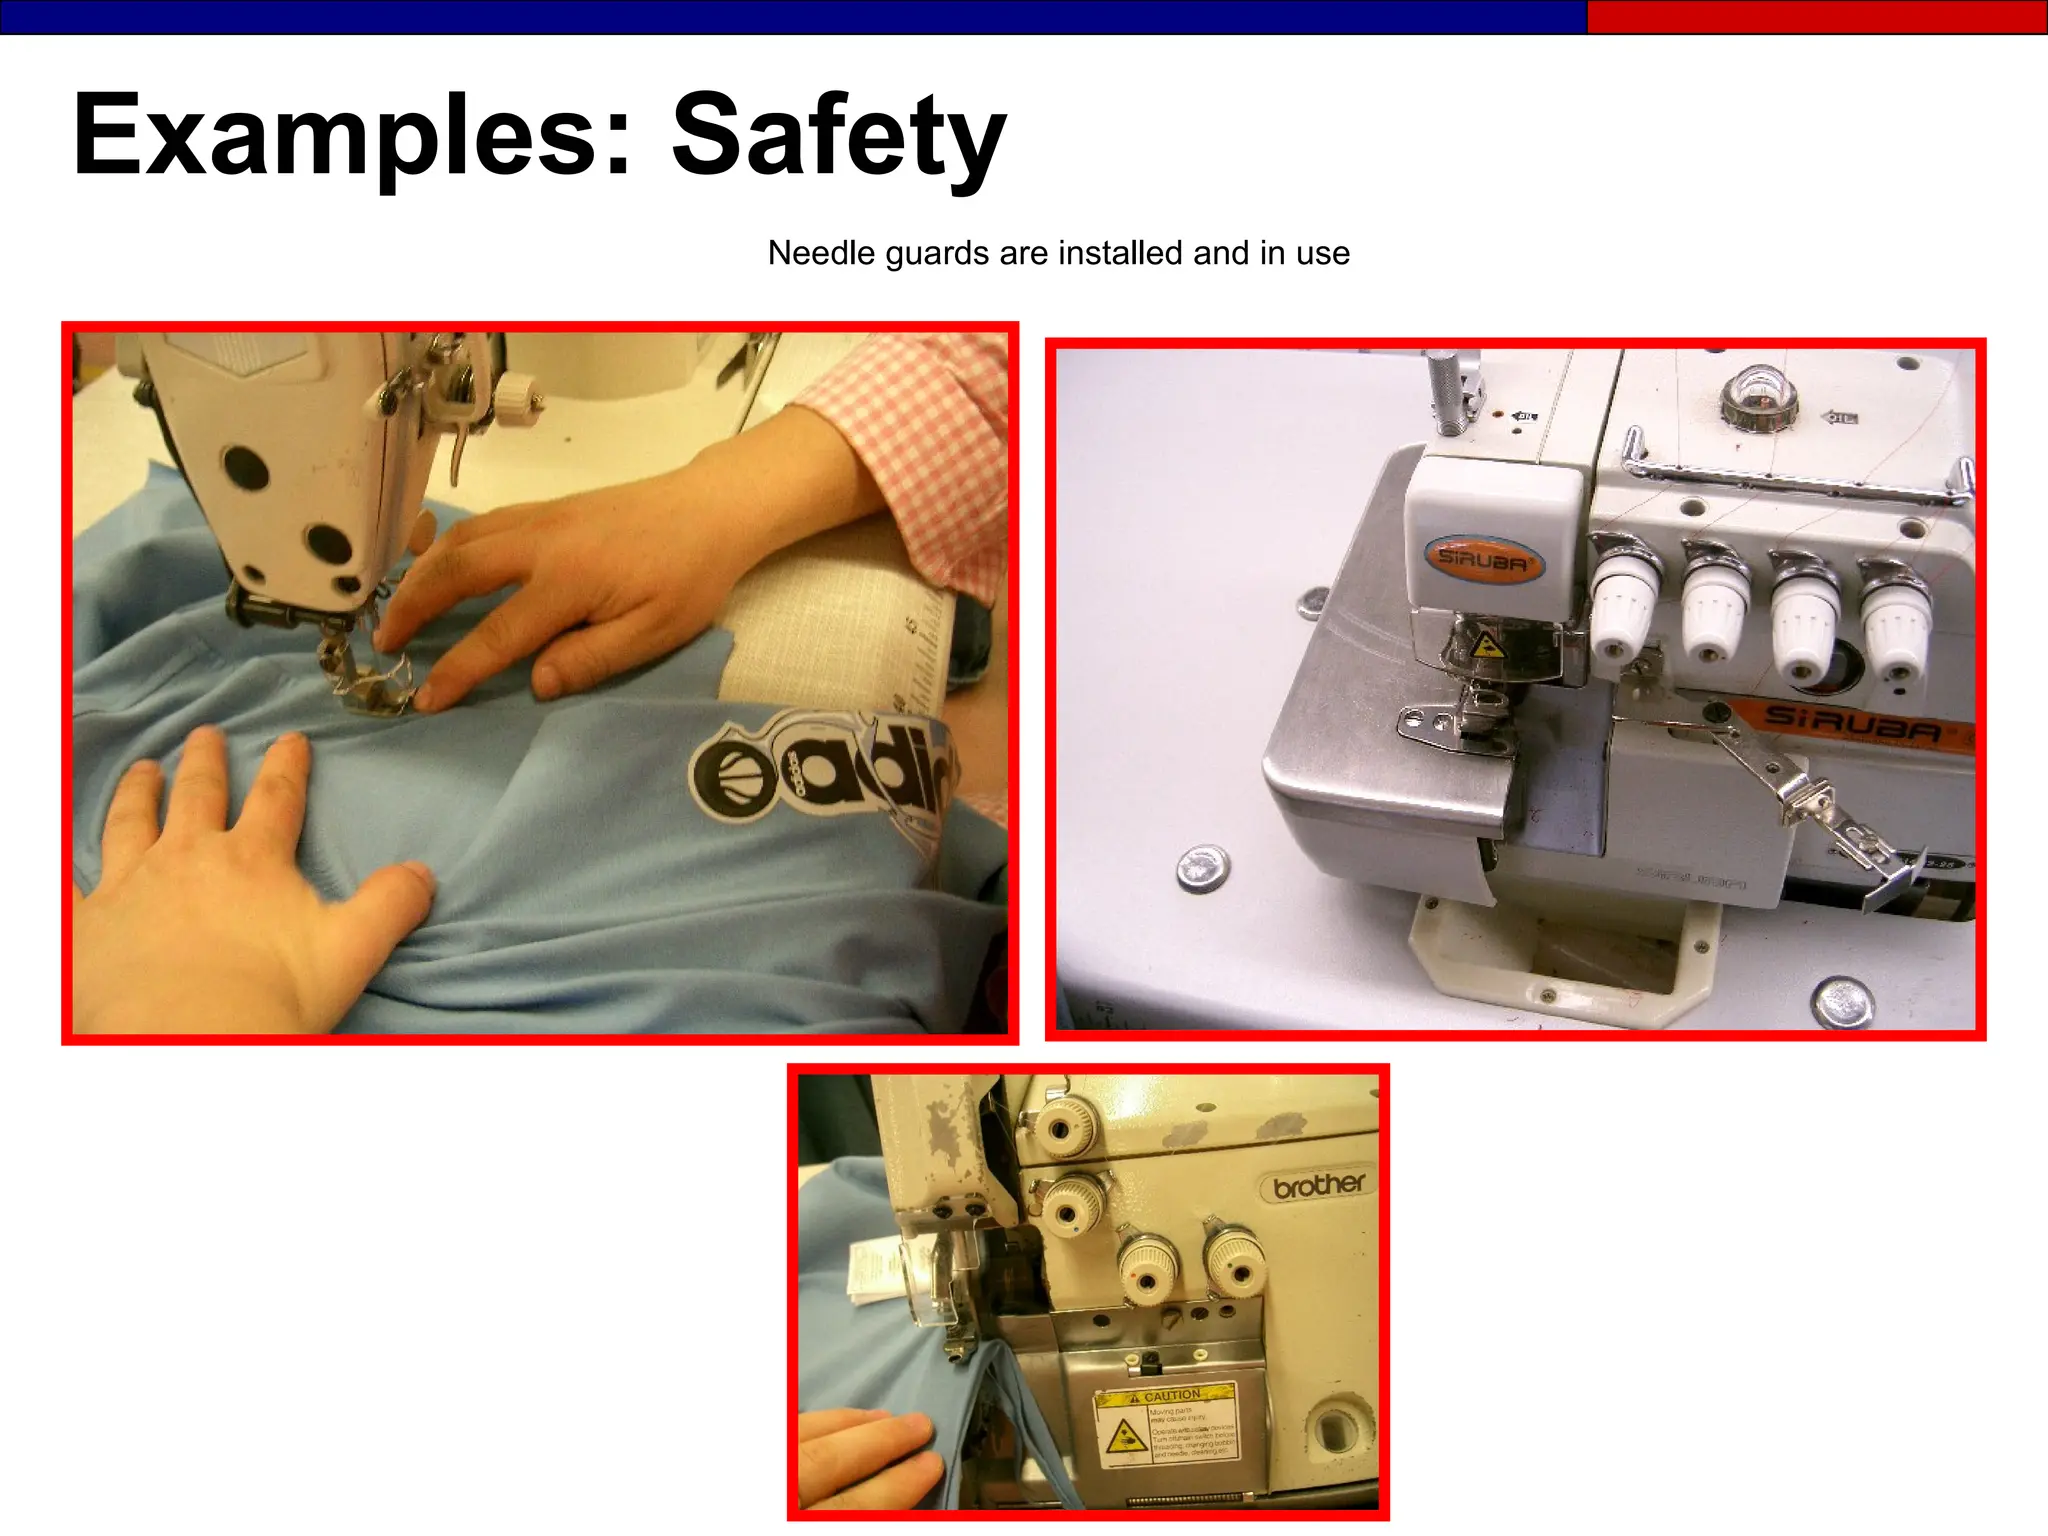
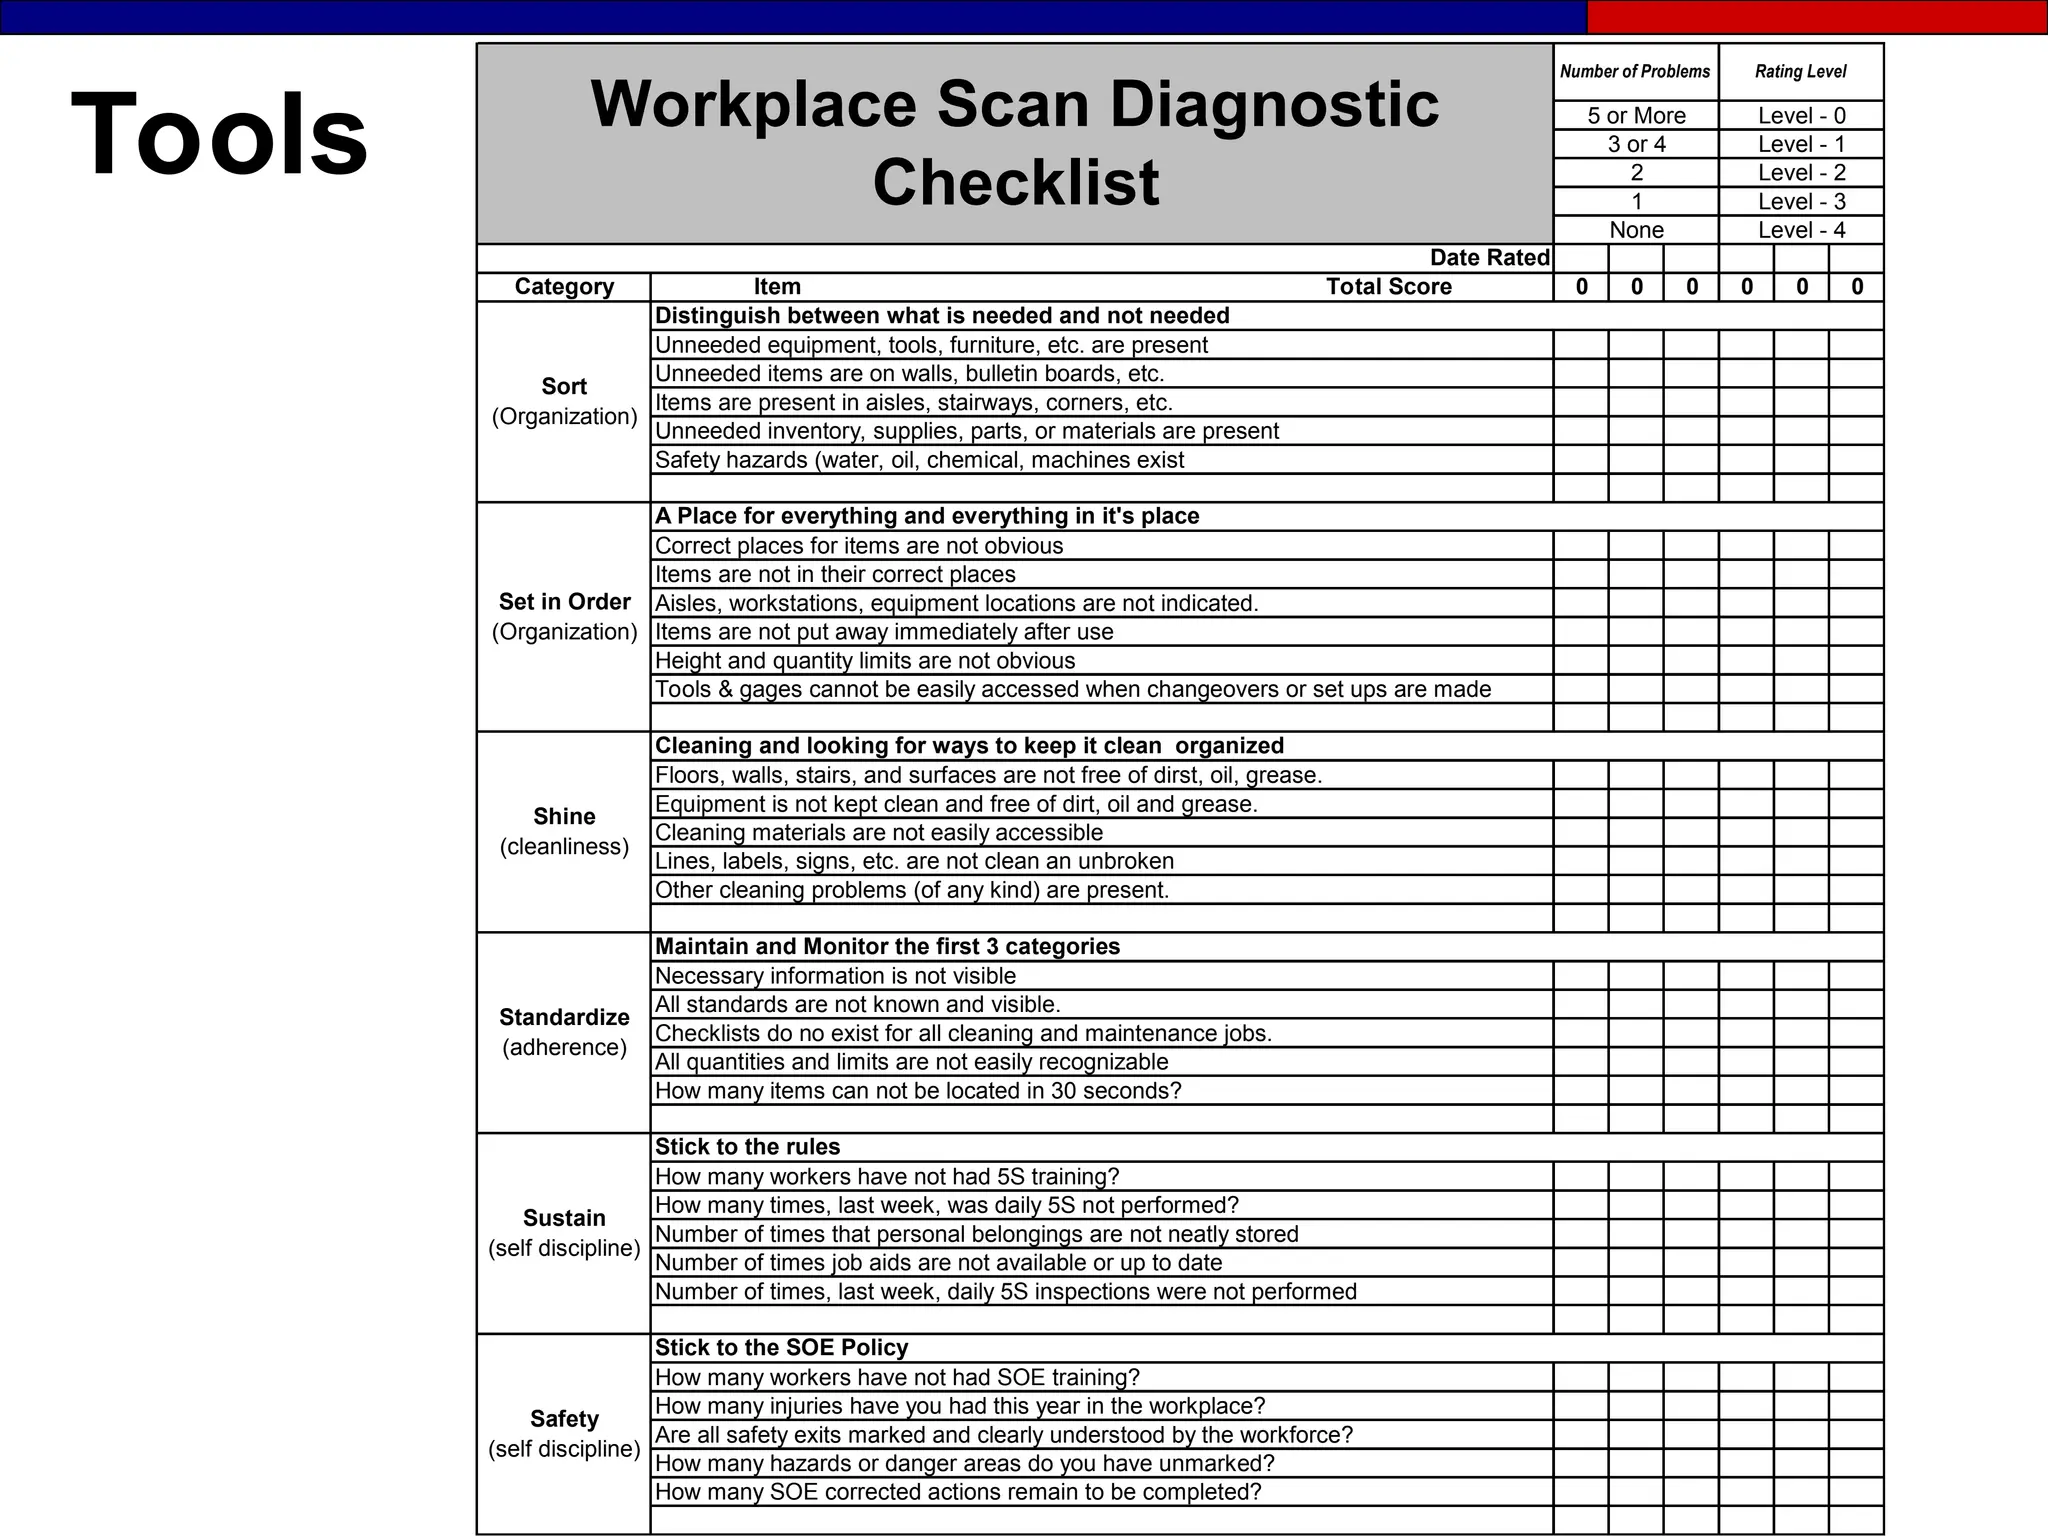
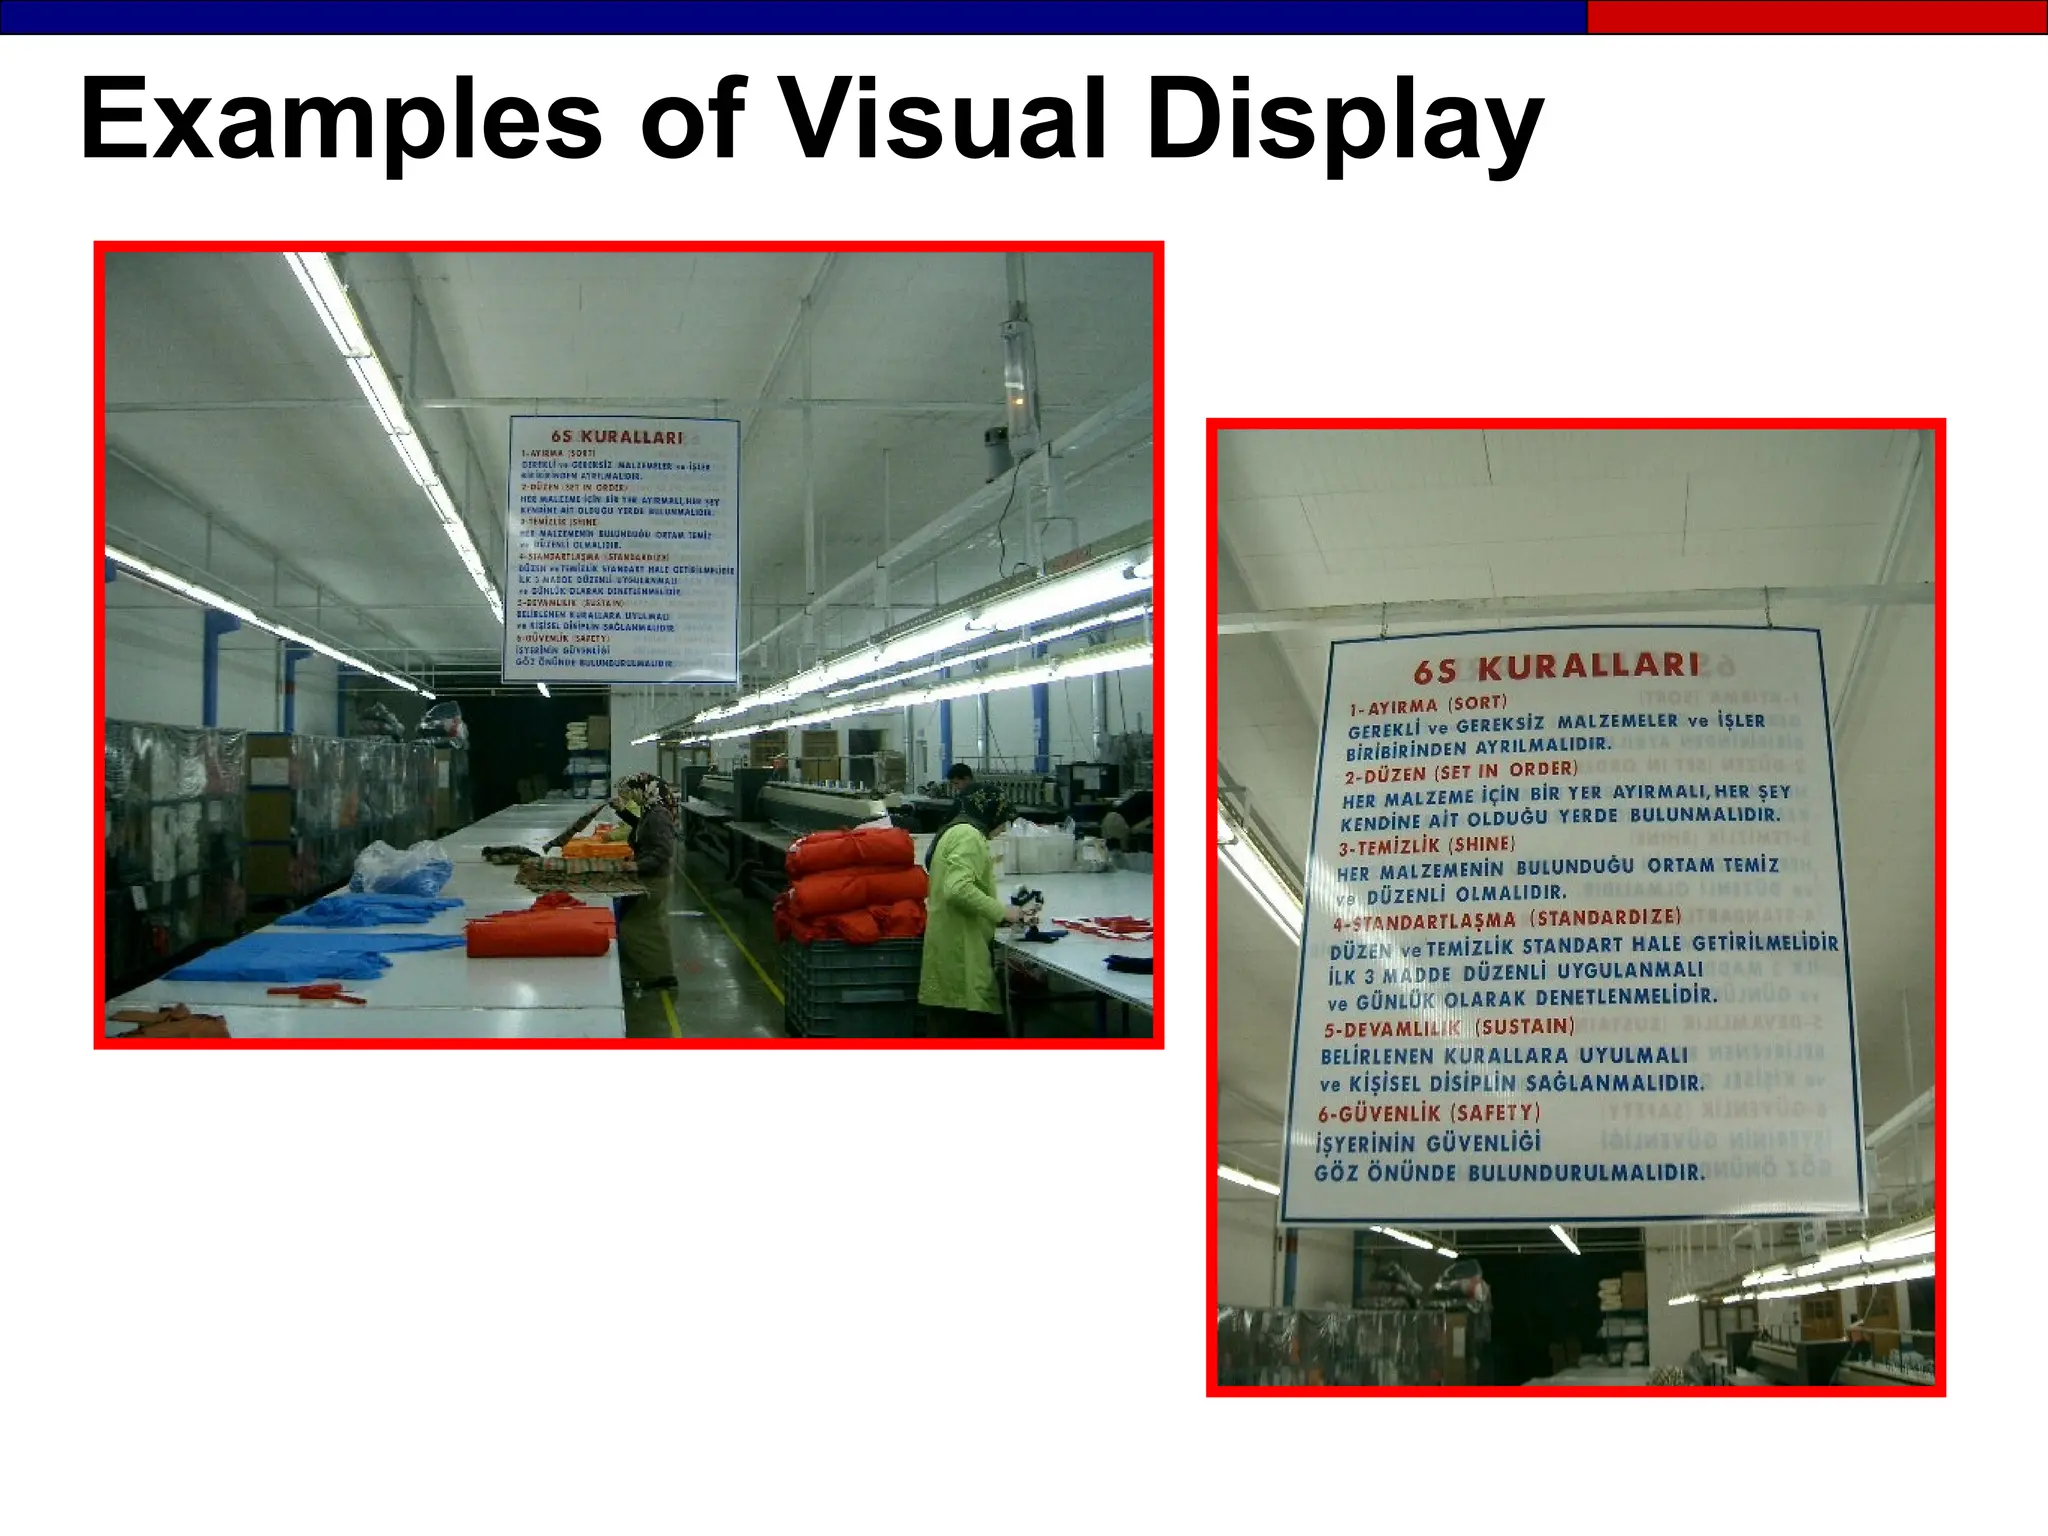
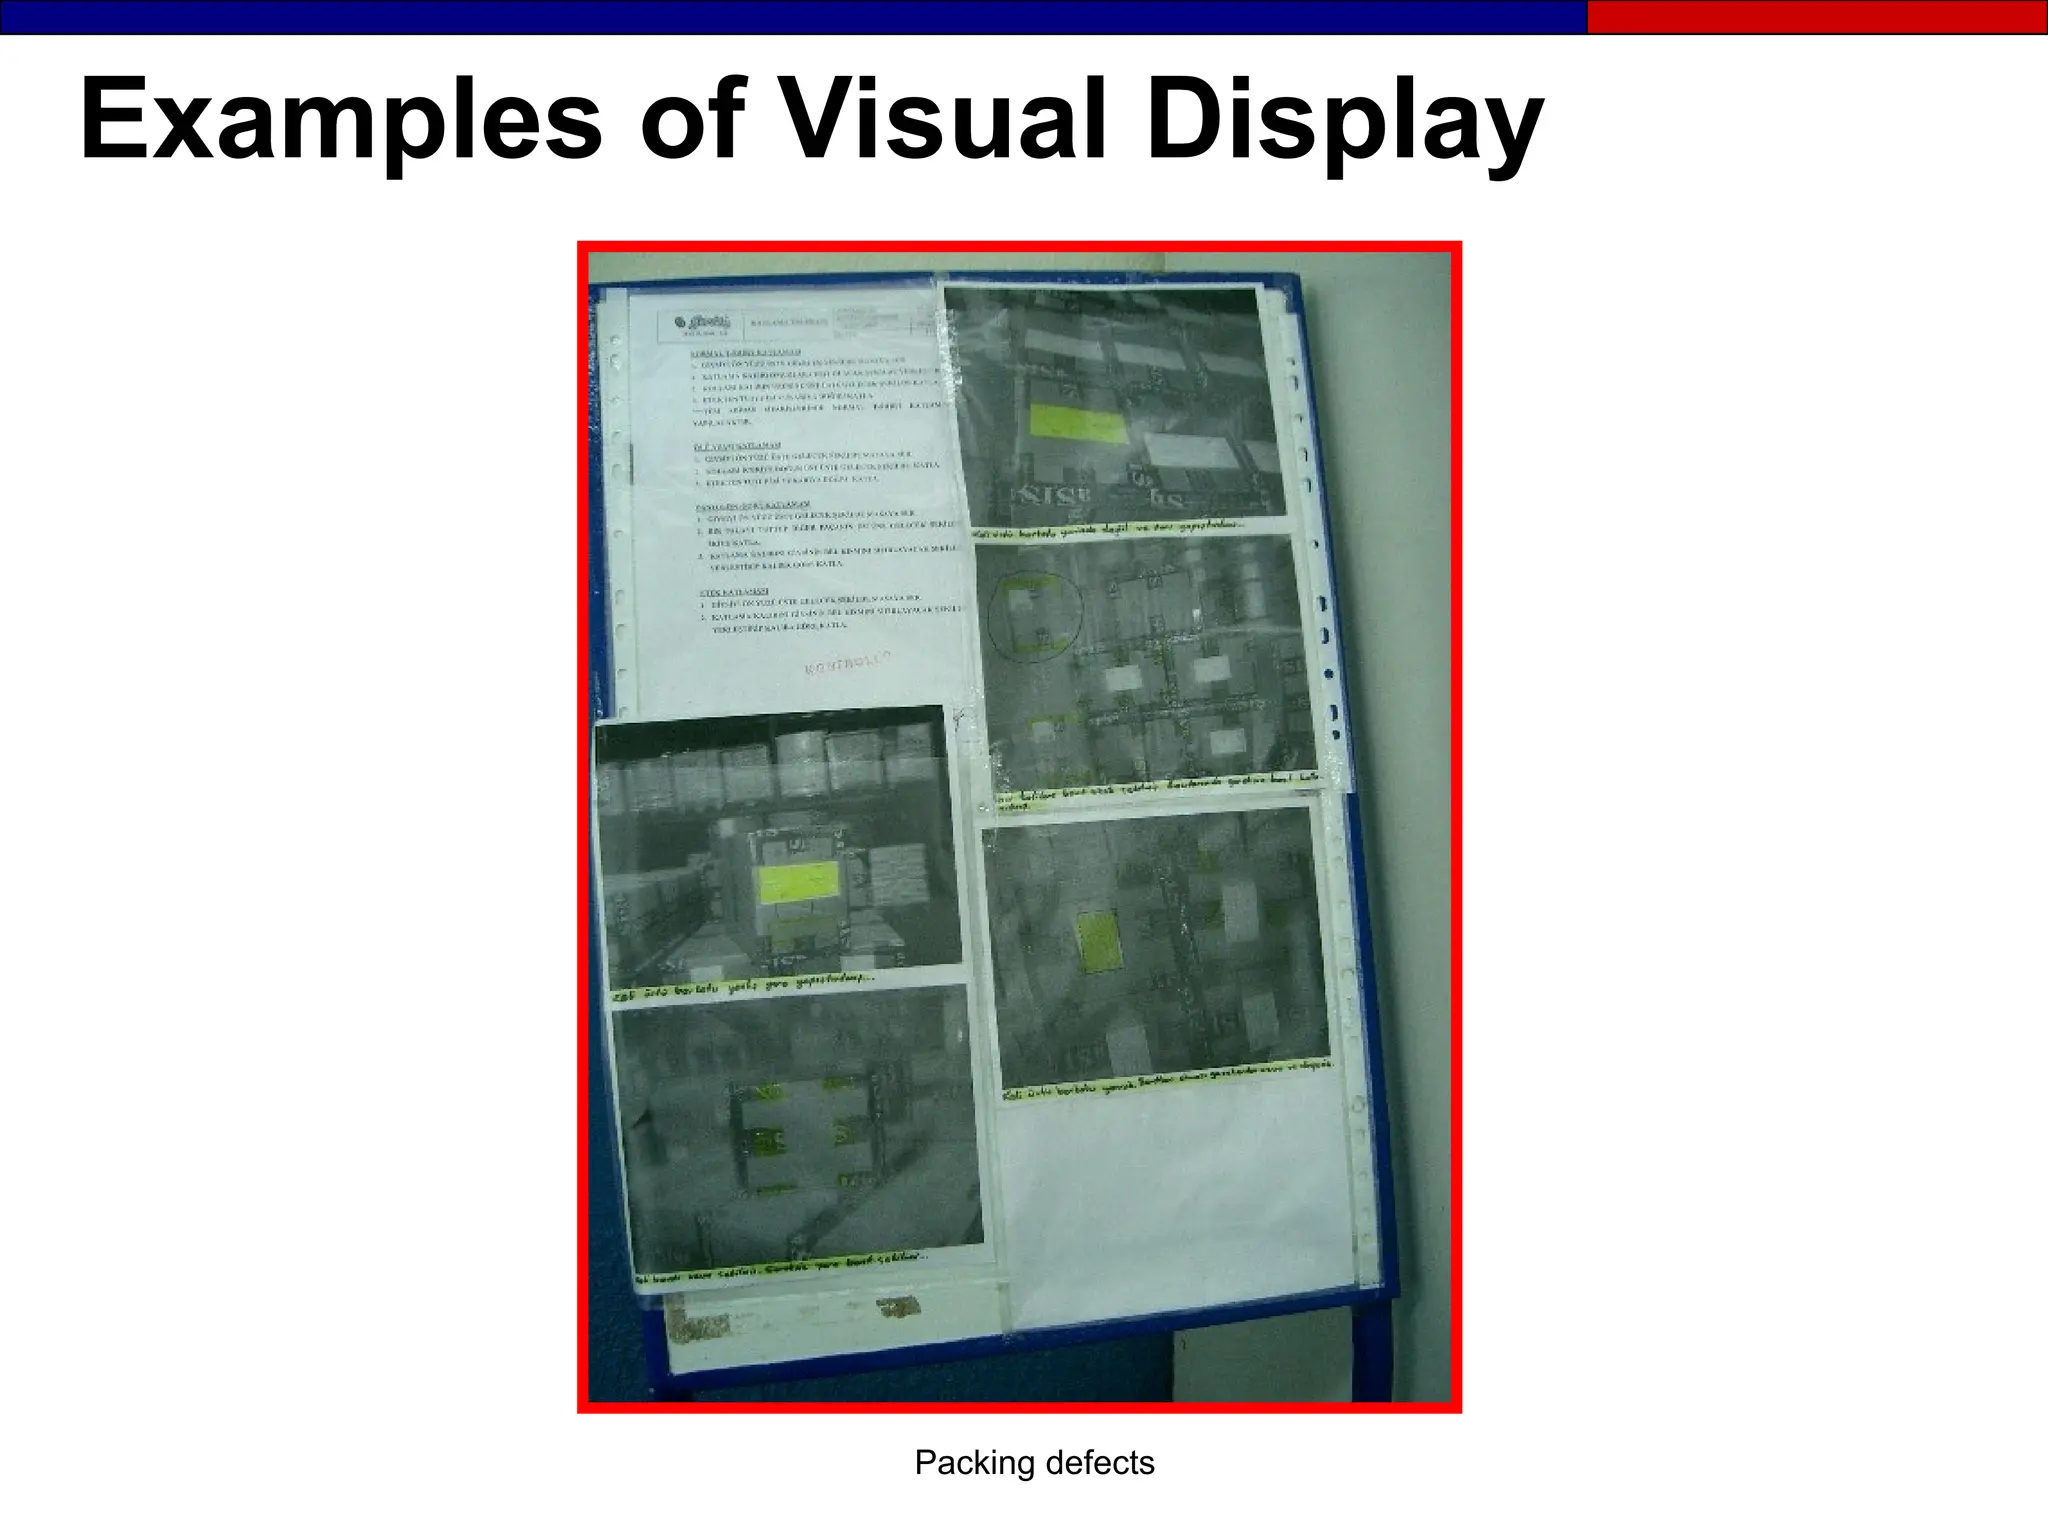
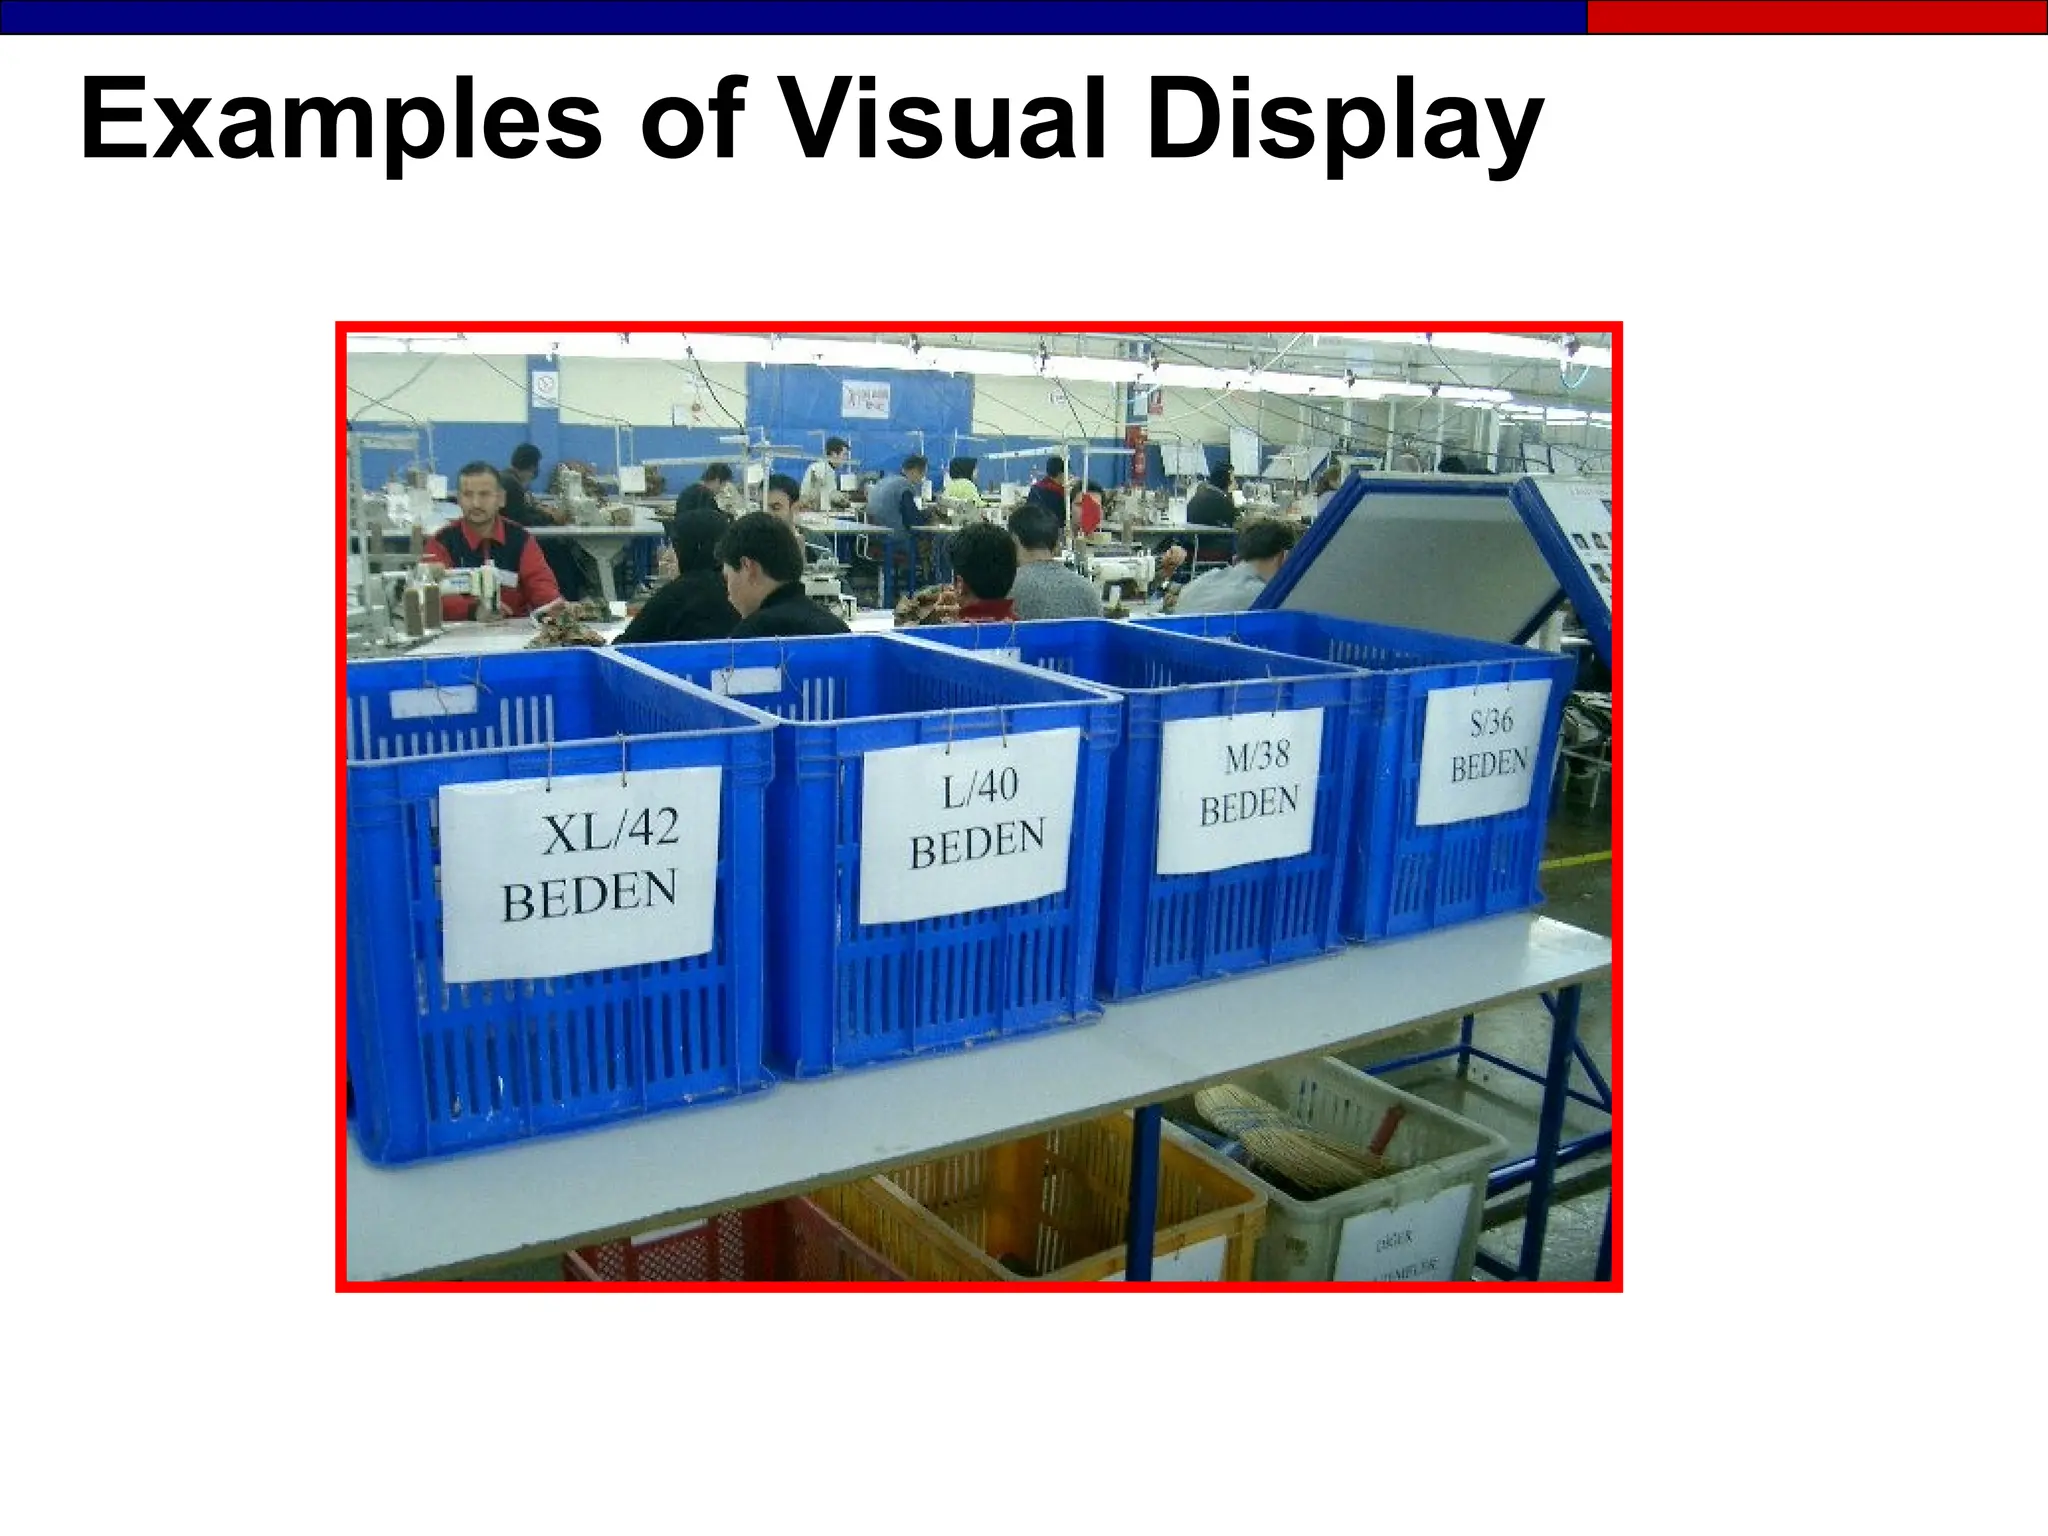
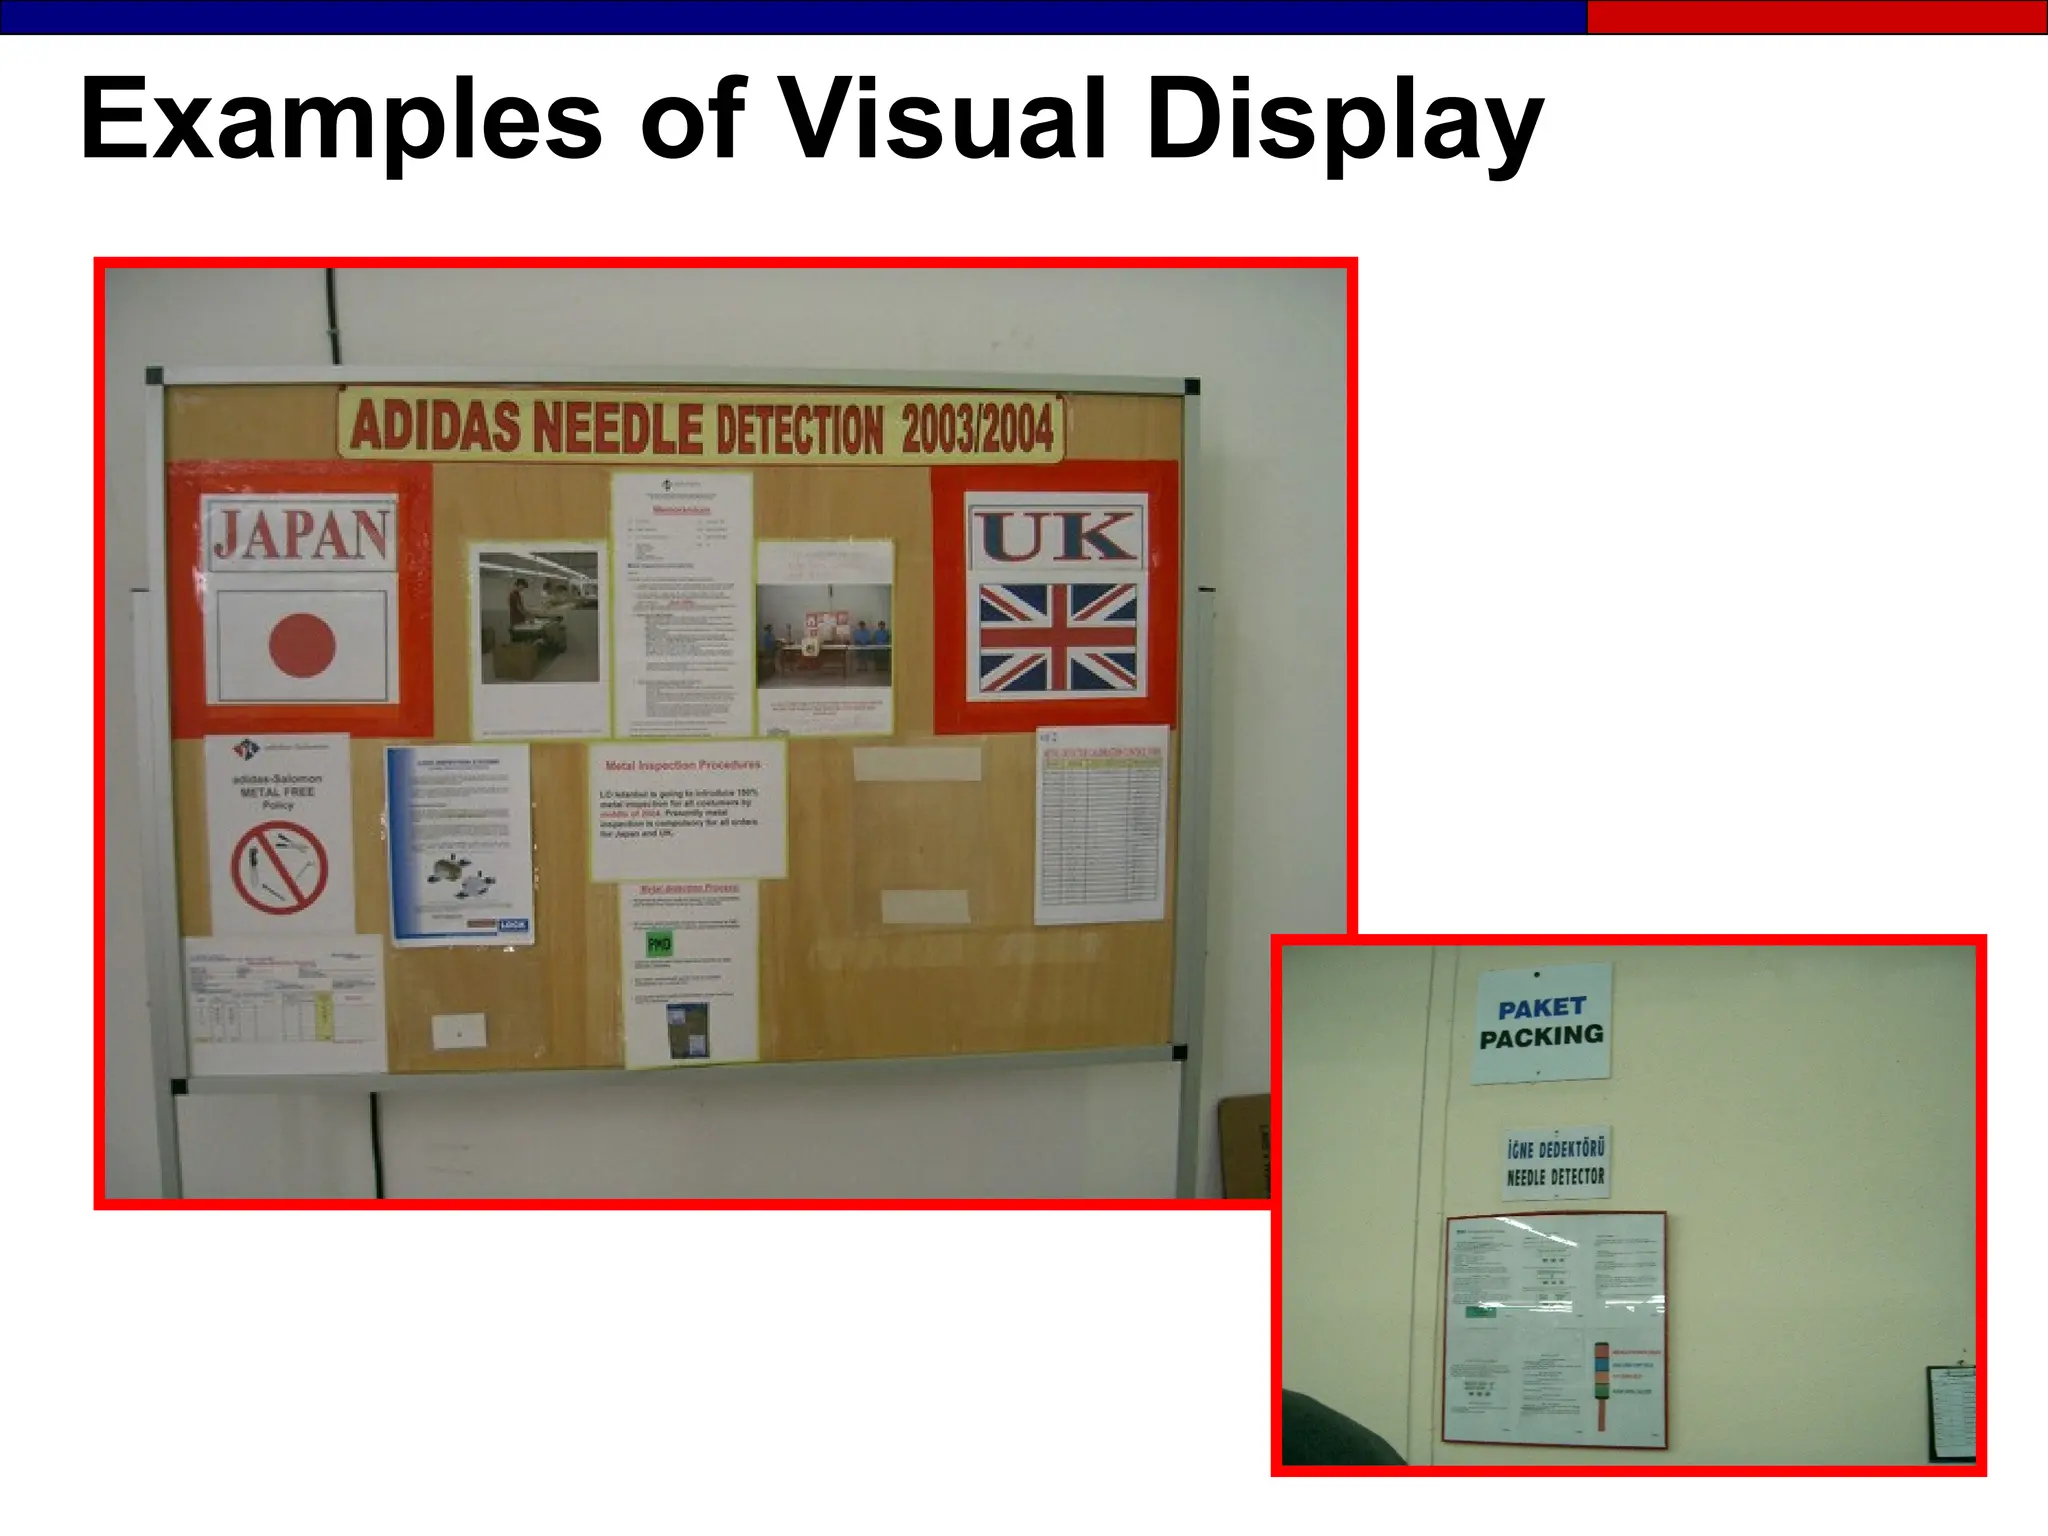
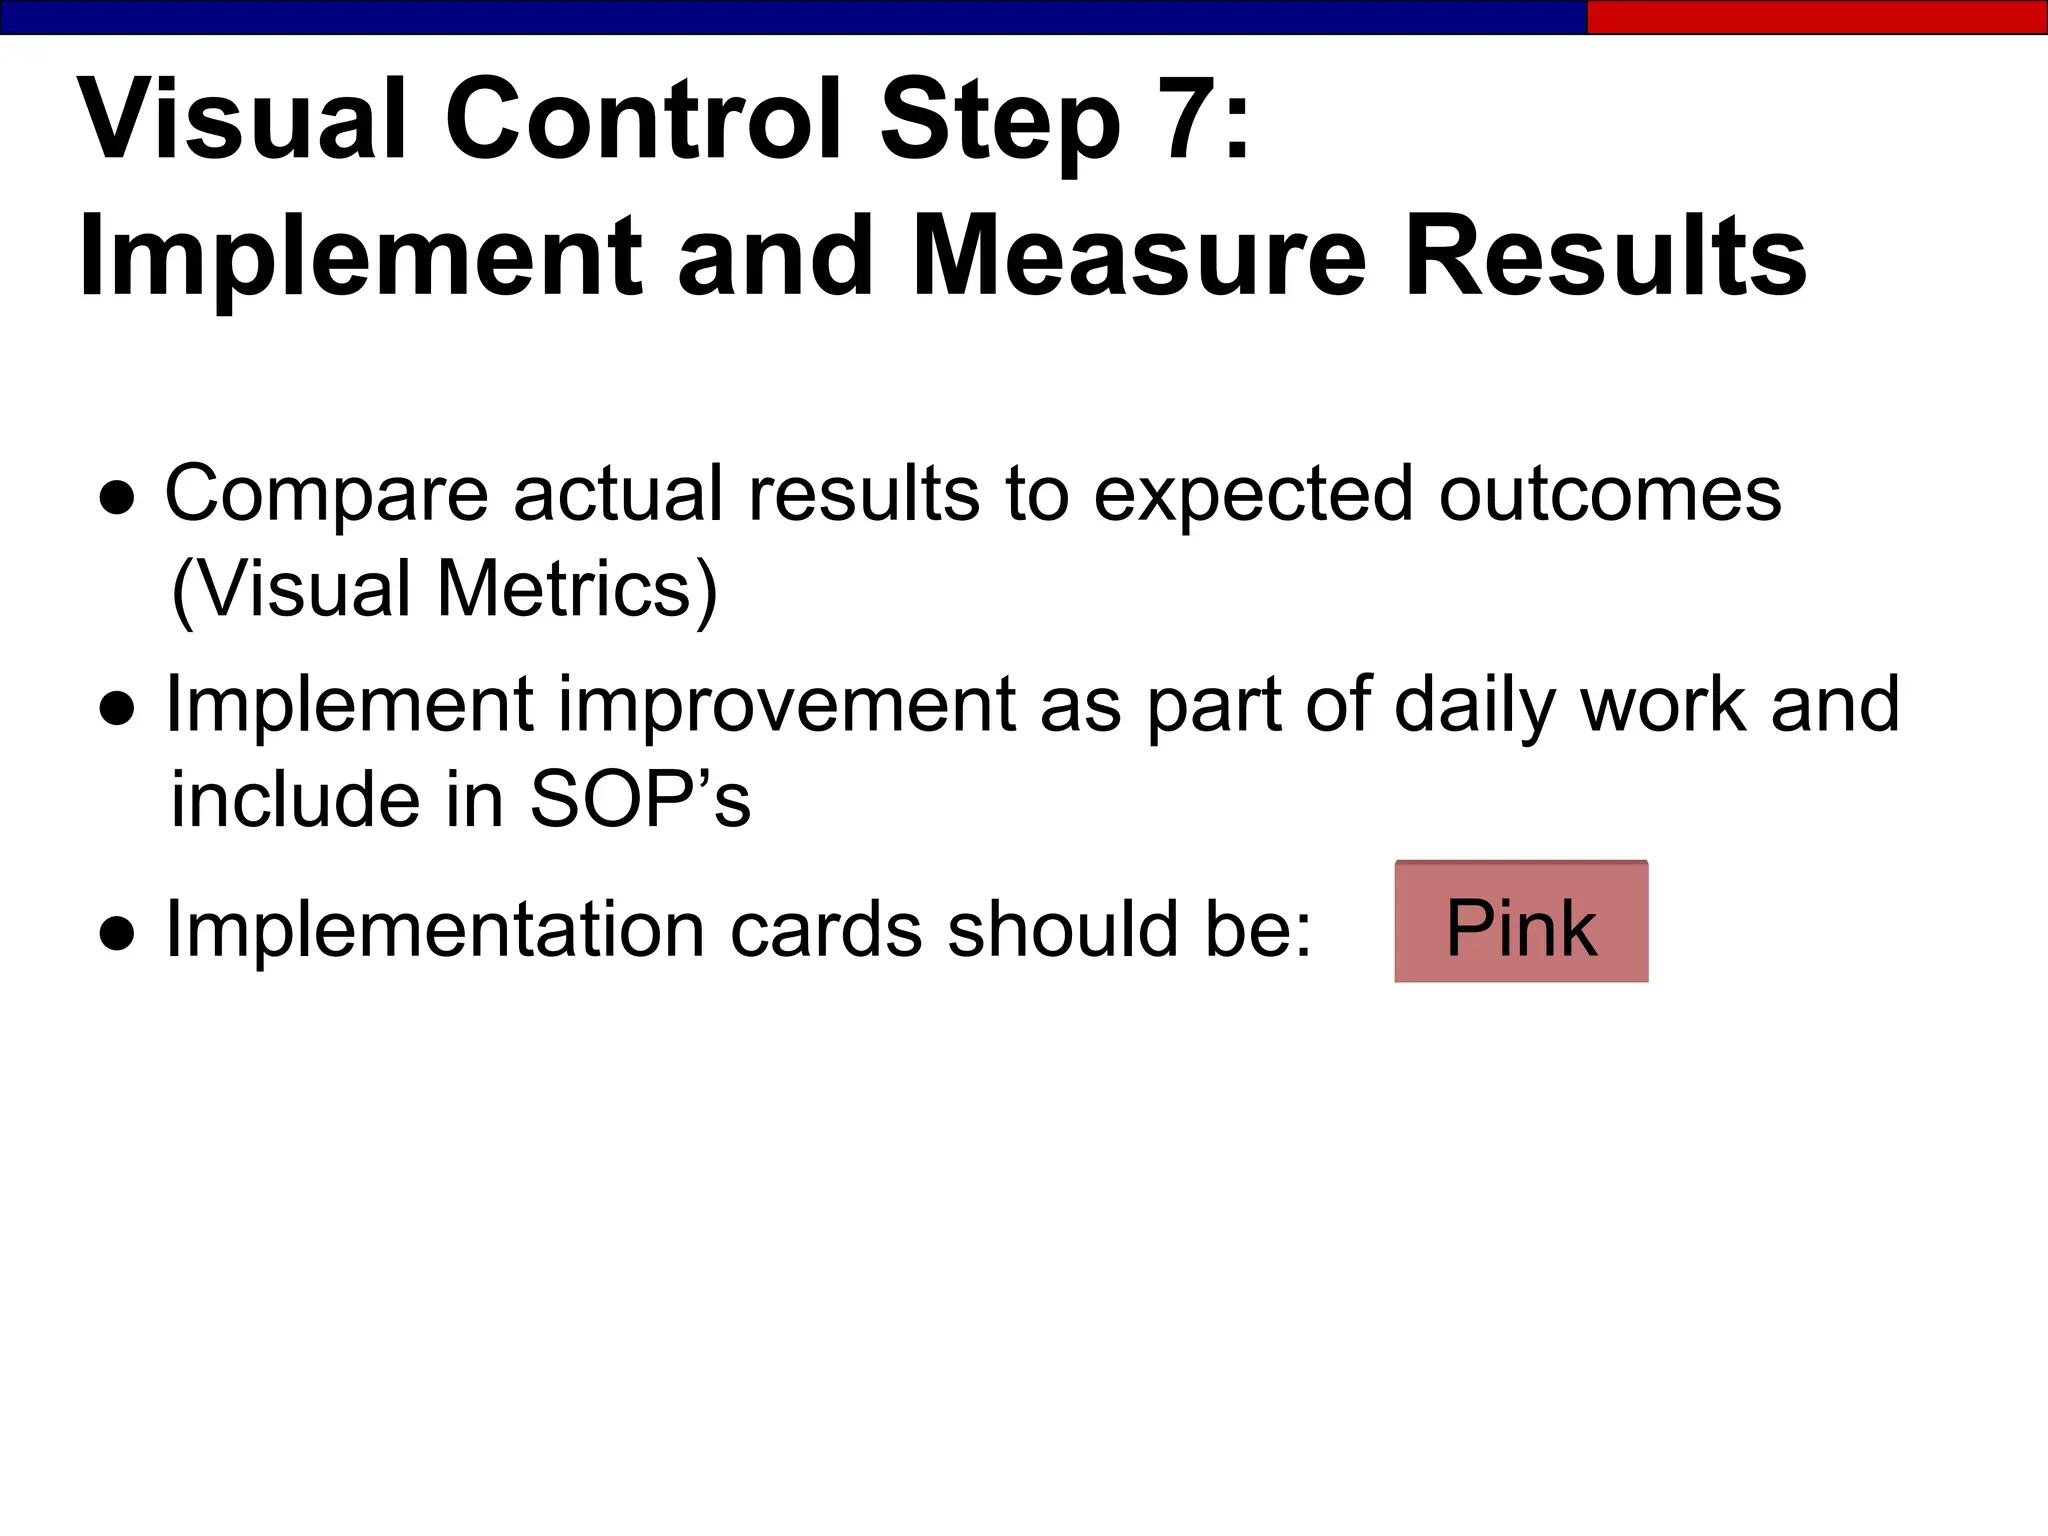
6S and
the Visual Workplace
Creating Stability
4M’s
Visual
Management
6S
• Man / Women
• Machine
• Materials
• Methods
• Visual Displays
• Visual Metrics
• Visual Controls
• Sort
• Set in Order
• Shine
• Standardize
• Sustain
• Safety
Maintaining Stability
● Stability starts with Visual Management and 6S’s
● Stability comes from involvement of the 4M’s
● A 6S foundation supports and sustains:
- Standardized work
- Total Productive Maintenance
- JIT (Just in Time) production
What is a Standard?
A standard is a clear image of a desired condition.
● Standards make abnormalities obvious so
that corrective action can be taken.
- A good standard is simple, clear and visual.
- Standards are linked to action and posted at the
point of use
Section 1
The 6S’s
Workplace Organization : 6S’s
A simple common sense system comprising
of the following steps
● Sort (Organization)
● Set in order (Orderliness)
● Shine (Cleanliness and inspection)
● Standardize (Standard Operating
Procedure-SOP)
● Sustain (Self-discipline)
● Safety S.O.E. (1)
Share information
Workplace organization and standardization
(2)
Share standards
(4)
Alarms
(5)
Stop defects
(6)
Eliminate
defects
(3)
Build standards into the workplace
V
i
s
u
a
l
D
i
s
p
l
a
y
s
V
i
s
u
a
l
D
i
s
p
l
a
y
s
6Ss
6Ss
V
i
s
u
a
l
C
o
n
t
r
o
l
s
V
i
s
u
a
l
C
o
n
t
r
o
l
s
Building A Foundation
●
● A good 6S condition, in other words, a
A good 6S condition, in other words, a
clean, safe well ordered workplace that
talks to you with visual aids is the
foundation of improvement.
The 6S system also establishes discipline in the workplace
that can be used later when additional tools are added.
Shine (Cleanliness)
Clean everything, eliminate all
sources of contamination, find ways
to keep the workplace clean, adopt cleaning
as a form of inspection, make cleaning
a part of everyday work
Sort
Sort out what is needed and
what is not needed.
When in doubt throw it out!
Sustain ( Self discipline)
Sustain improvements to prevent
backsliding. Stick to the SOP’s
(make correct procedures a habit,
properly train all staff, inspect
the workplace daily)
Safety
Always consider the Safety of the Workplace
Set in Order
A place for everything and
everything in its place. ( Keep everything
that is needed in an orderly fashion so that
Things can be accessed easily)
Standardize ( adherence)
Create the rules by which the first
3Ss will be implemented and maintained
(Make standards so that any abnormality
becomes obvious)
The focus of 6S
activity is to
organize the
workplace
in order to
make it more
productive and safe
The 6S’s
The First S
Sort
First S : Sort
“when in doubt throw it out”
● Remove all unnecessary items from the work
place.
● Define what is needed to meet production goals
and remove everything else.
● Key tool – Red Tagging
- Item classification
- Item ID and Quantity
- Reason for red tagging
- Work section
- Date
Sort Standards
●
● What is needed and not needed
What is needed and not needed
●
● Red-tag targets
Red-tag targets
●
● Red-tag frequency
Red-tag frequency
●
● Red-tag responsibilities
Red-tag responsibilities
●
● Disposal procedures / authority
Disposal procedures / authority
Before After
After
Is this your office?
Where is the size Small for my order?
Fabric Warehouse in
Roi-Et Tayland
First S : Sort and
Red Tagging
●
● A visible way to identify items that are
A visible way to identify items that are
not needed or in the wrong place
-
- Establish the rules
Establish the rules
-
- Identify unneeded, misplaced items
Identify unneeded, misplaced items
-
- Attach red tags
Attach red tags
-
- Move identified items to a holding area
Move identified items to a holding area
-
- Red-tag safety problems
Red-tag safety problems
-
- Dispose of truly unneeded items
Dispose of truly unneeded items
Red Tag Sample
Name:
Date:
Location of item:
Reason for red tagging:
Red-Tag Holding Areas
● Are used for temporary storage
● Should be in a located nearby
● Needs someone to be responsible for it
● Needs to be cleared out often (Weekly?)
● Should be highly visible
● Should be centrally located
● Should be clearly identified
● Should have a clear disposal procedure
Red Tag Areas
Red Tagging
●
● Set up a red-tag removal location.
Set up a red-tag removal location.
●
● Schedule a red-tag pause
Schedule a red-tag pause
●
● Explore recycling options
Explore recycling options
●
● Set up a capital assets disposal procedure
Set up a capital assets disposal procedure
●
● Measure red-tag volume (make it visual)
Measure red-tag volume (make it visual)
●
● Commit to regular red-tagging
Commit to regular red-tagging
Sort
Materials at aisles, stairs, corners are present
Unneeded equipment, tools,
Furniture etc. are present
Unneeded inventory, support materials, parts
Or materials are present
The Second S
Set in Order
A place for
everything and
everything in it’s
place.
Set in Order Standards
“A place for everything and everything in it’s place”
The Second S: Set in Order
● Organize what’s left to minimize wasted
motion.
● Draw to scale the current state of the
physical layout on a Current State Map
Set in Order Standards
● What signboards should look like and
where they should be placed.
● What different colors mean
● Where people can walk
● Dangerous areas
● What protective clothing is required
● What equipment signage and footprints
should look like.
Examples: Set in Order
Correct places are not obvious for materials Materials are not in their right places
Examples: Set in Order
Height limits are not obvious
Examples: Set in Order
button
 after
 before
Examples: Set in Order
Cupboards for operator personal belongings
 after
 before
Examples: Set in Order
Broken needle part scanning with magnet.
Magnets for broken needles.
Examples: Set in Order
Storage of markers
on the shop floor
Examples: Set in Order
Color-coded trolley to put repair/rework, B/C grades
Supermarket area for cut parts
Examples: Set in Order
Specially designated trolley
for elastic (seperated by size)
Examples: Set in Order
Sewing threads
Spare machine area –
in front of sewing line
Examples: Set in Order
Set in Order Suggestions
● Invite team members to inspect Current
State map and comment on:
- Current hassles
- Countermeasures
- Comments
Leave the Map up for one week to invite comments
Example: Area Map
Shelf
Iron-
interlining
Fabric Inspection
numbering
FIRST FLOOR
CURRENT
STATE
Laborato
ry
Sorting
Fabric Lay & Cutting
Fabric
warehouse
Tape
WIPE
Delivery and
shipping
WIPA
WIPB
WIPC
WIPF
WIPD
32m
27m
28m
26m
1.5m
15m
10m
10m 39m
Example: Area Map
1 3
6
5
7
2
10
9
12 11
16 15
18
17
20
32
8
34
22
33
Line 2
Folding and
polybagging
SEWING
IRONING
PACKING AREAS
CURRENT-STATE
(STYLE : xxx)
12 m
R R
35
elevator
SEWING LINES
Line 3
Line 1
Stain Removal
EOL Inspection
27
m
irons
Cut
parts
14
13
12.3
m
6
meters
packing
1.7 m
9 m
34m
12.5
meters
1.5 m
4.3
m
23
21
25
19
28
29
26
27
30
31
24
Example: Area Map
KAIZEN
● Three areas to work on: (Current-State Map)
- Fabric warehouse, Decoration and Sewing
- Use color-coded post-it’s to represent
equipment places (machine, table, stand, etc.)
- Walkways
- Draw Material movement
- Measure distances and indicate
- Inspect for flow, health and safety issues and
any unpleasant suprises.
Organize and Apply Colors
● The 3 Keys to Organizing
- Where?
- What?
- How Many?
● Fix Positions
- Equipment – Materials, mark the floor position
- Tools and Gauges – make a shadow board showing outline
- Parts and Materials, - make a grid system that identifies position.
- Show number of units using a visual system identifying
max./min. levels
- Mark walkways, mobile equipment routes, perimeter of opening
doors, health and safety issues.
Develop Color Standards
Your objective should be transparency, the location
of everything must be so clear that:
● Anyone can find anything at any time
● Out of Standard situations are obvious to
everyone
Visual Systems
● A group of visual devices designed to share
information at a glance.
● Four Visual Systems in increasing power.
- Visual indicator - tells (street signs)
- Visual signal – grabs attention (traffic light)
- Visual control – limits behavior (parking lot lines)
- Guarantee – Allows correct response only (gas station
automatic pump shut off)
“
“develop visual systems that talk to everyone”
develop visual systems that talk to everyone”
Set in Order Future-State
● Address comments collected from the team
members
● Respond to each suggestion on posted chart.
● Minimize wasted motion
● Show material flows
● Draw the Future State Map
Leave the Map up for one week to invite comments
Conveyance (in-house)
Fabric storage trolley
before spreading
Wheeled Trolleys for cut parts, Waste Carts / Bins
Waste trolley for cut parts
Conveyance (in-house)
Containers are sent to upstairs via conveyor
Carton loading / unloading ramp
Trolley for repair/rework B/C grades
The Third S
Shine and
Inspect
The Third S: Shine and Inspect
The 6S team must decide:
- What to clean (targets)
- How to clean (methods)
- Who will do the cleaning (part of ea. Job)
- How clean is clean
Develop check sheets outlining what should be cleaned.
Be as specific as you can.
Inspect for sound, smell, vibration, temperature or other signs.
Train team members to solve root cause of cleanliness problems.
The Third S: Shine (Cleanliness and
Inspection)
● Clean everything
● Eliminate all sources of contamination
● Find ways to keep the workplace clean
● Adopt cleaning as a form of inspection
● Make cleaning a part of everyday work
Shine Examples
Shine Examples
Shine Examples
Maintenance – shadow board spare parts boxes
Shine Examples
Other cleanlines issues (any type) are present
Equipment are not kept clean, dust and oil
Shine Examples
Trimmed parts are not allowed to fall down
onto the ground. Elimating dust helps to reduce/
eliminate stains over the product and also
has a positive effect for worker’s health.
Air pipe to clean station at the end of the shift.
Cleaning has become a daily routine task.
Shine Examples – Preventive
Maintenance Sheet
MACHINE NAME:................................................................................................................................... DATE:......../...../.......
CODE:............................................................................................
WEEK NO:.................
CHECK POINTS RESP. MON TUE WED THU FRI SAT SUN
THREAD INSTALATION METHOD OP.
RIGHT NEEDLE SELECTION AND CONDITION OP.
CHECK SHUTTLE AND BOBBIN OP.
POWER SWITCH OFF (DURING BREAK AND END OF SHIFT) OP.
DOES BOBBIN WRAP UP PROPERLY WORK? OP.
PUT A PIECE OF FABRIC UNDER MACHINE HEAD (OIL STAINS) OP.
OTHER ABNORMALITIES (Mechanical, Electricity, Pneumatic) OP.
CHECK & CLEAN MACHINE MOVING PARTS (Breaks, after shift) OP.
CHECK # STITCHES IN CM OP.
CHECK OIL LEVEL AND FLOAT OP.
MACHINE CLEANLINESS MA
LUBRICATE MACHINE MOVING PARTS (Button, Piping, Thread Wrap up, Punterez) MA
CHECK BELT TENSION OP.
CHECK CUTTING KNIFE OP.
ARE MACHINE PARTS COMPLETE OVER THE MACHINE? OP.
1500 FRM.03 24.01.2002/00
OP. OPERATOR DONE, GOOD ?
MA MECHANIC BREAKDOWN X
PREVENTIVE MAINTENANCE, CLEANING & LUBRICATION CHECKLIST
The 4th S
Standardize
The 4th S: Standardize
● The best standards are clear, simple, visual.
Effective standards make the out of standard
condition obvious.
● Example: Shadow Board for Tooling
- What tools should be here
- What tools currently are here
- Who has taken a tool and when they will return it.
Example of Shadow Board
The 4th S: Standardize
● Create the rules by which the first 3 Ss will be
implemented and maintained:
- Standardize red-tag procedures
- Standardize rules for red-tag holding areas
- Standardize location, number, and position of all
items
- Standardize cleaning/maintenance schedules and
SOP’s
SOP’s on Machines at each
process step
SOP’s on Machines at each
process step
OPERATION SLEEVE COVERSTITCH
MACHINE COVERSTITCH
STANDARD WIP 1
TIME (sec.)
WORK SEQUENCE 1.TAKE PART 3
2.SEW 10
3.TRIM 7
4.INSPECT 3
5. LEAVE THE PART 2
TOTAL CYCLE TIME 25
TAKT TIME 25
Standard Operating Procedure
8
SOP’s on Machines at each
process step
OPERATION ATTACH NECK PIPING & NECK TOP STITCH
MACHINE SINGLE NEEDLE
STANDARD WIP 1
TIME (sec.)
WORK SEQUENCE 1.TAKE THE PART 2
2.ATTACH NECK PIPING 6
3.CUT PIPING 3
4.NECK TOP STITCH 5
5. CUT PIPING 3
6. TRIM 2
6. INSPECT 2
7. LEAVE THE PART 2
TOTAL CYCLE TIME 25
TAKT TIME 25
Standard Operating Procedure
4
Standardized Process Sheets
- Standard Cutting Job Orders
- Standard Sewing Instructions/Critics Sheet
- Stadard Charts
- Standard Line Balancing Sheets
- Standard Cell Layout Sheets
- Standard SOP Sheets
Standardization
● When we achieve 100 percent adherence to
standards, 50 percent of our problems
automatically disappear.
● 6S must be made a part of our standard work.
Time must be set aside for this activity.
● A score card should be used to measure 6S
condition which has been tailored to our
workplace.
Examples: Standardization
Cleaning pad usage for oil leaknening
(break, at the end of shifts)
spare machine clothes, or clothes after shift
Examples: Standardization
Discipline – All scissors are tied
Discipline: Metal-Free policy
Examples: Standardization
Floors are wiped frequently - Fleece
Cleaning is made daily operator’s task
Preventive Maintenance Sheets are regularly filled in
The 5th S
Sustain
The 5th S: Sustain
● In order to sustain 6S involvement is the key.
● 6S must belong to all our team members.
● Keys to Success:
- Promotion
- Communication
- Training
The 5th S: Sustain
Stick to the S.O.P.’s:
● Make correct procedures a habit
● Properly train all office and factory staff
● Get shared agreement from office and
factory staff about changes and work
habits
● Achieve order in the workplace and run it
by agreed upon S.O.P.’s
How to Achieve the Fifth S: Sustain

Practice, practice, practice
 Educate everyone in 6S
 Continuously improve
 Inspect the workplace daily
 Give feedback to operators
 Coach the team
 Facilitate implementation
 Follow the SOP
6S Promotion and Communication
● 6S Report Boards
Targets, current status, “6S catch of the month”,
before and after photographs
● 6S catch of the month
Recognize excellent 6S work
● 6S slogan or logo contests
Involve team members in giving their activity a unique
identity
● 6S core group
This team is responsible from sustaining 6S. Ask for a
volunteer from each plant operating area.
Examples: Sustain
6S Training
● 6S training must be incorporated in your overall
Lean Training Program
- Team member: introduction to 6S - 2 hours
- 6S core group members: implementing 6S – 1 day
- Supervisors and managers: implementing 6S – 1 day
“
“6S training has a quick payback and introduces the
6S training has a quick payback and introduces the
language of Lean, and lays the foundation for all future activity”
Examples: Sustain
The 6th S
Safety
The 6th S: Safety
● No change should be made that would
jeopardize safety.
● All Kaizen activities must be within the SOE
guidelines.
● Every worker should be empowered to stop the
process if any safety risk is present.
● Safety training should be provided to workers
Examples: Safety
Before After
Double light bulbs with caps to ebanle better lighting on the shop floor.
Examples: Safety
Before: Steel gloves are not used.
PPE training should be provided to workers
Examples: Safety
Needle guards are installed and in use
What Managers and Leaders
Can Do?

Make 6S part of the daily work
 Make 6S part of job descriptions
 Reward and recognize good work
 Provide resources
 Be visibly interested
 Make frequent visits to the work area
 Allow time for 6S activities
People are the Key
● Remember in implementing 6S:
- Shared agreement occurs at different rates
- People learn at different speeds
- Areas are implemented at different times
● Get everyone involved and keep them involved
Tools
● 6S Workplace Scan (Checklist)
- Gives overall view of the factory condition
● Visual Workplace Development Chart
- used to develop visual displays and controls at the
workplace.
- Establishes baselines for current conditions
- Establishes targets for improvement
Score Card - Cutting
NO CRITERIA REMARKS SCORE OBSERVATIONS
1 Unnneded/unused markers are scattered around/found
2 markers are not stored neatly ( over tables or on the ground)
3 markers are not easily accessible (no clor-coded, per customered, etc.)
4 fabric rolls are found on the floor
5 Fabric rolls waiting to be layed are not job order sequence. (in front of laying)
6 Cutter driver is out of order and cutter can only be transported to next table manually by pushing
7 Sensros for counting marker ply height are out of order. Operator counts manually.
8 Fabric rolls are not stored in shelves and placed over pallettes on the ground (inside warehouse)
9 Waste bins are notremoved from the area frequently / missing waste bins.
10 Wastes are not being seperated and stored as fabric, paper and polybag.
11 Fabric laying operators cut tapes by teeth ( while laying bottom of fabric rolls). This against worker health.
12 Hourly production output is not monitored ( no data on board) / Lack of cell supervision
13 Floors are not clean, dirty, dusty and full of fabric lints.
14 Delayed orders are available
15 Personal belongigns are around
16 Air orelectricity pipes/plugs are not dressed and lay on the floor.
17 Unneded equipment found (desk, chair, )
18 Supervisor's desk untidy and disorganized. (documents, job orders, etc.)
19 Unneeded/unprocessed job orders waiting on table.
20 Insufficient number of trolleys for cut parts
21 Excessive/leftover fabric inventory is too high and occupies space and shelves/ no regular disposal.
22 Steel gloves are not used by cutting operators. ( during bandknife cutting - though available)
23 Markers are layed over-and-over (over the table) due to limited space and poor cutting efficiency.
24 Fabric relaxing times are not obeyed.
25 Marker ply height are not clearly stated as SOP / not obeyed during laying
26 Job orders are not clear and easily understood
27 KPI Board is not recorded / monitored
28 Plotter room is at far distance
29 No procedure is available for returning leftover fabric back to wrehouse area. (after cutting)
30 Fire hoses and extinguishers or emergency exits are blocked
Score Card - General
NO CRITERIA DESCRIPTION SCORE OBSERVATIONS
1
Removing Unnecessary
items
All items not necessary for performing work are removed from the workplace.
Only tools and materials, and jigs are present at work stations
2
Storage of cleaning
Equipment
All cleaning equipment is stored in a neat manner; handily and easily
available when needed.
3 Floor Cleaning All floors are clean and free of debris, oil and dirt
4 Bulletin Board
No outdated, torn or soiled announcements are displayed. All bulletins are
arranged in a straight and neat manner.
5 Emergency Access
Fire hoses and emergency equipment are unobstructed and stored in a
prominenetly, and are easy to locate. Stop switches and breakers are marked
or color-coded for easy visibility
6 Items on Floor
Work in process, tools, and any other material are not left to sit directly on the
floor. Large items which must be positioned on the floor are in clearly marked
areas delineated by painted lines
7 Aisleways Marking
Aisles and walkways are clearly delineated and can be identified at a glance.
Lines are straight and at right angles with no chipped or soiled paint.
8 Aisleway Maintenance
Aisles are always free of material and obstructions.Nothing is ever placed on
the lines and objects are always placed at right angles to the aisle lines.
9
Storage and
Arrangement
Storage of boxes, containers and material is always neat and at right angles.
When items are stacked, the are never crooked, or in danger of toppling over.
10 Equipment Painting All machines and equipment are painted and kept clean by routine care.
11 Equipment Cleanliness
Machines and equipment are kept clean and unsoiled by daily care. Glass
(windows) and work surfaces are kept clean free from contamination. Guards
and sields are used to keep chips and oils from falling on the floor.
12 Equipment Maintenance
The controls of machines are properly labeled and critical points for daily
maintenance checks (e.g. Fluid and lubrication levels) are clearly marked.
Equipment check sheets are neatly displayed and and kept clean and
updated.
13 Tool & Material Storage
Nothing is placed on top machines, cabinets, or other equipment. Nothing
leans against the walls or columns.
14 Document Storage
Only documents necessary to the work are stored at work stations. Such
documents and binders are stored in a neat and orderly manner.
15 Document Control
All documents are labeled clearly for content and responsibility for control and
revision. No unlabelled binders or documents are present. Obselete or
unused documents are routinely purged.
16
Arrangement of Gages &
Tools
Tools, jigs and fixtures are arranged neatly and stored in way that they are
kept clean and free of any risk of damage.
17
Ease of Access to Tools
& Gages
Tools, jigs and fixtures are arranged so that they can be easily accessed
when changeovers or setups are made ( thus facilitating productivity). The
same is true for gages and measuring equipment used to check quality.
18
Arrangement of shelves,
benches, and desks
These are arranged, divided and clearly labeled such that it is obvious where
things are stored and where they should be returned.
19
Upkeep of shelves,
benches, and desks
These are kept free of unused objects, including files and documents. Tools
and fixtures are cleaned before being replaced to proper position.
20 Sustaining 6S
A disciplined system of control and maintenance exists to ensure that each of
the above items are maintained at the highest possible level. It is the
responsibility of management to maintain this system.
Score Card - Sewing
NO CRITERIA REMARKS SCORE OBSERVATIONS
1 Unneeded templates are around
2 Unneeded sewing thread bobbins
3 Thread bobbins on the ground
4 Missing labels on cartons/boxes (e.g. Repairs)
5 Sliders missing/broken on overlock machines, waste bins missing
6 Labels found over the table / around
7 Oil leakage from machine pipes
8 Hourly KPI'S are not monitored and recorded (on board)
9 Color coded KPI indicators are not changed/updated hourly
10 Floors are dirty / dusty
11 Broken needle found/evidence over the sewing machine table
12 Ex-garments found on the line though shipment was made
13 Personal belongings exist (mobile phone, bags, jacket, shoes)
14 Water bins are found
15 Air pipes / electricity wires are on the ground and not dressed well
16 Unneeded equipment (table, chair, stands, machine,tools etc.)
17 Waste bins are not clearly placed under the sewing machines
18 Line supervisors's desk untidy (documents, etc.)
19 AD's and Sewing Instructions) are found on the line (they should be at supervisor's desk)
20 Scissors, tweezers are not tied / missing magnets
21 Fire hoses / entinguishers / emergency exits are blocked
Tools
How many SOE corrected actions remain to be completed?
How many hazards or danger areas do you have unmarked?
Safety
(self discipline)
Stick to the SOE Policy
How many workers have not had SOE training?
Are all safety exits marked and clearly understood by the workforce?
How many injuries have you had this year in the workplace?
Set in Order
(Organization)
Number of times that personal belongings are not neatly stored
Stick to the rules
How many workers have not had 5S training?
Number of times job aids are not available or up to date
Number of times, last week, daily 5S inspections were not performed
Workplace Scan Diagnostic
Checklist
0
0
0
0
1 Level - 3
None Level - 4
3 or 4 Level - 1
2 Level - 2
Number of Problems Rating Level
5 or More Level - 0
0
0
Category Item Total Score
Distinguish between what is needed and not needed
Unneeded equipment, tools, furniture, etc. are present
Unneeded items are on walls, bulletin boards, etc.
Date Rated
Items are present in aisles, stairways, corners, etc.
Unneeded inventory, supplies, parts, or materials are present
Safety hazards (water, oil, chemical, machines exist
Sort
(Organization)
Shine
(cleanliness)
A Place for everything and everything in it's place
Correct places for items are not obvious
Items are not in their correct places
Aisles, workstations, equipment locations are not indicated.
Items are not put away immediately after use
Tools & gages cannot be easily accessed when changeovers or set ups are made
Standardize
(adherence)
Cleaning and looking for ways to keep it clean organized
Floors, walls, stairs, and surfaces are not free of dirst, oil, grease.
Equipment is not kept clean and free of dirt, oil and grease.
Cleaning materials are not easily accessible
Lines, labels, signs, etc. are not clean an unbroken
Other cleaning problems (of any kind) are present.
All standards are not known and visible.
Sustain
(self discipline)
How many times, last week, was daily 5S not performed?
Checklists do no exist for all cleaning and maintenance jobs.
How many items can not be located in 30 seconds?
All quantities and limits are not easily recognizable
Maintain and Monitor the first 3 categories
Necessary information is not visible
Height and quantity limits are not obvious
Section 2
Visual Management
Creating a Visual Workplace
●
● A Visual Workplace should be
A Visual Workplace should be :
:
-
- Self-explaining
Self-explaining
-
- Self-ordering
Self-ordering
-
- Self-improving
Self-improving
●
● Out of standard situations should be immediately
Out of standard situations should be immediately
obvious and employees should be
obvious and employees should be empowered
empowered
to correct them easily
to correct them easily.
.
The Visual Workplace Vision
In a visal workplace anyone
anyone will know these
aspects, of an area, within five minutes :
- Who ? - Where ?
- What ? - Why ?
- When ? - How ?
Exercise:
Your Visual Workplace Vision
How would you describe the way your factory or
office should look in terms of:
- The physical environment:
● Cleanliness
● Inventory organization
● S.O.E. compliance
- Product or Process focused
- Understanding the status of individual customer orders:
● Level of completion in the factory
● Location in the factory
Visual Workplace Supports
the “Eight Zeros”
• Zero waste
• Zero customer
complaints
• Zero downtime
• Zero defects
• Zero injuries
• Zero delays
• Zero loss
• Zero changeovers
The Visual Management System
(1)
Share information
Workplace organization and standardization
(2)
Share standards
(4)
Alarms
(5)
Stop defects
(6)
Eliminate
defects
(3)
Build standards into the workplace
V
i
s
u
a
l
D
i
s
p
l
a
y
s
6Ss
V
i
s
u
a
l
C
o
n
t
r
o
l
s
Visual Management Triangle
•Delivery Commitments
•Goals and Schedules
•Management Rules
SEEING as a Group
•Production/Project Status
•Adhere to Timeline
•Inventory Levels
•Machine Availability
KNOWING as a Group
•SOE Requirements
ACTING as a Group
•Consensus on rules and
objectives
•Involvement in
improvement activities
•Adhere to Deliverables
Wall charts support the visual management triangle. They involve the team and
compel action.
Section 3
Visual Displays
Visual Systems
● A group of visual devices designed to share
information at a glance.
● Four Visual Systems in increasing power :
- Visual indicator - tells (street signs)
- Visual signal – grabs attention (traffic light)
- Visual control – limits behavior (parking lot lines)
- Guarantee – Allows correct response only (gas
station automatic pump shut off)
“develop visual systems that talk to everyone”
Overview: Visual Display
 Definition of visual display
Definition of visual display
 Display categories
Display categories
 The need for information
The need for information
 Location indicators
Location indicators
 Types and examples of visual displays
Types and examples of visual displays
 How to implement visual display
How to implement visual display
Definition of Visual Display
A method to visually communicate a
statement of essential information.
Examples :
- SOP
- SOE
- Storage locations
- Quality points
- Equipment needs
5
Visual Control
4
Visual Metrics
3
3
Visual Display
Visual Display
2
Workplace Organization
1
Project Identification
Examples of Visual Display
 Signboards
 Status boards
 Product displays
 Area maps
 Process maps
 Location indicators
and labels
 Checklists
 Worksheets
 Flow diagrams
Location Indicators
● Show:
- What is located where?
- How many should be there?
● They are the first type of
display to be implemented
Guidelines for Location Indicators
To indicate locations :
To indicate locations : - Address signboards
Address signboards
- White location lines
White location lines
- Labels
Labels
To set limits :
To set limits : - Red height lines
Red height lines
- Yellow limit lines
Yellow limit lines
- Standard container sizes
Standard container sizes
To indicate danger :
To indicate danger : - Red “danger” signs
Red “danger” signs
- Black and yellow hazard tape
Black and yellow hazard tape
Location Indicators
Location Indicators
Location Indicators
Location Indicators
Location Indicators
Location Indicators
Location Indicators
Location Indicators
Visual Signal
Visual Signal
Visual Signal
Examples of Visual Display
Packing defects
Examples of Visual Display
Approved sample posted
Examples of Visual Display
How to Inspect? - Apparel
Examples of Visual Display
Man in the Shop Floor color-coded
Examples of Visual Display
Stain (Pink) Fold & Pack (Brown) Q.C. / Inspector (Red)
Ironer (Yellow) Material Handler (Blue) Operator
How to Implement Visual Display
 Identify the categories to focus on based
Identify the categories to focus on based
on factory objectives
 Identify the problems associated with those categories
Identify the problems associated with those categories
 Identify who needs to see the display
Identify who needs to see the display
 Determine the best location
Determine the best location
 Develop and test the display
Develop and test the display
 Finalize and implement the display
Finalize and implement the display
Examples of Visual Display
Finished Product Storage Area
Waiting area for products to be dedected
On-going production products –
Waiting cartons
Metal-Free Zone
Inspected cartons area
Dedected chidrens’s wear
Computers vs. Visual Management
●
● Computers are not for group communication, they
Computers are not for group communication, they
lack a public interface.
●
● When computers offer expanded visibility (graphic
When computers offer expanded visibility (graphic
displays) they will play a larger role on the factory
floor.
floor.
Information must be
Information must be visible
visible, available
, available where
where it is
it is
needed, and as close to
needed, and as close to real time
real time as possible.
as possible.
Visual Workplace Development
Chart
Target Area:
People:
Sort
2. Workplace organization:
Area Baseline Information:
Safety
Measurement
Baseline Data
Sustain
Check List
Shine
Set in Order
Environment
Display method
Quality
Storage
Operations
Audience
Operations
1. Project Identification
Area Purpose/Function:
Team Members:
Photos
Area Map
Identify:
Safety
Tracking
method
Quality Equipment
Location
Equipment
Standardize
Storage
4. Visual Metrics:
3. Visual Display:
Environment
Safety
5 Visual Control:
Visual Workplace Development
Chart
Section 4
Visual Metrics
Definition: Visual Metric
● Visual display of a key
measurement (KPI) indicating the
changing status of any process:
- Supply chain
- Support functions
- Manufacturing
- Product Development
- Quality
Overview : Visual Metrics
• Role of Visual Metrics:
– Use data appropriately
– Keys to effective reporting and
analysis
– What people need to make decisions
– Characteristics of “new” measures
• Examples of activity boards
• How to develop visual metrics 5
Visual Control
4
4
Visual Metrics
Visual Metrics
3
Visual Display
2
Workplace Organization
1
Project Identification
Don’t collect data if you are
not going to use it!
Use Data Appropriately
●
● To keep management and
To keep management and
operators informed
operators informed of
of
progress
progress
●
● To drive and fine-tune
To drive and fine-tune
improvement activities
●
● To educate the
To educate the factory
factory
staff
staff
●
● Display at point of use
Display at point of use
Project Name
Examples: Activity Boards
Activity Boards
Activity Boards
Activity Boards
KPI’s
Info Boards - Sewing
Operator skill chart, Line Layout per style, Line Balancing Sheet, weekly RFT,
productivity reports, CEOE, attendance list, color-coding definitions for shop
floor, 6S Checklist and scores.
Plan to Actual Board - Sewing
Visual Plan to Actual Board
Production Status – Visual KPI’s
Info Board (KPI’s)
Plan to Actual & Info Boards (KPI)
Boards and Visual KPI’s
Keys to Effective Reporting and
Analysis
 Involve operators in measurement
Involve operators in measurement
 Provide results to people who can take action
Provide results to people who can take action
 Present results in the appropriate form for audience
Present results in the appropriate form for audience
 Visually link results with spesific improvements
Visually link results with spesific improvements
 Report data in at the frequency required for timely
Report data in at the frequency required for timely
decision making
decision making
Role of Visual Metrics in
Measurement

Makes data easy to understand and react to
 Exposes and explains the waste
Exposes and explains the waste
 Shows improvements made and those
Shows improvements made and those
left to implement
left to implement
 Doesn’t rely on written language to
Doesn’t rely on written language to
communicate information
Characteristics of the
Performance Metrics
 Change over time
Change over time
 Are simple and easy
Are simple and easy
to use
to use
 Provide fast feedback
Provide fast feedback
 Foster improvement
Foster improvement
 Directly relate to strategy
Directly relate to strategy
 Are non-financial measures
Are non-financial measures
 Vary between locations
Vary between locations
Managers Look at Trends:
Factory- wide Performance
Actual
Target
Target
Time
B grade, C grade, Rework Costs
Can Problems be Solved Effectively
with This Data?
0
5
10
15
20
25
30
35
40
Day 1 Day 2 Day 3 Day 4 Day 5
Produced
Good
B grade rework
Can Problems be Solved Effectively
with This Data?
Defects Found
0
5
10
15
20
25
30
Stain Skipped
Stitch
Label Needle Hole Dropped
Stitch
Decide: When You Develop
Visual Metrics
 What needs to be measured
What needs to be measured
 Who the user will be
Who the user will be
 How to keep track of the details
How to keep track of the details
 How often to take the data
How often to take the data
 Who will do the tracking
Who will do the tracking
 How to display the data
How to display the data
 Where to locate the display
Where to locate the display
 Where is data needed / useful
Where is data needed / useful
End of Line Inspection Report
2.7%
0.3%
0.0%
1.0%
0.1%
1.1%
1.7%
0.0%
0.1%
0.0%
0.0%
0.6%
0.0%
3.8%
4.2%
0.5%
0.0%
0.0%
0.0%
0.1%
0.9%
3.1%
0.0%
0.5%
1.0%
1.5%
2.0%
2.5%
3.0%
3.5%
4.0%
4.5%
Defect
Rate
(%)
Defect Type
EOL Report (Week 51) -
Factory-wide
KPI’s
Section 5
Visual Control
Overview: Visual Control
● Definition of visual control
● Levels of control
● How to develop visual controls
5
5
Visual Control
Visual Control
4
Visual Metrics
3
Visual Display
2
Workplace Organization
1
Project Identification
Definition: Visual Control
● Visual controls are methods and
devices that alert employees that
specific actions need to be taken.
- Undesirable condition in the process
- Schedule production activities
- Safety issues (SOE)
- Inventory status
Levels of the Visual Workplace
(1)
Share information
Workplace organization and standardization
(2)
Share standards
(4)
Alarms
(5)
Stop defects
(6)
Eliminate
defects
(3)
Build standards into the workplace
V
i
s
u
a
l
D
i
s
p
l
a
y
s
6Ss
V
i
s
u
a
l
C
o
n
t
r
o
l
s
Example: Visual Control
Designated places for finished products at the end of sewig lines
Example: Visual Control
Designated places for cut parts trolleys in front of sewing lines
Example: Visual Control
Designated places for cartons at the end of sewing lines
Example: Visual Control
Supermarket Area
Example: Visual Control
Ground marking for Carton Pallettes
Example: Visual Control
Color-coding system – Cut parts polybags to be sent
to different factories / subcontractors / satellites
Example: Visual Control
Repair
To be Inspected
Inspected - Good
Rework – Stain/Dirt
Example: Visual Control
Standard Containers
Levels of Visual Control for Switching
off Automobile Lights
Clearly labeled
light switch
Instructions are
in manual
Instructions
posted on dash
board
Bell sounds if
door is opened
Device prevents
key removal
Lights switch off
when engine is
turned off
Steps of Visual Control
1. Define the problem
2. What needs to be controlled ?
3. What is the desired result ?
4. Identify facts / information
5. Evaluate improvement ideas
6. Test ideas for implementation
7. Implement & measures results
Visual Control Step 1:
Define the Problem
• Workplace
Workplace
environment
environment
• Safety
Safety
• Storage
Storage
• Production
Production
• Equipment
Equipment
• Quality
Quality
Visual Control Step 2:
What Needs to be Controlled?
● For the category you selected, decide what
needs to be controlled
● Write the items on a card
● post them on the development chart
● Control cards should be: Pink
Visual Control Step 3:
What is the Desired Result?
● Set a target result for what needs to be
controlled
● Be specific; quantify if possible
● Ask: When we achieve the desired
control level, what will be the tangible
benefit?
● Write the target on a card
● Post it on the development chart
● Target cards should be: Pink
Visual Control Step 4:
Identify Facts and Information
● Information needed for problem solving by
the team.
● Collect information from the problem area
employees.
● Identify current standards or lack of
standards
● Evaluate adherence to standards
● Gather feedback on operations and activities
● Fact cards should be: Yellow
A Review: Card Writing Guidelines
● Write only one activity, fact, or idea
per card
● Be specific and clear
● Use a full sentence, not a phrase or word
● Sign and date the card
● Write clearly so that others can understand
what you write
Visual Control Step 5:
Evaluate Improvement Ideas
● Brainstorm ideas about how to control each
activity and post ideas on a chart
● Evaluate the control level and potential impact
of each idea
● Idea cards should be: Blue
Visual Control Step 6:
Test Ideas for Implementation
● Decide which ideas to use
● Determine time-line
● Assign responsibilities
● Get authorization
● Check guidelines for effective implementation
● Test Ideas
Visual Control Step 7:
Implement and Measure Results
● Compare actual results to expected outcomes
(Visual Metrics)
● Implement improvement as part of daily work and
include in SOP’s
● Implementation cards should be: Pink
Visual Controls Can:
 Communicate needed information clearly
 Show standards clearly
 Control targeted bahavior / process
 Require little cost to implement
 Be easy to implement
Exercise: Visual Controls
● What are examples already in use for :
- Visual Controls
- Visual Metrics
- Visual Displays
Managers and Supervisors
● Draw an area map for your department:
- Label the location of each item and elements
of processing (operations, movements, stores,
inspections)
- Show the flow of material and people by using
arrows
● Complete the workplace diagnostic checklist
● Identify additional baseline measures
● Collect baseline data
Visual Display and Controls
1. Man in Shop Floor
Who Color
Operator pink
Line Supervisor white
Ironer grey
Inspector In-Line / EOL (Q.C.) light green
Packing light blue
Mechanic yellow
Material Handler red
 Colors can be determined by your own staff
Visual Display and Controls
2. Materials
What Color
Materials before processing blue
Materials after processing green
Defects, rework, off grade, waiting red
Corridor, aisles, working area yellow
Other movablearticles: e.g. Empty boxes,
trolley, stands etc.
picture
 Pictures related to Color-coding standards can be taken
and posted on a board for training purpose
Visual Display and Controls
3. Operating Stations
What Color
Material shortage / Load material
Unload Finished Goods
Defects, quality problem that needs help from Supervisor
Machine Breakdown
Style Changeover
Visual Display and Controls
4. Production Status
Metrics Criteria Symbol
Output (pcs/hr)
Output >= 110,000
100,000 =< Output < 110,000
Output < 100,000
Quality (%)
RFT>=97%
95= < RFT <97%
RFT < 95%
Work-in-Process
(WIP)
WIP =< 40 pieces
40 <WIP =< 60
WIP >60 pieces
Visual Display and Controls
Metrics Criteria Symbol
OEE (%)
OEE >= 85%
80% =< OEE < 85%
OEE < 80%
 These symbols and figures can be posted on a 90 cm * 60 cm
board (film, slide)

Implementation of 6S and the Visual Workplace

  • 1.
  • 2.
    Creating Stability 4M’s Visual Management 6S • Man/ Women • Machine • Materials • Methods • Visual Displays • Visual Metrics • Visual Controls • Sort • Set in Order • Shine • Standardize • Sustain • Safety
  • 3.
    Maintaining Stability ● Stabilitystarts with Visual Management and 6S’s ● Stability comes from involvement of the 4M’s ● A 6S foundation supports and sustains: - Standardized work - Total Productive Maintenance - JIT (Just in Time) production
  • 4.
    What is aStandard? A standard is a clear image of a desired condition. A standard is a clear image of a desired condition. ● Standards make abnormalities obvious so that corrective action can be taken. - A good standard is simple, clear and visual. - Standards are linked to action and posted at the point of use
  • 5.
  • 6.
    Workplace Organization :6S’s A simple common sense system comprising of the following steps ● Sort (Organization) ● Set in order (Orderliness) ● Shine (Cleanliness and inspection) ● Standardize (Standard Operating Procedure-SOP) ● Sustain (Self-discipline) ● Safety S.O.E. (1) Share information Workplace organization and standardization (2) Share standards (4) Alarms (5) Stop defects (6) Eliminate defects (3) Build standards into the workplace V i s u a l D i s p l a y s V i s u a l D i s p l a y s 6Ss 6Ss V i s u a l C o n t r o l s V i s u a l C o n t r o l s
  • 7.
    Building A Foundation ● ●A good 6S condition, in other words, a A good 6S condition, in other words, a clean, safe well ordered workplace that clean, safe well ordered workplace that talks to you with visual aids is the talks to you with visual aids is the foundation of improvement. foundation of improvement. The 6S system also establishes discipline in the workplace The 6S system also establishes discipline in the workplace that can be used later when additional tools are added. that can be used later when additional tools are added.
  • 8.
    Shine (Cleanliness) Clean everything,eliminate all sources of contamination, find ways to keep the workplace clean, adopt cleaning as a form of inspection, make cleaning a part of everyday work Sort Sort out what is needed and what is not needed. When in doubt throw it out! Sustain ( Self discipline) Sustain improvements to prevent backsliding. Stick to the SOP’s (make correct procedures a habit, properly train all staff, inspect the workplace daily) Safety Always consider the Safety of the Workplace Set in Order A place for everything and everything in its place. ( Keep everything that is needed in an orderly fashion so that Things can be accessed easily) Standardize ( adherence) Create the rules by which the first 3Ss will be implemented and maintained (Make standards so that any abnormality becomes obvious) The focus of 6S activity is to organize the workplace in order to make it more productive and safe The 6S’s
  • 9.
  • 10.
    First S :Sort “when in doubt throw it out” ● Remove all unnecessary items from the work place. ● Define what is needed to meet production goals and remove everything else. ● Key tool – Red Tagging - Item classification - Item ID and Quantity - Reason for red tagging - Work section - Date
  • 11.
    Sort Standards ● ● Whatis needed and not needed What is needed and not needed ● ● Red-tag targets Red-tag targets ● ● Red-tag frequency Red-tag frequency ● ● Red-tag responsibilities Red-tag responsibilities ● ● Disposal procedures / authority Disposal procedures / authority
  • 12.
  • 13.
  • 14.
    Is this youroffice?
  • 15.
    Where is thesize Small for my order?
  • 16.
  • 17.
    First S :Sort and Red Tagging ● ● A visible way to identify items that are A visible way to identify items that are not needed or in the wrong place not needed or in the wrong place - - Establish the rules Establish the rules - - Identify unneeded, misplaced items Identify unneeded, misplaced items - - Attach red tags Attach red tags - - Move identified items to a holding area Move identified items to a holding area - - Red-tag safety problems Red-tag safety problems - - Dispose of truly unneeded items Dispose of truly unneeded items
  • 18.
    Red Tag Sample Name: Date: Locationof item: Reason for red tagging:
  • 19.
    Red-Tag Holding Areas ●Are used for temporary storage ● Should be in a located nearby ● Needs someone to be responsible for it ● Needs to be cleared out often (Weekly?) ● Should be highly visible ● Should be centrally located ● Should be clearly identified ● Should have a clear disposal procedure
  • 20.
  • 21.
    Red Tagging ● ● Setup a red-tag removal location. Set up a red-tag removal location. ● ● Schedule a red-tag pause Schedule a red-tag pause ● ● Explore recycling options Explore recycling options ● ● Set up a capital assets disposal procedure Set up a capital assets disposal procedure ● ● Measure red-tag volume (make it visual) Measure red-tag volume (make it visual) ● ● Commit to regular red-tagging Commit to regular red-tagging
  • 22.
    Sort Materials at aisles,stairs, corners are present Unneeded equipment, tools, Furniture etc. are present Unneeded inventory, support materials, parts Or materials are present
  • 23.
    The Second S Setin Order A place for everything and everything in it’s place.
  • 24.
    Set in OrderStandards “A place for everything and everything in it’s place”
  • 25.
    The Second S:Set in Order ● Organize what’s left to minimize wasted motion. ● Draw to scale the current state of the physical layout on a Current State Map
  • 26.
    Set in OrderStandards ● What signboards should look like and where they should be placed. ● What different colors mean ● Where people can walk ● Dangerous areas ● What protective clothing is required ● What equipment signage and footprints should look like.
  • 27.
    Examples: Set inOrder Correct places are not obvious for materials Materials are not in their right places
  • 28.
    Examples: Set inOrder Height limits are not obvious
  • 29.
    Examples: Set inOrder button  after  before
  • 30.
    Examples: Set inOrder Cupboards for operator personal belongings  after  before
  • 31.
    Examples: Set inOrder Broken needle part scanning with magnet. Magnets for broken needles.
  • 32.
  • 33.
    Examples: Set inOrder Storage of markers on the shop floor
  • 34.
    Examples: Set inOrder Color-coded trolley to put repair/rework, B/C grades Supermarket area for cut parts
  • 35.
  • 36.
    Examples: Set inOrder Specially designated trolley for elastic (seperated by size)
  • 37.
  • 38.
    Examples: Set inOrder Sewing threads Spare machine area – in front of sewing line
  • 39.
  • 40.
    Set in OrderSuggestions ● Invite team members to inspect Current State map and comment on: - Current hassles - Countermeasures - Comments Leave the Map up for one week to invite comments Leave the Map up for one week to invite comments
  • 41.
    Example: Area Map Shelf Iron- interlining FabricInspection numbering FIRST FLOOR CURRENT STATE Laborato ry Sorting Fabric Lay & Cutting Fabric warehouse Tape WIPE Delivery and shipping WIPA WIPB WIPC WIPF WIPD 32m 27m 28m 26m 1.5m 15m 10m 10m 39m
  • 42.
    Example: Area Map 13 6 5 7 2 10 9 12 11 16 15 18 17 20 32 8 34 22 33 Line 2 Folding and polybagging SEWING IRONING PACKING AREAS CURRENT-STATE (STYLE : xxx) 12 m R R 35 elevator SEWING LINES Line 3 Line 1 Stain Removal EOL Inspection 27 m irons Cut parts 14 13 12.3 m 6 meters packing 1.7 m 9 m 34m 12.5 meters 1.5 m 4.3 m 23 21 25 19 28 29 26 27 30 31 24
  • 43.
  • 44.
    KAIZEN ● Three areasto work on: (Current-State Map) - Fabric warehouse, Decoration and Sewing - Use color-coded post-it’s to represent equipment places (machine, table, stand, etc.) - Walkways - Draw Material movement - Measure distances and indicate - Inspect for flow, health and safety issues and any unpleasant suprises.
  • 45.
    Organize and ApplyColors ● The 3 Keys to Organizing - Where? - What? - How Many? ● Fix Positions - Equipment – Materials, mark the floor position - Tools and Gauges – make a shadow board showing outline - Parts and Materials, - make a grid system that identifies position. - Show number of units using a visual system identifying max./min. levels - Mark walkways, mobile equipment routes, perimeter of opening doors, health and safety issues.
  • 46.
    Develop Color Standards Yourobjective should be transparency, the location of everything must be so clear that: ● Anyone can find anything at any time ● Out of Standard situations are obvious to everyone
  • 47.
    Visual Systems ● Agroup of visual devices designed to share information at a glance. ● Four Visual Systems in increasing power. - Visual indicator - tells (street signs) - Visual signal – grabs attention (traffic light) - Visual control – limits behavior (parking lot lines) - Guarantee – Allows correct response only (gas station automatic pump shut off) “ “develop visual systems that talk to everyone” develop visual systems that talk to everyone”
  • 48.
    Set in OrderFuture-State ● Address comments collected from the team members ● Respond to each suggestion on posted chart. ● Minimize wasted motion ● Show material flows ● Draw the Future State Map Leave the Map up for one week to invite comments Leave the Map up for one week to invite comments
  • 49.
  • 50.
    Conveyance (in-house) Fabric storagetrolley before spreading Wheeled Trolleys for cut parts, Waste Carts / Bins Waste trolley for cut parts
  • 51.
  • 52.
  • 53.
    Conveyance (in-house) Containers aresent to upstairs via conveyor Carton loading / unloading ramp Trolley for repair/rework B/C grades
  • 54.
    The Third S Shineand Inspect
  • 55.
    The Third S:Shine and Inspect The 6S team must decide: - What to clean (targets) - How to clean (methods) - Who will do the cleaning (part of ea. Job) - How clean is clean Develop check sheets outlining what should be cleaned. Be as specific as you can. Inspect for sound, smell, vibration, temperature or other signs. Train team members to solve root cause of cleanliness problems.
  • 56.
    The Third S:Shine (Cleanliness and Inspection) ● Clean everything ● Eliminate all sources of contamination ● Find ways to keep the workplace clean ● Adopt cleaning as a form of inspection ● Make cleaning a part of everyday work
  • 57.
  • 58.
  • 59.
    Shine Examples Maintenance –shadow board spare parts boxes
  • 60.
    Shine Examples Other cleanlinesissues (any type) are present Equipment are not kept clean, dust and oil
  • 61.
    Shine Examples Trimmed partsare not allowed to fall down onto the ground. Elimating dust helps to reduce/ eliminate stains over the product and also has a positive effect for worker’s health. Air pipe to clean station at the end of the shift. Cleaning has become a daily routine task.
  • 62.
    Shine Examples –Preventive Maintenance Sheet MACHINE NAME:................................................................................................................................... DATE:......../...../....... CODE:............................................................................................ WEEK NO:................. CHECK POINTS RESP. MON TUE WED THU FRI SAT SUN THREAD INSTALATION METHOD OP. RIGHT NEEDLE SELECTION AND CONDITION OP. CHECK SHUTTLE AND BOBBIN OP. POWER SWITCH OFF (DURING BREAK AND END OF SHIFT) OP. DOES BOBBIN WRAP UP PROPERLY WORK? OP. PUT A PIECE OF FABRIC UNDER MACHINE HEAD (OIL STAINS) OP. OTHER ABNORMALITIES (Mechanical, Electricity, Pneumatic) OP. CHECK & CLEAN MACHINE MOVING PARTS (Breaks, after shift) OP. CHECK # STITCHES IN CM OP. CHECK OIL LEVEL AND FLOAT OP. MACHINE CLEANLINESS MA LUBRICATE MACHINE MOVING PARTS (Button, Piping, Thread Wrap up, Punterez) MA CHECK BELT TENSION OP. CHECK CUTTING KNIFE OP. ARE MACHINE PARTS COMPLETE OVER THE MACHINE? OP. 1500 FRM.03 24.01.2002/00 OP. OPERATOR DONE, GOOD ? MA MECHANIC BREAKDOWN X PREVENTIVE MAINTENANCE, CLEANING & LUBRICATION CHECKLIST
  • 63.
  • 64.
    The 4th S:Standardize ● The best standards are clear, simple, visual. Effective standards make the out of standard condition obvious. ● Example: Shadow Board for Tooling - What tools should be here - What tools currently are here - Who has taken a tool and when they will return it.
  • 65.
  • 66.
    The 4th S:Standardize ● Create the rules by which the first 3 Ss will be implemented and maintained: - Standardize red-tag procedures - Standardize rules for red-tag holding areas - Standardize location, number, and position of all items - Standardize cleaning/maintenance schedules and SOP’s
  • 67.
    SOP’s on Machinesat each process step
  • 68.
    SOP’s on Machinesat each process step OPERATION SLEEVE COVERSTITCH MACHINE COVERSTITCH STANDARD WIP 1 TIME (sec.) WORK SEQUENCE 1.TAKE PART 3 2.SEW 10 3.TRIM 7 4.INSPECT 3 5. LEAVE THE PART 2 TOTAL CYCLE TIME 25 TAKT TIME 25 Standard Operating Procedure 8
  • 69.
    SOP’s on Machinesat each process step OPERATION ATTACH NECK PIPING & NECK TOP STITCH MACHINE SINGLE NEEDLE STANDARD WIP 1 TIME (sec.) WORK SEQUENCE 1.TAKE THE PART 2 2.ATTACH NECK PIPING 6 3.CUT PIPING 3 4.NECK TOP STITCH 5 5. CUT PIPING 3 6. TRIM 2 6. INSPECT 2 7. LEAVE THE PART 2 TOTAL CYCLE TIME 25 TAKT TIME 25 Standard Operating Procedure 4
  • 70.
    Standardized Process Sheets -Standard Cutting Job Orders - Standard Sewing Instructions/Critics Sheet - Stadard Charts - Standard Line Balancing Sheets - Standard Cell Layout Sheets - Standard SOP Sheets
  • 71.
    Standardization ● When weachieve 100 percent adherence to standards, 50 percent of our problems automatically disappear. ● 6S must be made a part of our standard work. Time must be set aside for this activity. ● A score card should be used to measure 6S condition which has been tailored to our workplace.
  • 72.
    Examples: Standardization Cleaning padusage for oil leaknening (break, at the end of shifts) spare machine clothes, or clothes after shift
  • 73.
    Examples: Standardization Discipline –All scissors are tied Discipline: Metal-Free policy
  • 74.
    Examples: Standardization Floors arewiped frequently - Fleece Cleaning is made daily operator’s task Preventive Maintenance Sheets are regularly filled in
  • 75.
  • 76.
    The 5th S:Sustain ● In order to sustain 6S involvement is the key. ● 6S must belong to all our team members. ● Keys to Success: - Promotion - Communication - Training
  • 77.
    The 5th S:Sustain Stick to the S.O.P.’s: ● Make correct procedures a habit ● Properly train all office and factory staff ● Get shared agreement from office and factory staff about changes and work habits ● Achieve order in the workplace and run it by agreed upon S.O.P.’s
  • 78.
    How to Achievethe Fifth S: Sustain  Practice, practice, practice  Educate everyone in 6S  Continuously improve  Inspect the workplace daily  Give feedback to operators  Coach the team  Facilitate implementation  Follow the SOP
  • 79.
    6S Promotion andCommunication ● 6S Report Boards Targets, current status, “6S catch of the month”, before and after photographs ● 6S catch of the month Recognize excellent 6S work ● 6S slogan or logo contests Involve team members in giving their activity a unique identity ● 6S core group This team is responsible from sustaining 6S. Ask for a volunteer from each plant operating area.
  • 80.
  • 81.
    6S Training ● 6Straining must be incorporated in your overall Lean Training Program - Team member: introduction to 6S - 2 hours - 6S core group members: implementing 6S – 1 day - Supervisors and managers: implementing 6S – 1 day “ “6S training has a quick payback and introduces the 6S training has a quick payback and introduces the language of Lean, and lays the foundation for all future activity” language of Lean, and lays the foundation for all future activity”
  • 82.
  • 83.
  • 84.
    The 6th S:Safety ● No change should be made that would jeopardize safety. ● All Kaizen activities must be within the SOE guidelines. ● Every worker should be empowered to stop the process if any safety risk is present. ● Safety training should be provided to workers
  • 85.
    Examples: Safety Before After Doublelight bulbs with caps to ebanle better lighting on the shop floor.
  • 86.
    Examples: Safety Before: Steelgloves are not used. PPE training should be provided to workers
  • 87.
    Examples: Safety Needle guardsare installed and in use
  • 88.
    What Managers andLeaders Can Do?  Make 6S part of the daily work  Make 6S part of job descriptions  Reward and recognize good work  Provide resources  Be visibly interested  Make frequent visits to the work area  Allow time for 6S activities
  • 89.
    People are theKey ● Remember in implementing 6S: - Shared agreement occurs at different rates - People learn at different speeds - Areas are implemented at different times ● Get everyone involved and keep them involved
  • 90.
    Tools ● 6S WorkplaceScan (Checklist) - Gives overall view of the factory condition ● Visual Workplace Development Chart - used to develop visual displays and controls at the workplace. - Establishes baselines for current conditions - Establishes targets for improvement
  • 91.
    Score Card -Cutting NO CRITERIA REMARKS SCORE OBSERVATIONS 1 Unnneded/unused markers are scattered around/found 2 markers are not stored neatly ( over tables or on the ground) 3 markers are not easily accessible (no clor-coded, per customered, etc.) 4 fabric rolls are found on the floor 5 Fabric rolls waiting to be layed are not job order sequence. (in front of laying) 6 Cutter driver is out of order and cutter can only be transported to next table manually by pushing 7 Sensros for counting marker ply height are out of order. Operator counts manually. 8 Fabric rolls are not stored in shelves and placed over pallettes on the ground (inside warehouse) 9 Waste bins are notremoved from the area frequently / missing waste bins. 10 Wastes are not being seperated and stored as fabric, paper and polybag. 11 Fabric laying operators cut tapes by teeth ( while laying bottom of fabric rolls). This against worker health. 12 Hourly production output is not monitored ( no data on board) / Lack of cell supervision 13 Floors are not clean, dirty, dusty and full of fabric lints. 14 Delayed orders are available 15 Personal belongigns are around 16 Air orelectricity pipes/plugs are not dressed and lay on the floor. 17 Unneded equipment found (desk, chair, ) 18 Supervisor's desk untidy and disorganized. (documents, job orders, etc.) 19 Unneeded/unprocessed job orders waiting on table. 20 Insufficient number of trolleys for cut parts 21 Excessive/leftover fabric inventory is too high and occupies space and shelves/ no regular disposal. 22 Steel gloves are not used by cutting operators. ( during bandknife cutting - though available) 23 Markers are layed over-and-over (over the table) due to limited space and poor cutting efficiency. 24 Fabric relaxing times are not obeyed. 25 Marker ply height are not clearly stated as SOP / not obeyed during laying 26 Job orders are not clear and easily understood 27 KPI Board is not recorded / monitored 28 Plotter room is at far distance 29 No procedure is available for returning leftover fabric back to wrehouse area. (after cutting) 30 Fire hoses and extinguishers or emergency exits are blocked
  • 92.
    Score Card -General NO CRITERIA DESCRIPTION SCORE OBSERVATIONS 1 Removing Unnecessary items All items not necessary for performing work are removed from the workplace. Only tools and materials, and jigs are present at work stations 2 Storage of cleaning Equipment All cleaning equipment is stored in a neat manner; handily and easily available when needed. 3 Floor Cleaning All floors are clean and free of debris, oil and dirt 4 Bulletin Board No outdated, torn or soiled announcements are displayed. All bulletins are arranged in a straight and neat manner. 5 Emergency Access Fire hoses and emergency equipment are unobstructed and stored in a prominenetly, and are easy to locate. Stop switches and breakers are marked or color-coded for easy visibility 6 Items on Floor Work in process, tools, and any other material are not left to sit directly on the floor. Large items which must be positioned on the floor are in clearly marked areas delineated by painted lines 7 Aisleways Marking Aisles and walkways are clearly delineated and can be identified at a glance. Lines are straight and at right angles with no chipped or soiled paint. 8 Aisleway Maintenance Aisles are always free of material and obstructions.Nothing is ever placed on the lines and objects are always placed at right angles to the aisle lines. 9 Storage and Arrangement Storage of boxes, containers and material is always neat and at right angles. When items are stacked, the are never crooked, or in danger of toppling over. 10 Equipment Painting All machines and equipment are painted and kept clean by routine care. 11 Equipment Cleanliness Machines and equipment are kept clean and unsoiled by daily care. Glass (windows) and work surfaces are kept clean free from contamination. Guards and sields are used to keep chips and oils from falling on the floor. 12 Equipment Maintenance The controls of machines are properly labeled and critical points for daily maintenance checks (e.g. Fluid and lubrication levels) are clearly marked. Equipment check sheets are neatly displayed and and kept clean and updated. 13 Tool & Material Storage Nothing is placed on top machines, cabinets, or other equipment. Nothing leans against the walls or columns. 14 Document Storage Only documents necessary to the work are stored at work stations. Such documents and binders are stored in a neat and orderly manner. 15 Document Control All documents are labeled clearly for content and responsibility for control and revision. No unlabelled binders or documents are present. Obselete or unused documents are routinely purged. 16 Arrangement of Gages & Tools Tools, jigs and fixtures are arranged neatly and stored in way that they are kept clean and free of any risk of damage. 17 Ease of Access to Tools & Gages Tools, jigs and fixtures are arranged so that they can be easily accessed when changeovers or setups are made ( thus facilitating productivity). The same is true for gages and measuring equipment used to check quality. 18 Arrangement of shelves, benches, and desks These are arranged, divided and clearly labeled such that it is obvious where things are stored and where they should be returned. 19 Upkeep of shelves, benches, and desks These are kept free of unused objects, including files and documents. Tools and fixtures are cleaned before being replaced to proper position. 20 Sustaining 6S A disciplined system of control and maintenance exists to ensure that each of the above items are maintained at the highest possible level. It is the responsibility of management to maintain this system.
  • 93.
    Score Card -Sewing NO CRITERIA REMARKS SCORE OBSERVATIONS 1 Unneeded templates are around 2 Unneeded sewing thread bobbins 3 Thread bobbins on the ground 4 Missing labels on cartons/boxes (e.g. Repairs) 5 Sliders missing/broken on overlock machines, waste bins missing 6 Labels found over the table / around 7 Oil leakage from machine pipes 8 Hourly KPI'S are not monitored and recorded (on board) 9 Color coded KPI indicators are not changed/updated hourly 10 Floors are dirty / dusty 11 Broken needle found/evidence over the sewing machine table 12 Ex-garments found on the line though shipment was made 13 Personal belongings exist (mobile phone, bags, jacket, shoes) 14 Water bins are found 15 Air pipes / electricity wires are on the ground and not dressed well 16 Unneeded equipment (table, chair, stands, machine,tools etc.) 17 Waste bins are not clearly placed under the sewing machines 18 Line supervisors's desk untidy (documents, etc.) 19 AD's and Sewing Instructions) are found on the line (they should be at supervisor's desk) 20 Scissors, tweezers are not tied / missing magnets 21 Fire hoses / entinguishers / emergency exits are blocked
  • 94.
    Tools How many SOEcorrected actions remain to be completed? How many hazards or danger areas do you have unmarked? Safety (self discipline) Stick to the SOE Policy How many workers have not had SOE training? Are all safety exits marked and clearly understood by the workforce? How many injuries have you had this year in the workplace? Set in Order (Organization) Number of times that personal belongings are not neatly stored Stick to the rules How many workers have not had 5S training? Number of times job aids are not available or up to date Number of times, last week, daily 5S inspections were not performed Workplace Scan Diagnostic Checklist 0 0 0 0 1 Level - 3 None Level - 4 3 or 4 Level - 1 2 Level - 2 Number of Problems Rating Level 5 or More Level - 0 0 0 Category Item Total Score Distinguish between what is needed and not needed Unneeded equipment, tools, furniture, etc. are present Unneeded items are on walls, bulletin boards, etc. Date Rated Items are present in aisles, stairways, corners, etc. Unneeded inventory, supplies, parts, or materials are present Safety hazards (water, oil, chemical, machines exist Sort (Organization) Shine (cleanliness) A Place for everything and everything in it's place Correct places for items are not obvious Items are not in their correct places Aisles, workstations, equipment locations are not indicated. Items are not put away immediately after use Tools & gages cannot be easily accessed when changeovers or set ups are made Standardize (adherence) Cleaning and looking for ways to keep it clean organized Floors, walls, stairs, and surfaces are not free of dirst, oil, grease. Equipment is not kept clean and free of dirt, oil and grease. Cleaning materials are not easily accessible Lines, labels, signs, etc. are not clean an unbroken Other cleaning problems (of any kind) are present. All standards are not known and visible. Sustain (self discipline) How many times, last week, was daily 5S not performed? Checklists do no exist for all cleaning and maintenance jobs. How many items can not be located in 30 seconds? All quantities and limits are not easily recognizable Maintain and Monitor the first 3 categories Necessary information is not visible Height and quantity limits are not obvious
  • 95.
  • 96.
    Creating a VisualWorkplace ● ● A Visual Workplace should be A Visual Workplace should be : : - - Self-explaining Self-explaining - - Self-ordering Self-ordering - - Self-improving Self-improving ● ● Out of standard situations should be immediately Out of standard situations should be immediately obvious and employees should be obvious and employees should be empowered empowered to correct them easily to correct them easily. .
  • 97.
    The Visual WorkplaceVision In a visal workplace anyone anyone will know these aspects, of an area, within five minutes : - Who ? - Where ? - What ? - Why ? - When ? - How ?
  • 98.
    Exercise: Your Visual WorkplaceVision How would you describe the way your factory or office should look in terms of: - The physical environment: ● Cleanliness ● Inventory organization ● S.O.E. compliance - Product or Process focused - Understanding the status of individual customer orders: ● Level of completion in the factory ● Location in the factory
  • 99.
    Visual Workplace Supports the“Eight Zeros” • Zero waste • Zero customer complaints • Zero downtime • Zero defects • Zero injuries • Zero delays • Zero loss • Zero changeovers
  • 100.
    The Visual ManagementSystem (1) Share information Workplace organization and standardization (2) Share standards (4) Alarms (5) Stop defects (6) Eliminate defects (3) Build standards into the workplace V i s u a l D i s p l a y s 6Ss V i s u a l C o n t r o l s
  • 101.
    Visual Management Triangle •DeliveryCommitments •Goals and Schedules •Management Rules SEEING as a Group •Production/Project Status •Adhere to Timeline •Inventory Levels •Machine Availability KNOWING as a Group •SOE Requirements ACTING as a Group •Consensus on rules and objectives •Involvement in improvement activities •Adhere to Deliverables Wall charts support the visual management triangle. They involve the team and compel action.
  • 102.
  • 103.
    Visual Systems ● Agroup of visual devices designed to share information at a glance. ● Four Visual Systems in increasing power : - Visual indicator - tells (street signs) - Visual signal – grabs attention (traffic light) - Visual control – limits behavior (parking lot lines) - Guarantee – Allows correct response only (gas station automatic pump shut off) “develop visual systems that talk to everyone”
  • 104.
    Overview: Visual Display Definition of visual display Definition of visual display  Display categories Display categories  The need for information The need for information  Location indicators Location indicators  Types and examples of visual displays Types and examples of visual displays  How to implement visual display How to implement visual display
  • 105.
    Definition of VisualDisplay A method to visually communicate a A method to visually communicate a statement of essential information. statement of essential information. Examples : - SOP - SOE - Storage locations - Quality points - Equipment needs 5 Visual Control 4 Visual Metrics 3 3 Visual Display Visual Display 2 Workplace Organization 1 Project Identification
  • 106.
    Examples of VisualDisplay  Signboards  Status boards  Product displays  Area maps  Process maps  Location indicators and labels  Checklists  Worksheets  Flow diagrams
  • 107.
    Location Indicators ● Show: -What is located where? - How many should be there? ● They are the first type of display to be implemented
  • 108.
    Guidelines for LocationIndicators To indicate locations : To indicate locations : - Address signboards Address signboards - White location lines White location lines - Labels Labels To set limits : To set limits : - Red height lines Red height lines - Yellow limit lines Yellow limit lines - Standard container sizes Standard container sizes To indicate danger : To indicate danger : - Red “danger” signs Red “danger” signs - Black and yellow hazard tape Black and yellow hazard tape
  • 109.
  • 110.
  • 111.
  • 112.
  • 113.
  • 114.
  • 115.
  • 116.
  • 117.
  • 118.
  • 119.
  • 120.
  • 121.
  • 122.
  • 123.
  • 124.
  • 125.
    Examples of VisualDisplay Packing defects
  • 126.
  • 127.
  • 128.
    Examples of VisualDisplay Approved sample posted
  • 129.
    Examples of VisualDisplay How to Inspect? - Apparel
  • 130.
  • 131.
    Examples of VisualDisplay Man in the Shop Floor color-coded
  • 132.
    Examples of VisualDisplay Stain (Pink) Fold & Pack (Brown) Q.C. / Inspector (Red) Ironer (Yellow) Material Handler (Blue) Operator
  • 133.
    How to ImplementVisual Display  Identify the categories to focus on based Identify the categories to focus on based on factory objectives on factory objectives  Identify the problems associated with those categories Identify the problems associated with those categories  Identify who needs to see the display Identify who needs to see the display  Determine the best location Determine the best location  Develop and test the display Develop and test the display  Finalize and implement the display Finalize and implement the display
  • 134.
  • 135.
  • 136.
  • 137.
  • 138.
    Examples of VisualDisplay Finished Product Storage Area Waiting area for products to be dedected On-going production products – Waiting cartons Metal-Free Zone Inspected cartons area Dedected chidrens’s wear
  • 139.
    Computers vs. VisualManagement ● ● Computers are not for group communication, they Computers are not for group communication, they lack a public interface. lack a public interface. ● ● When computers offer expanded visibility (graphic When computers offer expanded visibility (graphic displays) they will play a larger role on the factory displays) they will play a larger role on the factory floor. floor. Information must be Information must be visible visible, available , available where where it is it is needed, and as close to needed, and as close to real time real time as possible. as possible.
  • 140.
    Visual Workplace Development Chart TargetArea: People: Sort 2. Workplace organization: Area Baseline Information: Safety Measurement Baseline Data Sustain Check List Shine Set in Order Environment Display method Quality Storage Operations Audience Operations 1. Project Identification Area Purpose/Function: Team Members: Photos Area Map Identify: Safety Tracking method Quality Equipment Location Equipment Standardize Storage 4. Visual Metrics: 3. Visual Display: Environment Safety 5 Visual Control:
  • 141.
  • 142.
  • 143.
    Definition: Visual Metric ●Visual display of a key measurement (KPI) indicating the changing status of any process: - Supply chain - Support functions - Manufacturing - Product Development - Quality
  • 144.
    Overview : VisualMetrics • Role of Visual Metrics: – Use data appropriately – Keys to effective reporting and analysis – What people need to make decisions – Characteristics of “new” measures • Examples of activity boards • How to develop visual metrics 5 Visual Control 4 4 Visual Metrics Visual Metrics 3 Visual Display 2 Workplace Organization 1 Project Identification
  • 145.
    Don’t collect dataif you are not going to use it!
  • 146.
    Use Data Appropriately ● ●To keep management and To keep management and operators informed operators informed of of progress progress ● ● To drive and fine-tune To drive and fine-tune improvement activities improvement activities ● ● To educate the To educate the factory factory staff staff ● ● Display at point of use Display at point of use Project Name
  • 147.
  • 148.
  • 149.
  • 150.
  • 151.
  • 152.
    Info Boards -Sewing Operator skill chart, Line Layout per style, Line Balancing Sheet, weekly RFT, productivity reports, CEOE, attendance list, color-coding definitions for shop floor, 6S Checklist and scores.
  • 153.
    Plan to ActualBoard - Sewing
  • 154.
    Visual Plan toActual Board
  • 155.
    Production Status –Visual KPI’s
  • 156.
  • 157.
    Plan to Actual& Info Boards (KPI)
  • 158.
  • 159.
    Keys to EffectiveReporting and Analysis  Involve operators in measurement Involve operators in measurement  Provide results to people who can take action Provide results to people who can take action  Present results in the appropriate form for audience Present results in the appropriate form for audience  Visually link results with spesific improvements Visually link results with spesific improvements  Report data in at the frequency required for timely Report data in at the frequency required for timely decision making decision making
  • 160.
    Role of VisualMetrics in Measurement  Makes data easy to understand and react to Makes data easy to understand and react to  Exposes and explains the waste Exposes and explains the waste  Shows improvements made and those Shows improvements made and those left to implement left to implement  Doesn’t rely on written language to Doesn’t rely on written language to communicate information communicate information
  • 161.
    Characteristics of the PerformanceMetrics  Change over time Change over time  Are simple and easy Are simple and easy to use to use  Provide fast feedback Provide fast feedback  Foster improvement Foster improvement  Directly relate to strategy Directly relate to strategy  Are non-financial measures Are non-financial measures  Vary between locations Vary between locations
  • 162.
    Managers Look atTrends: Factory- wide Performance Actual Target Target Time B grade, C grade, Rework Costs
  • 163.
    Can Problems beSolved Effectively with This Data? 0 5 10 15 20 25 30 35 40 Day 1 Day 2 Day 3 Day 4 Day 5 Produced Good B grade rework
  • 164.
    Can Problems beSolved Effectively with This Data? Defects Found 0 5 10 15 20 25 30 Stain Skipped Stitch Label Needle Hole Dropped Stitch
  • 165.
    Decide: When YouDevelop Visual Metrics  What needs to be measured What needs to be measured  Who the user will be Who the user will be  How to keep track of the details How to keep track of the details  How often to take the data How often to take the data  Who will do the tracking Who will do the tracking  How to display the data How to display the data  Where to locate the display Where to locate the display  Where is data needed / useful Where is data needed / useful
  • 166.
    End of LineInspection Report 2.7% 0.3% 0.0% 1.0% 0.1% 1.1% 1.7% 0.0% 0.1% 0.0% 0.0% 0.6% 0.0% 3.8% 4.2% 0.5% 0.0% 0.0% 0.0% 0.1% 0.9% 3.1% 0.0% 0.5% 1.0% 1.5% 2.0% 2.5% 3.0% 3.5% 4.0% 4.5% Defect Rate (%) Defect Type EOL Report (Week 51) - Factory-wide
  • 167.
  • 168.
  • 169.
    Overview: Visual Control ●Definition of visual control ● Levels of control ● How to develop visual controls 5 5 Visual Control Visual Control 4 Visual Metrics 3 Visual Display 2 Workplace Organization 1 Project Identification
  • 170.
    Definition: Visual Control ●Visual controls are methods and devices that alert employees that specific actions need to be taken. - Undesirable condition in the process - Schedule production activities - Safety issues (SOE) - Inventory status
  • 171.
    Levels of theVisual Workplace (1) Share information Workplace organization and standardization (2) Share standards (4) Alarms (5) Stop defects (6) Eliminate defects (3) Build standards into the workplace V i s u a l D i s p l a y s 6Ss V i s u a l C o n t r o l s
  • 172.
    Example: Visual Control Designatedplaces for finished products at the end of sewig lines
  • 173.
    Example: Visual Control Designatedplaces for cut parts trolleys in front of sewing lines
  • 174.
    Example: Visual Control Designatedplaces for cartons at the end of sewing lines
  • 175.
  • 176.
    Example: Visual Control Groundmarking for Carton Pallettes
  • 177.
    Example: Visual Control Color-codingsystem – Cut parts polybags to be sent to different factories / subcontractors / satellites
  • 178.
    Example: Visual Control Repair Tobe Inspected Inspected - Good Rework – Stain/Dirt
  • 179.
  • 180.
    Levels of VisualControl for Switching off Automobile Lights Clearly labeled light switch Instructions are in manual Instructions posted on dash board Bell sounds if door is opened Device prevents key removal Lights switch off when engine is turned off
  • 181.
    Steps of VisualControl 1. Define the problem 1. Define the problem 2. What needs to be controlled ? 2. What needs to be controlled ? 3. What is the desired result ? 3. What is the desired result ? 4. Identify facts / information 4. Identify facts / information 5. Evaluate improvement ideas 5. Evaluate improvement ideas 6. Test ideas for implementation 6. Test ideas for implementation 7. Implement & measures results 7. Implement & measures results
  • 182.
    Visual Control Step1: Define the Problem • Workplace Workplace environment environment • Safety Safety • Storage Storage • Production Production • Equipment Equipment • Quality Quality
  • 183.
    Visual Control Step2: What Needs to be Controlled? ● For the category you selected, decide what needs to be controlled ● Write the items on a card ● post them on the development chart ● Control cards should be: Pink
  • 184.
    Visual Control Step3: What is the Desired Result? ● Set a target result for what needs to be controlled ● Be specific; quantify if possible ● Ask: When we achieve the desired control level, what will be the tangible benefit? ● Write the target on a card ● Post it on the development chart ● Target cards should be: Pink
  • 185.
    Visual Control Step4: Identify Facts and Information ● Information needed for problem solving by the team. ● Collect information from the problem area employees. ● Identify current standards or lack of standards ● Evaluate adherence to standards ● Gather feedback on operations and activities ● Fact cards should be: Yellow
  • 186.
    A Review: CardWriting Guidelines ● Write only one activity, fact, or idea per card ● Be specific and clear ● Use a full sentence, not a phrase or word ● Sign and date the card ● Write clearly so that others can understand what you write
  • 187.
    Visual Control Step5: Evaluate Improvement Ideas ● Brainstorm ideas about how to control each activity and post ideas on a chart ● Evaluate the control level and potential impact of each idea ● Idea cards should be: Blue
  • 188.
    Visual Control Step6: Test Ideas for Implementation ● Decide which ideas to use ● Determine time-line ● Assign responsibilities ● Get authorization ● Check guidelines for effective implementation ● Test Ideas
  • 189.
    Visual Control Step7: Implement and Measure Results ● Compare actual results to expected outcomes (Visual Metrics) ● Implement improvement as part of daily work and include in SOP’s ● Implementation cards should be: Pink
  • 190.
    Visual Controls Can: Communicate needed information clearly  Show standards clearly  Control targeted bahavior / process  Require little cost to implement  Be easy to implement
  • 191.
    Exercise: Visual Controls ●What are examples already in use for : - Visual Controls - Visual Metrics - Visual Displays
  • 192.
    Managers and Supervisors ●Draw an area map for your department: - Label the location of each item and elements of processing (operations, movements, stores, inspections) - Show the flow of material and people by using arrows ● Complete the workplace diagnostic checklist ● Identify additional baseline measures ● Collect baseline data
  • 193.
    Visual Display andControls 1. Man in Shop Floor Who Color Operator pink Line Supervisor white Ironer grey Inspector In-Line / EOL (Q.C.) light green Packing light blue Mechanic yellow Material Handler red  Colors can be determined by your own staff
  • 194.
    Visual Display andControls 2. Materials What Color Materials before processing blue Materials after processing green Defects, rework, off grade, waiting red Corridor, aisles, working area yellow Other movablearticles: e.g. Empty boxes, trolley, stands etc. picture  Pictures related to Color-coding standards can be taken and posted on a board for training purpose
  • 195.
    Visual Display andControls 3. Operating Stations What Color Material shortage / Load material Unload Finished Goods Defects, quality problem that needs help from Supervisor Machine Breakdown Style Changeover
  • 196.
    Visual Display andControls 4. Production Status Metrics Criteria Symbol Output (pcs/hr) Output >= 110,000 100,000 =< Output < 110,000 Output < 100,000 Quality (%) RFT>=97% 95= < RFT <97% RFT < 95% Work-in-Process (WIP) WIP =< 40 pieces 40 <WIP =< 60 WIP >60 pieces
  • 197.
    Visual Display andControls Metrics Criteria Symbol OEE (%) OEE >= 85% 80% =< OEE < 85% OEE < 80%  These symbols and figures can be posted on a 90 cm * 60 cm board (film, slide)