Download to read offline

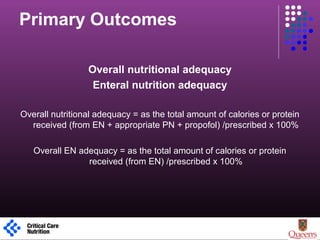
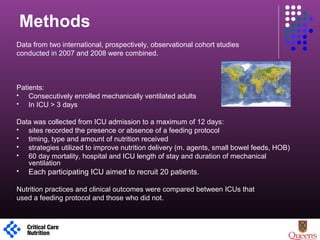


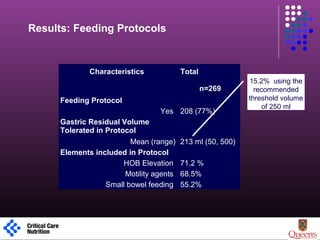
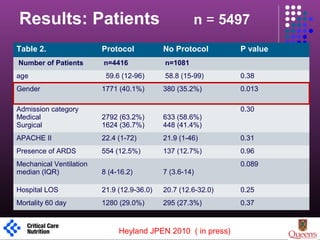
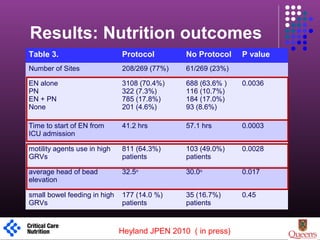
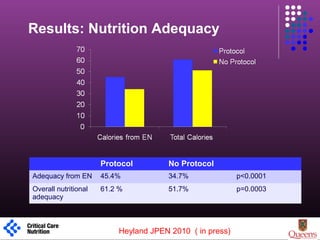
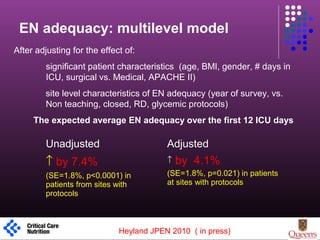
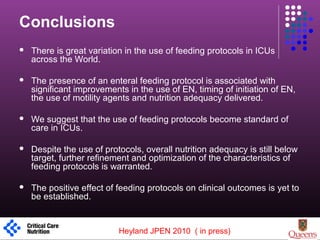


This multicenter observational study evaluated the impact of enteral feeding protocols on nutrition delivery in critically ill patients. The study found that sites using a feeding protocol had better enteral nutrition adequacy, started enteral nutrition earlier, and had higher overall nutritional adequacy compared to sites without a protocol. Specifically, sites with a protocol achieved 45.4% enteral nutrition adequacy compared to 34.7% for sites without. The presence of a protocol was associated with a 4.1% increase in enteral nutrition adequacy after adjusting for patient and site characteristics. However, overall nutritional adequacy remained below targets, indicating need for further refinement of feeding protocols.


![CASE_PRESENTATION_ON_subdural_hematoma(SDH)[1 FINAL PPT]-1.pptx](https://cdn.slidesharecdn.com/ss_thumbnails/casepresentationonsubduralhematomasdh1finalppt-1-260129172522-d405d375-thumbnail.jpg?width=640&height=640&fit=bounds)


