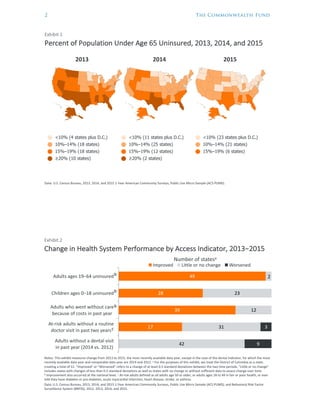
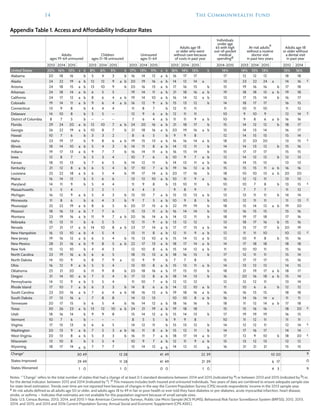
Between 2013 and 2015:
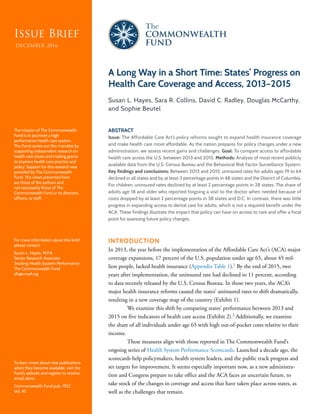
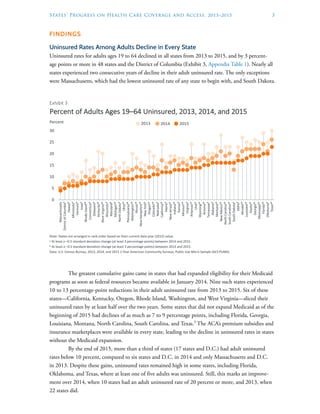
- Uninsured rates for adults declined in all states, by at least 3 percentage points in 48 states. States that expanded Medicaid eligibility saw the largest declines of 10-13 percentage points.
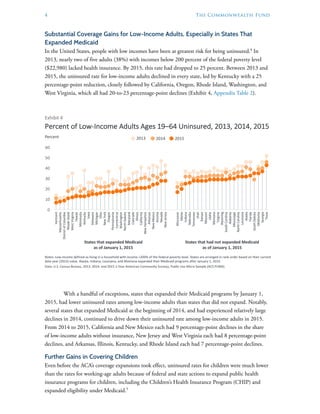
- Uninsured rates among low-income adults also declined in every state. States that expanded Medicaid generally had lower uninsured rates among low-income adults.
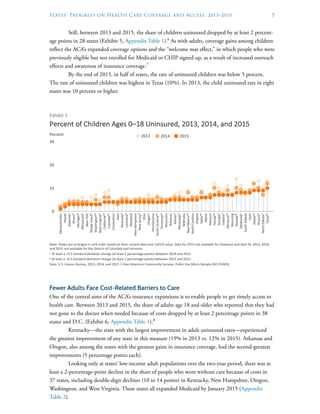
- The share of children who were uninsured dropped by at least 2 percentage points in 28 states.
While access to coverage increased significantly nationwide due to the Affordable Care Act, some states still had high uninsured rates, especially for low-income populations. States that expanded Medicaid eligibility achieved greater reductions in uninsured individuals.