SlideShare a Scribd company logo
Laying the Foundation for Policy: Measuring Local Prevalence for Autism Spectrum Disorder
Katelyn Lowe, Carolyn Dudley, Daniel J. Dutton, Jennifer D. Zwicker, Carly McMorris, J.C. Herbert Emery, David B Nicholas, Margaret Clarke
 Prevalence information is vital to guide policy makers in resource allocation
 In Canada ASD prevalence is reported in national figures based on international estimates but these
broad estimates may not be an accurate estimate of local prevalence and consequently local needs
 The province of Alberta has provided for a number of years some of the highest levels of funding for
children with ASD across Canada and because of this there is speculation of higher prevalence due to
in-migration for services
 National estimates of ASD may not reflect provincial estimates and local needs and basic local numbers
are needed
 School records in Calgary (a major urban center within the province of Alberta, Canada) and the
surrounding area could provide a feasible method to collect local prevalence
 To determine how many children are living with ASD in Calgary and surrounding areas of several other
smaller municipalities that comprise a total population of approximately 1.2 million people.
 School records provided by three major school boards and a number of independent and private schools
in Calgary and area were used to count the number of children living with an ASD diagnosis in the
geographical area of Calgary and surrounding communities.
 All children with an ASD diagnosis receive a special education numeric code on their record based on a
diagnosis of ASD which requires proof from a register health professional in Alberta.
 Special education codes are used for students with a disability to assign levels of required support. Codes
are categorized as mild/moderate or severe based on the students functional ability and behaviors.
 Each school board, independent and/or private school reviewed their data base of registered children and
extracted codes or records for children having a diagnosis of ASD.
 Records for all children in the specified geographical area from Grade 1 to Grade 12 who attended in the
2012-2013 school year were placed into a data set and records of those with an ASD diagnosis were ex-
tracted.
It is critical for policy makers to know local prevalence so that they can be aware of the extent of the
situation in their own jurisdictions and develop the supports needed
1 in 94 school age children have an ASD diagnosis in Calgary and surrounding area
Prevalence is higher in elementary-grade children where 1 in 86 had an ASD diagnosis
Reasons for the increased prevalence in lower grades are unknown but could be related to an increased
drop-out rate in higher grades, higher numbers moving to homeschooling and/or a true rise in
prevalence
The prevalence was similar to national estimates which suggests in-migration to Alberta for funding has
not had a significant impact on prevalence
These prevalence estimates help inform the policy makers on numbers in need of special education
services and for future planning needs as adolescents move into adult services at age 18
BACKGROUND SIGNIFICANCE
OBJECTIVES
METHOD
RESULTS
The prevalence of ASD for all children across all grades was 1 in 94 while the reported prevalence from the
CDC (2014) was 1 in 68. Taking only elementary grades the prevalence was 1 in 86. The surprising finding
was that a significant difference existed between the senior grades and lower grades. The decreased
numbers of children with ASD in senior grades was specific to one school board. It is possible that students
are dropping out in senior grades or moving into homeschooled settings. The difference could also be a
result of improved screening in younger grades, changing diagnostic criteria, general increased ASD
awareness or a true rise in prevalence.
DISCUSSION
CONCLUSION
 Prevalence estimation is important to guide policy makers in resource allocation. With rapidly rising
prevalence rates there is urgency to understand prevalence estimates for government discussions.
Prevalence estimates are often presented based on national estimates but these may not reflect local
numbers and needs.
 This study provides the first local-prevalence estimates for ASD in Alberta. Knowing that 1 in 94
children are living with ASD and that the numbers are increasing will help policy makers manage school
resources, employment programs and future housing needs.
 This study demonstrates a successful process of effectively working within and across school boards to
access records of children living with ASD and offers an alternate approach to estimate regional
prevalence.
STUDY LIMITATIONS
1.Not all independent schools participated and it was not possible to count the number of homeschooled
children in the area. We estimate that we captured approximately 91% of all children attending school in
the area.
2. The ASD diagnosis on record was obtained by a qualified health professional but there was no standard
diagnostic review across boards and schools to confirm the diagnosis.
3. This review used only one source of records (school records) as opposed to a more comprehensive
multiple record review that would include school and health records.
We gratefully acknowledge the support of all participating school boards and independent or private
schools in this project.
School Boards
CBE CCSD Rocky View Other Total
Total number of children enrolled 97,293 44,774 16,868 1,969 160,904
Autistic Disorder 570 223 72 132 997
Asperger's Disorder 209 79 36 20 344
Other 225 84 32 29 370
Total Diagnosed 1,004 386 140 181 1,711
Table 1: 1 in 94 children across all schools have a diagnosis of ASD
School Boards
CBE CCSD Rocky View Other Total
Male 859 325 108 142 1434
Female 145 61 32 39 277
Ratio M:F 5.9:1 5.3:1 3.4:1 3.6:1 5.2:1
Table 2: ASD diagnosis by sex across boards shows the male to female ratio is 5.2:1
Diagnostic Category Total number Percent
Autistic Disorder 997 58.27%
Asperger's Disorder 344 20.11%
Other 370 21.62%
Total 1711 100.00%
Table 3: Total count in all schools by diagnostic category
Grade Level Prevalence per 1,000 Cases Ratio
Elementary 11.61* 1 in 86
Junior 11.11* 1 in 90
Senior 8.88 1 in 113
* Indicates statistically different from Senior prevalence at 5%
significance
Table 4: Prevalence of an ASD by School Category

More Related Content

What's hot

Fox_SURF.PDF
Fox_SURF.PDFFox_SURF.PDF
Fox_SURF.PDFEmma Fox
 
Autism Spectrum Disorders
Autism Spectrum DisordersAutism Spectrum Disorders
Autism Spectrum Disorders
Orjola_Lasku
 
National Consumers League 2013 Vaccine Study
National Consumers League 2013 Vaccine StudyNational Consumers League 2013 Vaccine Study
National Consumers League 2013 Vaccine Study
nationalconsumersleague
 
Linking public schools and community mental health copy
Linking public schools and community mental health copyLinking public schools and community mental health copy
Linking public schools and community mental health copy
ClaireBolasky
 
KYN Poster Revised
KYN Poster RevisedKYN Poster Revised
KYN Poster RevisedMelvin Smith
 
Autism Spectrum Disorders
Autism Spectrum DisordersAutism Spectrum Disorders
Autism Spectrum DisordersOrjola_Lasku
 
OregonACEsReport 2011 BRFSS data
OregonACEsReport 2011 BRFSS dataOregonACEsReport 2011 BRFSS data
OregonACEsReport 2011 BRFSS dataKoneng Lor
 
Adhd who is affected
Adhd who is affectedAdhd who is affected
Adhd who is affected
kfahie
 
Autistic Children Improve IQ and Social Skills with Reflective Network Therapy
Autistic Children Improve IQ and Social Skills with Reflective Network TherapyAutistic Children Improve IQ and Social Skills with Reflective Network Therapy
Autistic Children Improve IQ and Social Skills with Reflective Network Therapy
Shema Kolainu - Hear Our Voices
 
Grunewald Economic Case
Grunewald Economic CaseGrunewald Economic Case
Grunewald Economic Case
Jackson
 
Estudio Milwaukee Study
Estudio Milwaukee StudyEstudio Milwaukee Study
Estudio Milwaukee Study
Fundación CADAH TDAH
 
Substance abuse and ADHD statistics
Substance abuse and ADHD statisticsSubstance abuse and ADHD statistics
Substance abuse and ADHD statistics
Youraddictionsolution
 
DE ACE Data DJPH_Dec2016
DE ACE Data DJPH_Dec2016DE ACE Data DJPH_Dec2016
DE ACE Data DJPH_Dec2016Andrea Miller
 
Prevention_of_Secondary_Conditions_in_Fetal_Alcohol_Spectrum_identification_o...
Prevention_of_Secondary_Conditions_in_Fetal_Alcohol_Spectrum_identification_o...Prevention_of_Secondary_Conditions_in_Fetal_Alcohol_Spectrum_identification_o...
Prevention_of_Secondary_Conditions_in_Fetal_Alcohol_Spectrum_identification_o...Naira Tahir
 
Maternal Alcohol Use Disorder and Risk of Child Contact with the Justice Syst...
Maternal Alcohol Use Disorder and Risk of Child Contact with the Justice Syst...Maternal Alcohol Use Disorder and Risk of Child Contact with the Justice Syst...
Maternal Alcohol Use Disorder and Risk of Child Contact with the Justice Syst...
BARRY STANLEY 2 fasd
 
Autism
AutismAutism

What's hot (19)

ACES AAPI
ACES AAPIACES AAPI
ACES AAPI
 
Fox_SURF.PDF
Fox_SURF.PDFFox_SURF.PDF
Fox_SURF.PDF
 
Autism Spectrum Disorders
Autism Spectrum DisordersAutism Spectrum Disorders
Autism Spectrum Disorders
 
National Consumers League 2013 Vaccine Study
National Consumers League 2013 Vaccine StudyNational Consumers League 2013 Vaccine Study
National Consumers League 2013 Vaccine Study
 
Linking public schools and community mental health copy
Linking public schools and community mental health copyLinking public schools and community mental health copy
Linking public schools and community mental health copy
 
KYN Poster Revised
KYN Poster RevisedKYN Poster Revised
KYN Poster Revised
 
Autism Spectrum Disorders
Autism Spectrum DisordersAutism Spectrum Disorders
Autism Spectrum Disorders
 
Understanding Behavioral Risk Factors in High-Deductible Health Plans 5 31 11
Understanding Behavioral Risk Factors in High-Deductible Health Plans 5 31 11Understanding Behavioral Risk Factors in High-Deductible Health Plans 5 31 11
Understanding Behavioral Risk Factors in High-Deductible Health Plans 5 31 11
 
OregonACEsReport 2011 BRFSS data
OregonACEsReport 2011 BRFSS dataOregonACEsReport 2011 BRFSS data
OregonACEsReport 2011 BRFSS data
 
Adhd who is affected
Adhd who is affectedAdhd who is affected
Adhd who is affected
 
Autistic Children Improve IQ and Social Skills with Reflective Network Therapy
Autistic Children Improve IQ and Social Skills with Reflective Network TherapyAutistic Children Improve IQ and Social Skills with Reflective Network Therapy
Autistic Children Improve IQ and Social Skills with Reflective Network Therapy
 
Grunewald Economic Case
Grunewald Economic CaseGrunewald Economic Case
Grunewald Economic Case
 
Estudio Milwaukee Study
Estudio Milwaukee StudyEstudio Milwaukee Study
Estudio Milwaukee Study
 
Substance abuse and ADHD statistics
Substance abuse and ADHD statisticsSubstance abuse and ADHD statistics
Substance abuse and ADHD statistics
 
DE ACE Data DJPH_Dec2016
DE ACE Data DJPH_Dec2016DE ACE Data DJPH_Dec2016
DE ACE Data DJPH_Dec2016
 
Prevention_of_Secondary_Conditions_in_Fetal_Alcohol_Spectrum_identification_o...
Prevention_of_Secondary_Conditions_in_Fetal_Alcohol_Spectrum_identification_o...Prevention_of_Secondary_Conditions_in_Fetal_Alcohol_Spectrum_identification_o...
Prevention_of_Secondary_Conditions_in_Fetal_Alcohol_Spectrum_identification_o...
 
Maternal Alcohol Use Disorder and Risk of Child Contact with the Justice Syst...
Maternal Alcohol Use Disorder and Risk of Child Contact with the Justice Syst...Maternal Alcohol Use Disorder and Risk of Child Contact with the Justice Syst...
Maternal Alcohol Use Disorder and Risk of Child Contact with the Justice Syst...
 
Understanding Behavioral Risk Factors in High-Deductible Health Plans 4 29 11
Understanding Behavioral Risk Factors in High-Deductible Health Plans  4 29 11Understanding Behavioral Risk Factors in High-Deductible Health Plans  4 29 11
Understanding Behavioral Risk Factors in High-Deductible Health Plans 4 29 11
 
Autism
AutismAutism
Autism
 

Viewers also liked

Adenilse 2014 apresentação cefapro
Adenilse 2014 apresentação cefaproAdenilse 2014 apresentação cefapro
Adenilse 2014 apresentação cefapro
Sara Cristina
 
6 Menifee Lane, Cherokee Village, AR
6 Menifee Lane, Cherokee Village, AR6 Menifee Lane, Cherokee Village, AR
6 Menifee Lane, Cherokee Village, AR
Laura Clute
 
WORLD HEALTH DAY SHAHID RAJAEI
WORLD HEALTH DAY SHAHID RAJAEIWORLD HEALTH DAY SHAHID RAJAEI
WORLD HEALTH DAY SHAHID RAJAEIMeissam Golabi
 
Yoolla CRM
Yoolla CRMYoolla CRM
Yoolla CRM
SalesMan Team
 
03 conditions loops
03   conditions loops03   conditions loops
03 conditions loops
Manzoor ALam
 
03a control structures
03a   control structures03a   control structures
03a control structures
Manzoor ALam
 
02a fundamental c++ types, arithmetic
02a   fundamental c++ types, arithmetic 02a   fundamental c++ types, arithmetic
02a fundamental c++ types, arithmetic
Manzoor ALam
 
Dolannnes melodies
Dolannnes melodiesDolannnes melodies

Viewers also liked (11)

Sawyer residence dining room
Sawyer residence   dining roomSawyer residence   dining room
Sawyer residence dining room
 
Adenilse 2014 apresentação cefapro
Adenilse 2014 apresentação cefaproAdenilse 2014 apresentação cefapro
Adenilse 2014 apresentação cefapro
 
6 Menifee Lane, Cherokee Village, AR
6 Menifee Lane, Cherokee Village, AR6 Menifee Lane, Cherokee Village, AR
6 Menifee Lane, Cherokee Village, AR
 
WORLD HEALTH DAY SHAHID RAJAEI
WORLD HEALTH DAY SHAHID RAJAEIWORLD HEALTH DAY SHAHID RAJAEI
WORLD HEALTH DAY SHAHID RAJAEI
 
Moda
ModaModa
Moda
 
Yoolla CRM
Yoolla CRMYoolla CRM
Yoolla CRM
 
03 conditions loops
03   conditions loops03   conditions loops
03 conditions loops
 
03a control structures
03a   control structures03a   control structures
03a control structures
 
02a fundamental c++ types, arithmetic
02a   fundamental c++ types, arithmetic 02a   fundamental c++ types, arithmetic
02a fundamental c++ types, arithmetic
 
Dolannnes melodies
Dolannnes melodiesDolannnes melodies
Dolannnes melodies
 
Tv drama
Tv dramaTv drama
Tv drama
 

Similar to IMFAR 2015 Poster

109232867 academic-study-template
109232867 academic-study-template109232867 academic-study-template
109232867 academic-study-template
homeworkping7
 
final published online 5-20-15
final published online 5-20-15final published online 5-20-15
final published online 5-20-15Yvette Janvier
 
Increased prevalence of binocular visual disorders and optic neuropathy in ch...
Increased prevalence of binocular visual disorders and optic neuropathy in ch...Increased prevalence of binocular visual disorders and optic neuropathy in ch...
Increased prevalence of binocular visual disorders and optic neuropathy in ch...
Danielle Doppee
 
Nihms442696
Nihms442696Nihms442696
Nihms44269614051984
 
Information-Seeking Behaviors of Parents of Children with ADHD: Experiences, ...
Information-Seeking Behaviors of Parents of Children with ADHD: Experiences, ...Information-Seeking Behaviors of Parents of Children with ADHD: Experiences, ...
Information-Seeking Behaviors of Parents of Children with ADHD: Experiences, ...
Laura Levy
 
To Assess Knowledge Regarding Obesity and its Prevention among Adolescents
To Assess Knowledge Regarding Obesity and its Prevention among AdolescentsTo Assess Knowledge Regarding Obesity and its Prevention among Adolescents
To Assess Knowledge Regarding Obesity and its Prevention among Adolescents
ijtsrd
 
FASD at RJCHC
FASD at RJCHCFASD at RJCHC
FASD at RJCHC
Olaf Kraus de Camargo
 
Parents perceptions of autism and theirhealth-seeking behav
Parents perceptions of autism and theirhealth-seeking behavParents perceptions of autism and theirhealth-seeking behav
Parents perceptions of autism and theirhealth-seeking behav
emelyvalg9
 
Exploring the Association between Maternal Health Literacy and Pediatric Heal...
Exploring the Association between Maternal Health Literacy and Pediatric Heal...Exploring the Association between Maternal Health Literacy and Pediatric Heal...
Exploring the Association between Maternal Health Literacy and Pediatric Heal...
Penn Institute for Urban Research
 
EMOTIONAL REGULATION AND COGNITIVE FLEXIBILITY AS PREDICTORS OF MATERNAL ACCE...
EMOTIONAL REGULATION AND COGNITIVE FLEXIBILITY AS PREDICTORS OF MATERNAL ACCE...EMOTIONAL REGULATION AND COGNITIVE FLEXIBILITY AS PREDICTORS OF MATERNAL ACCE...
EMOTIONAL REGULATION AND COGNITIVE FLEXIBILITY AS PREDICTORS OF MATERNAL ACCE...
indexPub
 
School Entry Age: The younger group has more behavior and academic problems
School Entry Age: The younger group has more behavior and academic problemsSchool Entry Age: The younger group has more behavior and academic problems
School Entry Age: The younger group has more behavior and academic problems
Yanki Yazgan
 
Blacher, palm desert keynote, 2 16-13
Blacher, palm desert keynote, 2 16-13Blacher, palm desert keynote, 2 16-13
Blacher, palm desert keynote, 2 16-13Regan Linn
 
Adherence for Pediatrics: Plenary
Adherence for Pediatrics: PlenaryAdherence for Pediatrics: Plenary
Adherence for Pediatrics: Plenaryicapclinical
 
CFUW resolution 11 North Bay, Ontario. 2016
CFUW resolution 11  North Bay, Ontario. 2016CFUW resolution 11  North Bay, Ontario. 2016
CFUW resolution 11 North Bay, Ontario. 2016
BARRY STANLEY 2 fasd
 
Can Integrated Parental and Teacher Support Meet the Challenges of the Autist...
Can Integrated Parental and Teacher Support Meet the Challenges of the Autist...Can Integrated Parental and Teacher Support Meet the Challenges of the Autist...
Can Integrated Parental and Teacher Support Meet the Challenges of the Autist...Anna Fisher
 
Is ponda hypocritical ?
Is ponda hypocritical ?Is ponda hypocritical ?
Is ponda hypocritical ?
BARRY STANLEY 2 fasd
 

Similar to IMFAR 2015 Poster (20)

109232867 academic-study-template
109232867 academic-study-template109232867 academic-study-template
109232867 academic-study-template
 
final published online 5-20-15
final published online 5-20-15final published online 5-20-15
final published online 5-20-15
 
Increased prevalence of binocular visual disorders and optic neuropathy in ch...
Increased prevalence of binocular visual disorders and optic neuropathy in ch...Increased prevalence of binocular visual disorders and optic neuropathy in ch...
Increased prevalence of binocular visual disorders and optic neuropathy in ch...
 
Nihms442696
Nihms442696Nihms442696
Nihms442696
 
Time Trends in ASD Diagnosis and Referral to Follow-up Services 7 28 11
Time Trends in ASD Diagnosis and Referral to Follow-up Services 7 28 11Time Trends in ASD Diagnosis and Referral to Follow-up Services 7 28 11
Time Trends in ASD Diagnosis and Referral to Follow-up Services 7 28 11
 
Information-Seeking Behaviors of Parents of Children with ADHD: Experiences, ...
Information-Seeking Behaviors of Parents of Children with ADHD: Experiences, ...Information-Seeking Behaviors of Parents of Children with ADHD: Experiences, ...
Information-Seeking Behaviors of Parents of Children with ADHD: Experiences, ...
 
To Assess Knowledge Regarding Obesity and its Prevention among Adolescents
To Assess Knowledge Regarding Obesity and its Prevention among AdolescentsTo Assess Knowledge Regarding Obesity and its Prevention among Adolescents
To Assess Knowledge Regarding Obesity and its Prevention among Adolescents
 
FASD at RJCHC
FASD at RJCHCFASD at RJCHC
FASD at RJCHC
 
Parents perceptions of autism and theirhealth-seeking behav
Parents perceptions of autism and theirhealth-seeking behavParents perceptions of autism and theirhealth-seeking behav
Parents perceptions of autism and theirhealth-seeking behav
 
Exploring the Association between Maternal Health Literacy and Pediatric Heal...
Exploring the Association between Maternal Health Literacy and Pediatric Heal...Exploring the Association between Maternal Health Literacy and Pediatric Heal...
Exploring the Association between Maternal Health Literacy and Pediatric Heal...
 
EMOTIONAL REGULATION AND COGNITIVE FLEXIBILITY AS PREDICTORS OF MATERNAL ACCE...
EMOTIONAL REGULATION AND COGNITIVE FLEXIBILITY AS PREDICTORS OF MATERNAL ACCE...EMOTIONAL REGULATION AND COGNITIVE FLEXIBILITY AS PREDICTORS OF MATERNAL ACCE...
EMOTIONAL REGULATION AND COGNITIVE FLEXIBILITY AS PREDICTORS OF MATERNAL ACCE...
 
School Entry Age: The younger group has more behavior and academic problems
School Entry Age: The younger group has more behavior and academic problemsSchool Entry Age: The younger group has more behavior and academic problems
School Entry Age: The younger group has more behavior and academic problems
 
Finalcapstone
FinalcapstoneFinalcapstone
Finalcapstone
 
Blacher, palm desert keynote, 2 16-13
Blacher, palm desert keynote, 2 16-13Blacher, palm desert keynote, 2 16-13
Blacher, palm desert keynote, 2 16-13
 
LDRC Poster
LDRC PosterLDRC Poster
LDRC Poster
 
Adherence for Pediatrics: Plenary
Adherence for Pediatrics: PlenaryAdherence for Pediatrics: Plenary
Adherence for Pediatrics: Plenary
 
CFUW resolution 11 North Bay, Ontario. 2016
CFUW resolution 11  North Bay, Ontario. 2016CFUW resolution 11  North Bay, Ontario. 2016
CFUW resolution 11 North Bay, Ontario. 2016
 
Can Integrated Parental and Teacher Support Meet the Challenges of the Autist...
Can Integrated Parental and Teacher Support Meet the Challenges of the Autist...Can Integrated Parental and Teacher Support Meet the Challenges of the Autist...
Can Integrated Parental and Teacher Support Meet the Challenges of the Autist...
 
Is ponda hypocritical ?
Is ponda hypocritical ?Is ponda hypocritical ?
Is ponda hypocritical ?
 
dspub6
dspub6dspub6
dspub6
 

IMFAR 2015 Poster

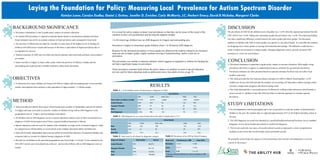
  • 1. Laying the Foundation for Policy: Measuring Local Prevalence for Autism Spectrum Disorder Katelyn Lowe, Carolyn Dudley, Daniel J. Dutton, Jennifer D. Zwicker, Carly McMorris, J.C. Herbert Emery, David B Nicholas, Margaret Clarke  Prevalence information is vital to guide policy makers in resource allocation  In Canada ASD prevalence is reported in national figures based on international estimates but these broad estimates may not be an accurate estimate of local prevalence and consequently local needs  The province of Alberta has provided for a number of years some of the highest levels of funding for children with ASD across Canada and because of this there is speculation of higher prevalence due to in-migration for services  National estimates of ASD may not reflect provincial estimates and local needs and basic local numbers are needed  School records in Calgary (a major urban center within the province of Alberta, Canada) and the surrounding area could provide a feasible method to collect local prevalence  To determine how many children are living with ASD in Calgary and surrounding areas of several other smaller municipalities that comprise a total population of approximately 1.2 million people.  School records provided by three major school boards and a number of independent and private schools in Calgary and area were used to count the number of children living with an ASD diagnosis in the geographical area of Calgary and surrounding communities.  All children with an ASD diagnosis receive a special education numeric code on their record based on a diagnosis of ASD which requires proof from a register health professional in Alberta.  Special education codes are used for students with a disability to assign levels of required support. Codes are categorized as mild/moderate or severe based on the students functional ability and behaviors.  Each school board, independent and/or private school reviewed their data base of registered children and extracted codes or records for children having a diagnosis of ASD.  Records for all children in the specified geographical area from Grade 1 to Grade 12 who attended in the 2012-2013 school year were placed into a data set and records of those with an ASD diagnosis were ex- tracted. It is critical for policy makers to know local prevalence so that they can be aware of the extent of the situation in their own jurisdictions and develop the supports needed 1 in 94 school age children have an ASD diagnosis in Calgary and surrounding area Prevalence is higher in elementary-grade children where 1 in 86 had an ASD diagnosis Reasons for the increased prevalence in lower grades are unknown but could be related to an increased drop-out rate in higher grades, higher numbers moving to homeschooling and/or a true rise in prevalence The prevalence was similar to national estimates which suggests in-migration to Alberta for funding has not had a significant impact on prevalence These prevalence estimates help inform the policy makers on numbers in need of special education services and for future planning needs as adolescents move into adult services at age 18 BACKGROUND SIGNIFICANCE OBJECTIVES METHOD RESULTS The prevalence of ASD for all children across all grades was 1 in 94 while the reported prevalence from the CDC (2014) was 1 in 68. Taking only elementary grades the prevalence was 1 in 86. The surprising finding was that a significant difference existed between the senior grades and lower grades. The decreased numbers of children with ASD in senior grades was specific to one school board. It is possible that students are dropping out in senior grades or moving into homeschooled settings. The difference could also be a result of improved screening in younger grades, changing diagnostic criteria, general increased ASD awareness or a true rise in prevalence. DISCUSSION CONCLUSION  Prevalence estimation is important to guide policy makers in resource allocation. With rapidly rising prevalence rates there is urgency to understand prevalence estimates for government discussions. Prevalence estimates are often presented based on national estimates but these may not reflect local numbers and needs.  This study provides the first local-prevalence estimates for ASD in Alberta. Knowing that 1 in 94 children are living with ASD and that the numbers are increasing will help policy makers manage school resources, employment programs and future housing needs.  This study demonstrates a successful process of effectively working within and across school boards to access records of children living with ASD and offers an alternate approach to estimate regional prevalence. STUDY LIMITATIONS 1.Not all independent schools participated and it was not possible to count the number of homeschooled children in the area. We estimate that we captured approximately 91% of all children attending school in the area. 2. The ASD diagnosis on record was obtained by a qualified health professional but there was no standard diagnostic review across boards and schools to confirm the diagnosis. 3. This review used only one source of records (school records) as opposed to a more comprehensive multiple record review that would include school and health records. We gratefully acknowledge the support of all participating school boards and independent or private schools in this project. School Boards CBE CCSD Rocky View Other Total Total number of children enrolled 97,293 44,774 16,868 1,969 160,904 Autistic Disorder 570 223 72 132 997 Asperger's Disorder 209 79 36 20 344 Other 225 84 32 29 370 Total Diagnosed 1,004 386 140 181 1,711 Table 1: 1 in 94 children across all schools have a diagnosis of ASD School Boards CBE CCSD Rocky View Other Total Male 859 325 108 142 1434 Female 145 61 32 39 277 Ratio M:F 5.9:1 5.3:1 3.4:1 3.6:1 5.2:1 Table 2: ASD diagnosis by sex across boards shows the male to female ratio is 5.2:1 Diagnostic Category Total number Percent Autistic Disorder 997 58.27% Asperger's Disorder 344 20.11% Other 370 21.62% Total 1711 100.00% Table 3: Total count in all schools by diagnostic category Grade Level Prevalence per 1,000 Cases Ratio Elementary 11.61* 1 in 86 Junior 11.11* 1 in 90 Senior 8.88 1 in 113 * Indicates statistically different from Senior prevalence at 5% significance Table 4: Prevalence of an ASD by School Category