This document describes a method for analyzing 375 organic contaminants including pesticides, polychlorinated biphenyls (PCBs) and polyaromatic hydrocarbons (PAHs) in fruits and vegetables using gas chromatography coupled with triple quadrupole mass spectrometry (GC-MS/MS). Samples were extracted with ethyl acetate and cleaned up using dispersive solid phase extraction. The method was validated and achieved limits of quantification below 10 μg/L for most compounds. Recoveries from 70-110% and precision below 20% indicated the method was satisfactory. A semi-quantitative approach was also developed utilizing calibration curves, and provided accurate quantification of incurred samples within ±10% of direct quantification values.
This study demonstrated an automated mini-column solid-phase extraction (SPE) cleanup method coupled with low-pressure gas chromatography tandem mass spectrometry (LPGC-MS/MS) for high-throughput analysis of pesticides and environmental contaminants in foods. The method used QuEChERS extracts that underwent automated mini-SPE cleanup on a robotic system over 5 days, analyzing 325 samples for 54 pesticides and 43 contaminants in 10 food matrices. Method validation showed satisfactory recovery and precision for 91 of 94 analytes, with minimal matrix effects and minimal need for manual data review. This demonstrated that the automated mini-SPE + LPGC-MS/MS method provided accurate, high-throughput analysis with minimal labor and oversight needed.
This study demonstrated an automated mini-column solid-phase extraction (SPE) cleanup method coupled with low-pressure gas chromatography tandem mass spectrometry (LPGC-MS/MS) for high-throughput analysis of pesticides and environmental contaminants in foods. The method used mini-SPE cartridges containing mixed sorbents to clean up QuEChERS extracts of 10 different food types. Over 230 spiked food extracts underwent automated mini-SPE cleanup and LPGC-MS/MS analysis in 5 days with minimal labor or data review needed. Validation results showed the method achieved satisfactory recovery and precision for 91 of 94 analytes tested at limits of quantification of <10 ng/g.
11 Mercury speciation analysis in seafood by species-specific ID - method val...JohanaMarcelaAcostaA1
This document summarizes a study that validated a method for determining methylmercury (MeHg) and total mercury (THg) levels in seafood using species-specific isotope dilution analysis and gas chromatography-inductive coupled plasma mass spectrometry (GC-ICP-MS).
The researchers optimized sample preparation methods, including extraction techniques, derivatization, and agitation. They evaluated the method using certified reference materials and isotopically enriched mercury species. The optimized method was validated and shown to have good accuracy, precision, limits of quantification, and trueness.
The method was then applied to 62 seafood samples representative of French consumption. MeHg levels were generally low but varied between samples. The percentage
This document describes a method for determining chloramphenicol (CAP) and thiamphenicol (TAP) residues in fish, shrimp, and milk using electrospray ionization liquid chromatography-tandem mass spectrometry (ESI-LCMSMS). Samples were extracted with ethyl acetate and analyzed using an Agilent Eclipse C18 column with an isocratic mobile phase of methanol and water. Transitions were monitored for CAP, TAP, and an internal standard. Validation was performed according to EU guidelines, showing good linearity, accuracy, precision, limits of detection, and applicability to real samples. The method provides a simple, selective, and sensitive means for simultaneous analysis of CAP and TAP residues
Development and validation of hplc method for determination of theophylline a...IJSIT Editor
A stable, simple, rapid, precise, accurate HPLC method for analysis of Theophyllinee and 1-Methyl
Uric Acid was developed and validated as per ICH guidelines without need of any internal standard.
Separation was carried out using X’terra RP18 (250*4.6) mm, 5µ column with potassium dihydrogen
orthophosphate buffer (pH 3): acetonitrile (30:70 v/v) as mobile phase with flow rate 1 mL min-1. The
parameters studied were retention time, linearity and range, accuracy, precision. The proposed method can
be used for determination of Theophylline and 1-Methyl Uric Acid from Human plasma.
This document describes the development and validation of a QuEChERS-based extraction and HPLC-FLD method for the screening and determination of polycyclic aromatic hydrocarbons (PAHs) in edible seafood. The method uses acetonitrile extraction followed by the addition of salts to induce water partitioning. Extracts are filtered and analyzed by HPLC with fluorescence detection. The method was validated in three laboratories and found to have recoveries ranging from 78-99% for 15 PAHs in seafood including oysters, shrimp, crab, and finfish. The method provides detection limits in the sub to low ppb range and is a more rapid and simplified approach compared to established GC/MS methods.
This document describes a new approach for fingerprint analysis of Chrysanthemum morifolium Ramat combining ultra-performance liquid chromatography (UPLC) and chemometrics methods. UPLC allowed for chromatographic separation and detection of components in 10 minutes, much faster than conventional HPLC methods. Good precision, reproducibility, and accuracy were obtained for six typical components. Consistent results were seen based on cultivation source. The method provides a more rapid quality control technique for C. morifolium Ramat.
Analytical Method development and routine QC analysis for determination of Genotoxic impurities (GI) at trace levels present exceptional challenges to the pharmaceutical development and QC laboratories. These impurities are required to be controlled at trace levels in new drug substances and drug products. The International Conference on Harmonization’s (ICH) M7 guideline provides recommendations for toxicology assessment, identification, categorization, and control of actual and potential mutagenic impurities that are likely to arise during the manufacturing and long-term storage of a new drug substance and drug product
Numerous separation and detection techniques are available which can be used to determine the levels present in given samples. Selecting the suitable analytical technique depends on the analyte (GI) physicochemical properties, desired sensitivity as well as the matrix interference needs to be taken into account.
Green feed in methane mitigation...muneendra kumarMuneendra Kumar
This document provides an overview of enteric methane production in ruminants and techniques for measuring methane emissions. It discusses how methane is produced in the rumen and hindgut of ruminants as a byproduct of microbial fermentation. The document summarizes several techniques used to measure methane emissions, including respiration chambers, sulfur hexafluoride tracer, and the GreenFeed system. It provides details on how the GreenFeed system works and factors that can influence methane measurements using this technique, such as animal visitation patterns and head movement during measurements.
This document describes a study that developed and validated methods for determining off-flavor compounds geosmin and 2-methylisoborneol (2-MIB) in live fish using in vivo solid-phase microextraction (SPME). Two kinetic calibration methods were investigated: on-fiber standardization and measurement using predetermined sampling rates. Both methods were validated by comparing results to traditional analysis methods requiring lethal sampling. The detection limits for geosmin and 2-MIB in fish muscle using in vivo SPME were below human sensory thresholds. The developed methods allow monitoring off-flavor compounds in individual fish in recirculating aquaculture systems over time to evaluate strategies for preventing off-flavors.
UV spectrophotometric method development and validation for quantitative esti...Sagar Savale
UV Spectrophotometric Method Development and Validation for quantitative estimation of Ondansetron
Hydrochloride (HCL). U.V Spectrophotometric method have been widely employed in determination of
individual components in a mixture or fixed dose combination. Our aim is to develop spectroscopic method for
estimation of the Ondansetron HCL in ternary mixture by using U.V spectrophotometry. The method was
validated as per ICH guidelines. The recovery studies confirmed the accuracy and precision of the method. It was
successfully applied for the analysis of the drug in bulk and could be effectively used for the routine analysis.
The Use of in vitro Gas Production Technique as an Index of the Nutritive Val...IOSRJAVS
: The in vitro gas production technique was used to predict rumen fermentable organic matter, gas production kinetics, organic matter digestibility as well as metabolizable energy were evaluated in green shoot, leaves, fruits flesh and seed cakes of Ziziphus spina-christi tree. A gas production was measured by incubating samples in buffered rumen fluid from cannulated steer for 72 h. Total gas production was recorded at 0,3, 6, 9, 12, 24, 48, and 72 h of incubation periods and kinetics of gas production was described. The chemical analysis of these Ziziphus spina-christi parts, showed that, Leaves contained high protein (14.77±0.23g/kg) and green shoot less protein (8.03±0.15g/kg),however, high ash content was observed in green shoot (10.03±0.07g/kg) compare to other parts. seed cakes has the highest crude fibre content in comparison to other parts (32.46±0.01),while fruits flesh contained the highest ether extract(72.39±0.03).The maximum gas volume was highest for fruits flesh followed by seed cakes, green shoot and leaves after 24hr of incubation. In this study flesh had a significantly higher (P<0.05) gas production from rapid soluble fraction (a) than the other parts, while Ziziphus spina-christi leaves showed the highest gas production from slowly degradable fraction (b) .Organic matter digestibility range was (51.90– 43.79%) and Metabolisable energy was found to be (9.16– 6.74MJ/kgDM) in the flesh and green shoot, respectively. It was concluded that, green shoots, leaves, fruit flesh and seed cake of Ziziphus spina-christi have the potential to be used as protein, energy and mineral supplements for ruminants especially during the dry season
The document discusses various advanced techniques used for phytochemical analysis, including separation, isolation, and identification of plant constituents. Gas chromatography-mass spectrometry (GC-MS) and high-performance liquid chromatography (HPLC) are described as important methods for analyzing volatile compounds and quantifying specific phytochemicals. Several studies applying GC-MS, HPLC, and spectrophotometric techniques to characterize phytochemicals in hops, carotenoids in goji berries, and essential oils are summarized. Statistical analysis and identification of compounds using libraries are also mentioned.
This study analyzed 533 animal feed samples collected from India for residues of persistent organochlorine pesticides (OCPs) like hexachlorocyclohexane (HCH) isomers, dichlorodiphenyltrichloroethane (DDT) complex, endosulfan and dicofol. 56.47% of samples tested positive for these pesticides. The mean concentration of β-HCH was highest among HCH isomers. DDT complex residues ranged from 0.016 to 0.118 mg/kg. Endosulfan was also detected but dicofol was found in very few samples. While residues were present, most were within established safety limits. The major sources of
UV Spectrophotometric Method Development and Validation for Quantitative Esti...Sagar Savale
This document describes the development and validation of a UV spectrophotometric method for the quantitative estimation of paracetamol. Paracetamol was found to exhibit maximum absorption at 244 nm in methanol. The method was validated according to ICH guidelines and showed good linearity (R2 = 0.9999), recovery (99.78-100.54%), precision (<0.06% RSD), ruggedness (<0.02% RSD), and sensitivity (LOD = 0.37 μg/ml, LOQ = 0.98 μg/ml). The developed method is simple, rapid, economical and suitable for the analysis of paracetamol in bulk drug samples.
This research paper evaluates two methods, machine learning algorithms and radiative transfer model inversion, for estimating chlorophyll content in tea leaves with different shading treatments using hyperspectral reflectance measurements. Regression models based on machine learning, specifically kernel-based extreme learning machine, achieved the highest performance with a root mean square error of 3.04 mg/cm2 for predicting chlorophyll content in an independent test set. The PROSPECT-D radiative transfer model inversion also showed potential for quantifying chlorophyll content but requires some improvements. A total of 96 published vegetation indices were also evaluated as inputs to the machine learning models. The study aims to develop an accurate non-destructive method for estimating chlorophyll content in tea leaves grown
Chemometrical Optimization for Fourier Transform Near Infrared Analysis of Su...IJERD Editor
Real-time evaluation of sugar quality requires determining the content of sugar brix in the steps of
the cane sugar process. Sugar brix is a key indicator for evaluating sugar quality. Fourier transform near infrared
(FTNIR) spectroscopy is a simple, rapid and non-destructive technology on the analysis of material contents. In
this study, the chemometric algorithm of parameter-combined tuning of Savitzky-Golay (SG) smoother and
Partial Least Squares (PLS) regression was utilized for FTNIR analysis of sugar brix content in sugarcane
clarified juice, an important intermediate product in cane sugar industry. The algorithms of combined
optimization of SG smoother and PLS regression was achieved and the calibration models were established
optimized by screening the expanded 540 SG smoothing modes and the 1-30 latent valuables (LV). The
optimized models have high predictive accuracy. These results confirm that the combined optimization of SG
smoothing modes and PLS LVs is effective in the quantitative determination of sugar brix contents in sugarcane
clarified juice, and that the FTNIR spectroscopic technology with its chemometric algorithms have the potential
in the analysis of cane sugar intermediates.
Analysis of Herbicide Atrazine and Its Degradation Products in Agricultural S...Agriculture Journal IJOEAR
Abstract— A novel ultra-performance liquid chromatography‒mass spectrometry (UPLC‒MS) method was developed for the determination of herbicide atrazine (ATR) and its principal metabolites namely deisopropylatrazine (DIA), deethylatrazine (DEA) and hydroxyatrazine (HA) in soils. The limit of detection ranged from 0.06 μg kg‒1 (DEA) to 0.25 μg kg‒1 (HA). Recoveries for the four target analytes at three spiked levels ranged from 73.2 to 110% with relative standard deviation of 5.1‒8.1%. In the cases of the three control soil samples spiked with ATR were treated for 60d, the sum content of the three degraded products is 3, 6.4, and 6.8 times greater than ATR residue, respectively. Analyzing 80 soil samples from four counties evaluated this method. ATR of 1.1‒125 μg kg‒1 in 80 of 80 samples, ATR of 0.5‒7.8 μg kg‒1 in 39 of 80 samples, and DIA of 0.5 and 0.6 μg kg‒1 in 2 of 80 samples were found. The proposed method can ensure the rapid and highly sensitive analysis of atrazine and its degradation products in soil, and can provide a direction for proper application of atrazine and a base for evaluating their hazards to the environment.
- The study analyzed rennet coagulation time (RCT), curd-firming rate, and curd firmness in milk samples from Brown Swiss cows using both a mechanical instrument (Formagraph) and an optical instrument (Optigraph).
- Traits were measured over an extended 45 minute period instead of the standard 30 minutes to capture data from all samples, including those that do not coagulate within 30 minutes.
- Heritability estimates were generated for each trait using both instruments to assess the genetic determinism and compare the instruments. Heritability estimates ranged from 0.12 to 0.23.
- Phenotypic and genetic correlations between traits measured by the two instruments were also estimated.
This document summarizes the development and validation of a sensitive LC-MS/MS method for quantifying acamprosate (ACM) levels in human plasma. Key points:
- ACM is a drug used to treat alcohol dependence. Previous methods for quantifying ACM required complex extraction/derivatization steps.
- A rapid LC-MS/MS method was developed involving a simple protein precipitation extraction. Chromatographic separation was achieved using a C18 column with mobile phase of ammonium acetate and acetonitrile.
- Validation showed the method was linear, accurate, precise and sensitive down to 7 ng/mL. Matrix effects were eliminated using an orthogonal spray ionization source.
Near and mid-infrared spectroscopic determination of algal compositionzhenhua82
Near- and mid-infrared spectroscopy were evaluated for their ability to determine the composition of algal turf scrubber (ATS) samples. A set of 117 ATS samples spanning a range of nitrogen, phosphorus, ash, sugar, lipid, and fatty acid contents were analyzed using near-infrared reflectance spectroscopy (NIRS), mid-infrared reflectance spectroscopy (MIRS), and conventional wet chemistry methods. NIRS and MIRS produced accurate determinations of ash and total nitrogen content but not phosphorus, total sugar, or mono-sugar content. Neither NIRS nor MIRS could accurately determine lipid or total fatty acid content in ATS samples. The results indicate that N
RP-HPLC method development and validation of ritonavir in bulk and pharmaceut...SriramNagarajan17
This document describes the development and validation of an RP-HPLC method for the quantification of the HIV protease inhibitor ritonavir (RIT) in bulk and pharmaceutical dosage forms. A simple isocratic RP-HPLC method was developed using a C18 column, mobile phase of 0.02M potassium dihydrogen phosphate buffer and acetonitrile (70:30 v/v), and detection at 237 nm. The method was validated per ICH guidelines and showed good linearity from 25-150 μg/mL, precision <0.5% RSD, accuracy of 99.3-100.6% recovery, and ability to quantify RIT in pharmaceutical tablets without interference from excipients.
Determination of Propionates and Propionic Acid in Bread Samples Using High P...theijes
In the present study, a HPLC method for determination of the preservative propionates in 7 groups of industrial bread samples is described. The separation the propionates were performed on the C18- column and Na2SO4 (8.0 mM) + H2SO4 (1.0 mM): acetonitrile (90:10, v/v %) as mobile phase. The detector wavelength was set at 210 nm. Separation of the propionates was achieved in less than 8 min. The samples first were milled and then extracted with 0.1 mol L-1 NaOH solution under ultrasonic irradiation. After centrifuge, supernatant clear solution was filtered using 0.45 µm Nylon syringe filter and 25 µL of solution was injected to HPLC loop. Analytical characteristics of the method such as limit of detection (LOD= 5 mg L-1 ), recovery percentage (>91%) and reproducibility (RSD=3.5 %) were evaluated. A plot of peak area (y) versus concentration of propionate (x, mg Kg-1 ) was linear over 10-1000 mg Kg-1 . The calibration graph can be described by the equation y = 301.64x + 9963 (r2= 0.991). The levels of propionates in bread samples ranged from 3683-4752 mg Kg-1. The results stated that High performance liquid chromatography is a simple and rapid method for the determination of propionates in bakery products.
The document discusses applications of liquid chromatography-mass spectrometry (LCMS). It describes how LCMS combines liquid chromatography separation with mass spectrometry detection. Several studies using LCMS are summarized, including analyzing phytochemicals in Solanum plants and identifying compounds in Archidendron bubalinum seed shell extracts. Key components detected include chlorogenic acids, flavonoids, alkaloids, and the compounds phlorizin and astilbin.
Chromatography is a technique for separating various inorganic and organic compounds. It is one of the separation techniques used as differential migration. It is more advantageous over conventional separating methods such as crystallization, solvent extraction and distillation. The purpose of presentation is to present various chromatographic techniques included a few advanced forms such as FC, HPLC,UPLC and UPCC (Super Critical chromatography).These are rapid forms of chromatographic techniques based on air pressure driven, optimized for rapid and precise separation of an organic compound.
Executive Directors Chat Leveraging AI for Diversity, Equity, and InclusionTechSoup
Let’s explore the intersection of technology and equity in the final session of our DEI series. Discover how AI tools, like ChatGPT, can be used to support and enhance your nonprofit's DEI initiatives. Participants will gain insights into practical AI applications and get tips for leveraging technology to advance their DEI goals.
it describes the bony anatomy including the femoral head , acetabulum, labrum . also discusses the capsule , ligaments . muscle that act on the hip joint and the range of motion are outlined. factors affecting hip joint stability and weight transmission through the joint are summarized.
More Related Content
Similar to Identification and quantitative determination of 2-acetyl-1-pyrroline using GC-TOF MS combined with HS and HS-SPME pretreatment (3).pdf
This document describes a new approach for fingerprint analysis of Chrysanthemum morifolium Ramat combining ultra-performance liquid chromatography (UPLC) and chemometrics methods. UPLC allowed for chromatographic separation and detection of components in 10 minutes, much faster than conventional HPLC methods. Good precision, reproducibility, and accuracy were obtained for six typical components. Consistent results were seen based on cultivation source. The method provides a more rapid quality control technique for C. morifolium Ramat.
Analytical Method development and routine QC analysis for determination of Genotoxic impurities (GI) at trace levels present exceptional challenges to the pharmaceutical development and QC laboratories. These impurities are required to be controlled at trace levels in new drug substances and drug products. The International Conference on Harmonization’s (ICH) M7 guideline provides recommendations for toxicology assessment, identification, categorization, and control of actual and potential mutagenic impurities that are likely to arise during the manufacturing and long-term storage of a new drug substance and drug product
Numerous separation and detection techniques are available which can be used to determine the levels present in given samples. Selecting the suitable analytical technique depends on the analyte (GI) physicochemical properties, desired sensitivity as well as the matrix interference needs to be taken into account.
Green feed in methane mitigation...muneendra kumarMuneendra Kumar
This document provides an overview of enteric methane production in ruminants and techniques for measuring methane emissions. It discusses how methane is produced in the rumen and hindgut of ruminants as a byproduct of microbial fermentation. The document summarizes several techniques used to measure methane emissions, including respiration chambers, sulfur hexafluoride tracer, and the GreenFeed system. It provides details on how the GreenFeed system works and factors that can influence methane measurements using this technique, such as animal visitation patterns and head movement during measurements.
This document describes a study that developed and validated methods for determining off-flavor compounds geosmin and 2-methylisoborneol (2-MIB) in live fish using in vivo solid-phase microextraction (SPME). Two kinetic calibration methods were investigated: on-fiber standardization and measurement using predetermined sampling rates. Both methods were validated by comparing results to traditional analysis methods requiring lethal sampling. The detection limits for geosmin and 2-MIB in fish muscle using in vivo SPME were below human sensory thresholds. The developed methods allow monitoring off-flavor compounds in individual fish in recirculating aquaculture systems over time to evaluate strategies for preventing off-flavors.
UV spectrophotometric method development and validation for quantitative esti...Sagar Savale
UV Spectrophotometric Method Development and Validation for quantitative estimation of Ondansetron
Hydrochloride (HCL). U.V Spectrophotometric method have been widely employed in determination of
individual components in a mixture or fixed dose combination. Our aim is to develop spectroscopic method for
estimation of the Ondansetron HCL in ternary mixture by using U.V spectrophotometry. The method was
validated as per ICH guidelines. The recovery studies confirmed the accuracy and precision of the method. It was
successfully applied for the analysis of the drug in bulk and could be effectively used for the routine analysis.
The Use of in vitro Gas Production Technique as an Index of the Nutritive Val...IOSRJAVS
: The in vitro gas production technique was used to predict rumen fermentable organic matter, gas production kinetics, organic matter digestibility as well as metabolizable energy were evaluated in green shoot, leaves, fruits flesh and seed cakes of Ziziphus spina-christi tree. A gas production was measured by incubating samples in buffered rumen fluid from cannulated steer for 72 h. Total gas production was recorded at 0,3, 6, 9, 12, 24, 48, and 72 h of incubation periods and kinetics of gas production was described. The chemical analysis of these Ziziphus spina-christi parts, showed that, Leaves contained high protein (14.77±0.23g/kg) and green shoot less protein (8.03±0.15g/kg),however, high ash content was observed in green shoot (10.03±0.07g/kg) compare to other parts. seed cakes has the highest crude fibre content in comparison to other parts (32.46±0.01),while fruits flesh contained the highest ether extract(72.39±0.03).The maximum gas volume was highest for fruits flesh followed by seed cakes, green shoot and leaves after 24hr of incubation. In this study flesh had a significantly higher (P<0.05) gas production from rapid soluble fraction (a) than the other parts, while Ziziphus spina-christi leaves showed the highest gas production from slowly degradable fraction (b) .Organic matter digestibility range was (51.90– 43.79%) and Metabolisable energy was found to be (9.16– 6.74MJ/kgDM) in the flesh and green shoot, respectively. It was concluded that, green shoots, leaves, fruit flesh and seed cake of Ziziphus spina-christi have the potential to be used as protein, energy and mineral supplements for ruminants especially during the dry season
The document discusses various advanced techniques used for phytochemical analysis, including separation, isolation, and identification of plant constituents. Gas chromatography-mass spectrometry (GC-MS) and high-performance liquid chromatography (HPLC) are described as important methods for analyzing volatile compounds and quantifying specific phytochemicals. Several studies applying GC-MS, HPLC, and spectrophotometric techniques to characterize phytochemicals in hops, carotenoids in goji berries, and essential oils are summarized. Statistical analysis and identification of compounds using libraries are also mentioned.
This study analyzed 533 animal feed samples collected from India for residues of persistent organochlorine pesticides (OCPs) like hexachlorocyclohexane (HCH) isomers, dichlorodiphenyltrichloroethane (DDT) complex, endosulfan and dicofol. 56.47% of samples tested positive for these pesticides. The mean concentration of β-HCH was highest among HCH isomers. DDT complex residues ranged from 0.016 to 0.118 mg/kg. Endosulfan was also detected but dicofol was found in very few samples. While residues were present, most were within established safety limits. The major sources of
UV Spectrophotometric Method Development and Validation for Quantitative Esti...Sagar Savale
This document describes the development and validation of a UV spectrophotometric method for the quantitative estimation of paracetamol. Paracetamol was found to exhibit maximum absorption at 244 nm in methanol. The method was validated according to ICH guidelines and showed good linearity (R2 = 0.9999), recovery (99.78-100.54%), precision (<0.06% RSD), ruggedness (<0.02% RSD), and sensitivity (LOD = 0.37 μg/ml, LOQ = 0.98 μg/ml). The developed method is simple, rapid, economical and suitable for the analysis of paracetamol in bulk drug samples.
This research paper evaluates two methods, machine learning algorithms and radiative transfer model inversion, for estimating chlorophyll content in tea leaves with different shading treatments using hyperspectral reflectance measurements. Regression models based on machine learning, specifically kernel-based extreme learning machine, achieved the highest performance with a root mean square error of 3.04 mg/cm2 for predicting chlorophyll content in an independent test set. The PROSPECT-D radiative transfer model inversion also showed potential for quantifying chlorophyll content but requires some improvements. A total of 96 published vegetation indices were also evaluated as inputs to the machine learning models. The study aims to develop an accurate non-destructive method for estimating chlorophyll content in tea leaves grown
Chemometrical Optimization for Fourier Transform Near Infrared Analysis of Su...IJERD Editor
Real-time evaluation of sugar quality requires determining the content of sugar brix in the steps of
the cane sugar process. Sugar brix is a key indicator for evaluating sugar quality. Fourier transform near infrared
(FTNIR) spectroscopy is a simple, rapid and non-destructive technology on the analysis of material contents. In
this study, the chemometric algorithm of parameter-combined tuning of Savitzky-Golay (SG) smoother and
Partial Least Squares (PLS) regression was utilized for FTNIR analysis of sugar brix content in sugarcane
clarified juice, an important intermediate product in cane sugar industry. The algorithms of combined
optimization of SG smoother and PLS regression was achieved and the calibration models were established
optimized by screening the expanded 540 SG smoothing modes and the 1-30 latent valuables (LV). The
optimized models have high predictive accuracy. These results confirm that the combined optimization of SG
smoothing modes and PLS LVs is effective in the quantitative determination of sugar brix contents in sugarcane
clarified juice, and that the FTNIR spectroscopic technology with its chemometric algorithms have the potential
in the analysis of cane sugar intermediates.
Analysis of Herbicide Atrazine and Its Degradation Products in Agricultural S...Agriculture Journal IJOEAR
Abstract— A novel ultra-performance liquid chromatography‒mass spectrometry (UPLC‒MS) method was developed for the determination of herbicide atrazine (ATR) and its principal metabolites namely deisopropylatrazine (DIA), deethylatrazine (DEA) and hydroxyatrazine (HA) in soils. The limit of detection ranged from 0.06 μg kg‒1 (DEA) to 0.25 μg kg‒1 (HA). Recoveries for the four target analytes at three spiked levels ranged from 73.2 to 110% with relative standard deviation of 5.1‒8.1%. In the cases of the three control soil samples spiked with ATR were treated for 60d, the sum content of the three degraded products is 3, 6.4, and 6.8 times greater than ATR residue, respectively. Analyzing 80 soil samples from four counties evaluated this method. ATR of 1.1‒125 μg kg‒1 in 80 of 80 samples, ATR of 0.5‒7.8 μg kg‒1 in 39 of 80 samples, and DIA of 0.5 and 0.6 μg kg‒1 in 2 of 80 samples were found. The proposed method can ensure the rapid and highly sensitive analysis of atrazine and its degradation products in soil, and can provide a direction for proper application of atrazine and a base for evaluating their hazards to the environment.
- The study analyzed rennet coagulation time (RCT), curd-firming rate, and curd firmness in milk samples from Brown Swiss cows using both a mechanical instrument (Formagraph) and an optical instrument (Optigraph).
- Traits were measured over an extended 45 minute period instead of the standard 30 minutes to capture data from all samples, including those that do not coagulate within 30 minutes.
- Heritability estimates were generated for each trait using both instruments to assess the genetic determinism and compare the instruments. Heritability estimates ranged from 0.12 to 0.23.
- Phenotypic and genetic correlations between traits measured by the two instruments were also estimated.
This document summarizes the development and validation of a sensitive LC-MS/MS method for quantifying acamprosate (ACM) levels in human plasma. Key points:
- ACM is a drug used to treat alcohol dependence. Previous methods for quantifying ACM required complex extraction/derivatization steps.
- A rapid LC-MS/MS method was developed involving a simple protein precipitation extraction. Chromatographic separation was achieved using a C18 column with mobile phase of ammonium acetate and acetonitrile.
- Validation showed the method was linear, accurate, precise and sensitive down to 7 ng/mL. Matrix effects were eliminated using an orthogonal spray ionization source.
Near and mid-infrared spectroscopic determination of algal compositionzhenhua82
Near- and mid-infrared spectroscopy were evaluated for their ability to determine the composition of algal turf scrubber (ATS) samples. A set of 117 ATS samples spanning a range of nitrogen, phosphorus, ash, sugar, lipid, and fatty acid contents were analyzed using near-infrared reflectance spectroscopy (NIRS), mid-infrared reflectance spectroscopy (MIRS), and conventional wet chemistry methods. NIRS and MIRS produced accurate determinations of ash and total nitrogen content but not phosphorus, total sugar, or mono-sugar content. Neither NIRS nor MIRS could accurately determine lipid or total fatty acid content in ATS samples. The results indicate that N
RP-HPLC method development and validation of ritonavir in bulk and pharmaceut...SriramNagarajan17
This document describes the development and validation of an RP-HPLC method for the quantification of the HIV protease inhibitor ritonavir (RIT) in bulk and pharmaceutical dosage forms. A simple isocratic RP-HPLC method was developed using a C18 column, mobile phase of 0.02M potassium dihydrogen phosphate buffer and acetonitrile (70:30 v/v), and detection at 237 nm. The method was validated per ICH guidelines and showed good linearity from 25-150 μg/mL, precision <0.5% RSD, accuracy of 99.3-100.6% recovery, and ability to quantify RIT in pharmaceutical tablets without interference from excipients.
Determination of Propionates and Propionic Acid in Bread Samples Using High P...theijes
In the present study, a HPLC method for determination of the preservative propionates in 7 groups of industrial bread samples is described. The separation the propionates were performed on the C18- column and Na2SO4 (8.0 mM) + H2SO4 (1.0 mM): acetonitrile (90:10, v/v %) as mobile phase. The detector wavelength was set at 210 nm. Separation of the propionates was achieved in less than 8 min. The samples first were milled and then extracted with 0.1 mol L-1 NaOH solution under ultrasonic irradiation. After centrifuge, supernatant clear solution was filtered using 0.45 µm Nylon syringe filter and 25 µL of solution was injected to HPLC loop. Analytical characteristics of the method such as limit of detection (LOD= 5 mg L-1 ), recovery percentage (>91%) and reproducibility (RSD=3.5 %) were evaluated. A plot of peak area (y) versus concentration of propionate (x, mg Kg-1 ) was linear over 10-1000 mg Kg-1 . The calibration graph can be described by the equation y = 301.64x + 9963 (r2= 0.991). The levels of propionates in bread samples ranged from 3683-4752 mg Kg-1. The results stated that High performance liquid chromatography is a simple and rapid method for the determination of propionates in bakery products.
The document discusses applications of liquid chromatography-mass spectrometry (LCMS). It describes how LCMS combines liquid chromatography separation with mass spectrometry detection. Several studies using LCMS are summarized, including analyzing phytochemicals in Solanum plants and identifying compounds in Archidendron bubalinum seed shell extracts. Key components detected include chlorogenic acids, flavonoids, alkaloids, and the compounds phlorizin and astilbin.
Chromatography is a technique for separating various inorganic and organic compounds. It is one of the separation techniques used as differential migration. It is more advantageous over conventional separating methods such as crystallization, solvent extraction and distillation. The purpose of presentation is to present various chromatographic techniques included a few advanced forms such as FC, HPLC,UPLC and UPCC (Super Critical chromatography).These are rapid forms of chromatographic techniques based on air pressure driven, optimized for rapid and precise separation of an organic compound.
Similar to Identification and quantitative determination of 2-acetyl-1-pyrroline using GC-TOF MS combined with HS and HS-SPME pretreatment (3).pdf (20)
Executive Directors Chat Leveraging AI for Diversity, Equity, and InclusionTechSoup
Let’s explore the intersection of technology and equity in the final session of our DEI series. Discover how AI tools, like ChatGPT, can be used to support and enhance your nonprofit's DEI initiatives. Participants will gain insights into practical AI applications and get tips for leveraging technology to advance their DEI goals.
it describes the bony anatomy including the femoral head , acetabulum, labrum . also discusses the capsule , ligaments . muscle that act on the hip joint and the range of motion are outlined. factors affecting hip joint stability and weight transmission through the joint are summarized.
हिंदी वर्णमाला पीपीटी, hindi alphabet PPT presentation, hindi varnamala PPT, Hindi Varnamala pdf, हिंदी स्वर, हिंदी व्यंजन, sikhiye hindi varnmala, dr. mulla adam ali, hindi language and literature, hindi alphabet with drawing, hindi alphabet pdf, hindi varnamala for childrens, hindi language, hindi varnamala practice for kids, https://www.drmullaadamali.com
The simplified electron and muon model, Oscillating Spacetime: The Foundation...RitikBhardwaj56
Discover the Simplified Electron and Muon Model: A New Wave-Based Approach to Understanding Particles delves into a groundbreaking theory that presents electrons and muons as rotating soliton waves within oscillating spacetime. Geared towards students, researchers, and science buffs, this book breaks down complex ideas into simple explanations. It covers topics such as electron waves, temporal dynamics, and the implications of this model on particle physics. With clear illustrations and easy-to-follow explanations, readers will gain a new outlook on the universe's fundamental nature.
বাংলাদেশের অর্থনৈতিক সমীক্ষা ২০২৪ [Bangladesh Economic Review 2024 Bangla.pdf] কম্পিউটার , ট্যাব ও স্মার্ট ফোন ভার্সন সহ সম্পূর্ণ বাংলা ই-বুক বা pdf বই " সুচিপত্র ...বুকমার্ক মেনু 🔖 ও হাইপার লিংক মেনু 📝👆 যুক্ত ..
আমাদের সবার জন্য খুব খুব গুরুত্বপূর্ণ একটি বই ..বিসিএস, ব্যাংক, ইউনিভার্সিটি ভর্তি ও যে কোন প্রতিযোগিতা মূলক পরীক্ষার জন্য এর খুব ইম্পরট্যান্ট একটি বিষয় ...তাছাড়া বাংলাদেশের সাম্প্রতিক যে কোন ডাটা বা তথ্য এই বইতে পাবেন ...
তাই একজন নাগরিক হিসাবে এই তথ্য গুলো আপনার জানা প্রয়োজন ...।
বিসিএস ও ব্যাংক এর লিখিত পরীক্ষা ...+এছাড়া মাধ্যমিক ও উচ্চমাধ্যমিকের স্টুডেন্টদের জন্য অনেক কাজে আসবে ...
Strategies for Effective Upskilling is a presentation by Chinwendu Peace in a Your Skill Boost Masterclass organisation by the Excellence Foundation for South Sudan on 08th and 09th June 2024 from 1 PM to 3 PM on each day.
This presentation includes basic of PCOS their pathology and treatment and also Ayurveda correlation of PCOS and Ayurvedic line of treatment mentioned in classics.
This presentation was provided by Steph Pollock of The American Psychological Association’s Journals Program, and Damita Snow, of The American Society of Civil Engineers (ASCE), for the initial session of NISO's 2024 Training Series "DEIA in the Scholarly Landscape." Session One: 'Setting Expectations: a DEIA Primer,' was held June 6, 2024.
Main Java[All of the Base Concepts}.docxadhitya5119
This is part 1 of my Java Learning Journey. This Contains Custom methods, classes, constructors, packages, multithreading , try- catch block, finally block and more.
A workshop hosted by the South African Journal of Science aimed at postgraduate students and early career researchers with little or no experience in writing and publishing journal articles.
2. Journal of Cereal Science 93 (2020) 102975
2
included steam distillation, indirect steam distillation, solvent extrac
tion, supercritical fluid extraction (Lin et al., 1990; Mahatheeranont
et al., 2001) and headspace (HS) method, such as static headspace,
dynamic headspace, headspace sorptive extraction and headspace-solid
phase micro-extraction (HS-SPME) (Sansenya et al., 2018; Lee et al.,
2019). Among them, HS method was more favored by researchers now
because the volatiles extracted from headspace were closer to that
perceived during consuming (Lin et al., 2018). HS-SPME was thought to
be a simple, rapid, and sensitive method for collecting headspace vola
tiles, and was widely used for quantitative determination of 2-AP in rice
(Grimm et al., 2001; Maraval et al., 2010; Mathure et al., 2011; Ying
et al., 2011; Hopfer et al., 2016). Flame ionization detector (FID) has
been the most widely used gas chromatography detector due to the
advantages of high sensitivity, fast response, and accurate quantification
(Sriseadka et al., 2006; Mathure et al., 2011; Lee et al., 2019). However,
it has limited ability in qualitative analysis. Mass spectrometry (MS) was
also a commonly used detector with the advantages of high sensitivity
and excellent qualitative ability (Yoshihashi, 2002; Hien et al., 2006;
Hopfer et al., 2016). MS can detect all compounds that be ionized,
obtaining mass spectrum at each time point which will provide infor
mation of molecular structure of compounds. Combined with the high
separation efficiency of GC and quantitative ability of MS, qualitative
and quantitative work can be performed simultaneously by GC-MS.
Single ion monitoring (SIM) mode and MS/MS mode were used for
quantitative determination of 2-AP in rice (Yoshihashi, 2002; Hien et al.,
2006). Time-of-flight mass spectrometry (TOF MS) was superior to
general mass spectrometry in terms of resolution, mass accuracy,
sensitivity, scan speed, detection limit and qualitative capability (Gar
cía-Reyes et al., 2006). The mass-to-charge ratio (m/z) for target frag
ment obtained by TOF MS was consistent with calculated theoretical
value with mass accuracy error lower than 2 ppm (García-Reyes et al.,
2006). It eliminated the interference of fragments with similar m/z.
Besides, it was suitable for compound analysis without standard mate
rials. Hence, gas chromatography-time-of-flight mass spectrometry
(GC-TOF MS) has played an important role in compound analysis
especially in screening analysis.
However, no work on quantitative analysis of 2-AP in rice using GC-
TOF MS had been reported. In this paper, GC-TOF MS combined with HS
or HS-SPME extraction method was applied for determination of 2-AP in
rice. The conditions for headspace-gas chromatography-time-of-flight
mass spectrometry (HS-GC-TOF MS) and headspace-solid phase micro-
extraction-gas chromatography-time-of-flight mass spectrometry (HS-
SPME-GC-TOF MS) were optimized and the performance were
demonstrated.
2. Material and methods
2.1. Chemicals and instrument
2-Acetyl-1-pyrroline (25 mg, 10% w/w in Toluene) was from Tor
onto Research Chemicals (Toronto, Ontario, Canada). And the internal
standard, 2-methyl-3-heptanone (purity 99.9%), was from Sigma-
Aldrich (St. Louis, Missouri, USA). Solvents, toluene (purity 99.9%)
and ethanol (purity 99.5%), were all from TEDIA Company Inc. (Ohio,
USA).
2-AP and 2-methyl-3-heptanone were extracted and concentrated by
using SPME fiber (1 cm, 50/30 μm Divinylbenzene/Carboxen/Poly
dimethylsiloxane (DVB/CAR/PDMS)) (SAAB-57329U) attached to
SPME manual holder (SAAB-57330U) (Supelco, Bellefonte, PA, USA) or
using the headspace system (7697 A Headspace Sampler, Agilent, Cali
fornia, USA). Separation of collected volatiles was performed by using
GC system (7890 B GC, Agilent) with DB-WAX column (30 m � 0.25 mm
� 0.25 μm, Agilent). Identification of them was done by using GC/MS
system (7200 Q-TOF GC/MS, Agilent, California, USA).
2.2. Rice samples and pretreatment
Eight types of rice samples (Matrix sample: Zhongzao 39; Samples 1
to 3: Yuexiuyou 376, Nanjingxiangzhan, and Ruanhuayoujinsizhan;
Samples 4 to 7: different batches of Yumizhan) were provided by Rice
Product Quality Supervision and Inspection Center, Ministry of Agri
culture and Rural Affairs. Thai aromatic rice purchased from a local
store was used as a sample for optimization experiments. Before testing,
rice samples were husked and milled until most of bran and part of
embryo had been removed. Then, part of milled rice samples was ground
into flour by using a Cyclotec 1093 sample mill (Foss Tecator, Sweden).
The milled rice and rice flour samples were ready for use.
2.3. Determination of 2-AP using HS-GC-TOF MS method
1 g matrix flour sample, 50 μL ethanol and 10 μL 0.102 μg mL 1
internal standard solution was added to 20 mL headspace vial in order
under ice bath conditions. Next, 10 μL 0, 0.1, 0.5, 1, 5, 10 and 15 μg
mL 1
2-AP standard solutions, respectively, were added to vial to pre
pare matrix-matched standard samples. After sealed, the vials were
transposed into the headspace system, and each sample was repeated
twice.
After stabilized in the headspace system at 90 �
C for 30 min, the
upper gas was injected into GC-TOF MS for testing. The split ratio was
set at 5:1 and the solvent delay time was set to 5 min. The oven tem
perature was kept at 40 �
C for 5 min, then programmed to 240 �
C at a
rate of 30 �
C∙min 1
and kept for 5 min. The injector, ion source,
quadrupole, and transfer line temperatures were set at 250 �
C, 230 �
C,
150 �
C, and 280 �
C, respectively. Ionization was performed under
electronic impact (EI) mode and the electron ionization source was 70
eV. High purity helium (purity > 99.999%) was used as carrier gas with
a flow rate of 1 mL min 1
. Full scan mode with a scan range of m/z
40–500 was adopted.
After data acquisition was completed, the chromatograms of 2-AP
and internal standard were extracted with m/z of 83.0728 and
128.1191, respectively. Among them, the sample without adding 2-AP
standard solution was set as the blank group. Calculated the response
ratios of 2-AP to internal standard in the other six matrix-matched
samples with the blanks deducted. Matrix-matched standard curve
was constructed based on the response ratios and the spiking content of
2-AP.
When measuring samples, 1 g rice flour sample, 50 μL ethanol and
10 μL 0.102 μg mL 1
internal standard solution was added to 20 mL
headspace vial in order under ice bath conditions. After sealed, the vials
were transposed into the headspace system, and each sample was
repeated twice. Other conditions were consistent with those of matrix-
matched standard samples. After data acquisition was completed, the
response ratios of 2-AP to internal standard were first calculated, and
then 2-AP content in the samples were calculated according to matrix-
matched standard curve.
2.4. Determination of 2-AP using HS-SPME-GC-TOF MS method
Except for the use of 200 μL extractant, the preparation processes for
matrix-matched standard samples and test samples were the same as
those in section 2.3. After the sample preparation was completed, the
SPME fiber was exposed to the headspace of the vial, and the extraction
device was fixed in a water bath at 80 �
C. After 10 min of stabilization
and 40 min of extraction, the SPME fiber was inserted to the GC injector
for desorption at 250 �
C for 5 min.
In HS-SPME-GC-TOF MS method, the parameters of GC-TOF MS were
exactly the same as those in section 2.3 except for the split ratio and the
solvent delay time. The split ratio was set at 20:1 and the solvent delay
time was set to 7 min. Each sample was also repeated twice. The pro
cesses of establishing matrix-matched standard curve and calculating 2-
AP content of samples were the same as those in section 2.3.
Z. Guo et al.
3. Journal of Cereal Science 93 (2020) 102975
3
2.5. Sensory evaluation
Sensory evaluation of rice aroma was performed according to the
agricultural industry standard of China NY/T 596–2002 “Aromatic rice”
with some modification. Firstly, five cooked rice water samples and one
cooked rice sample were prepared for each sample. 2 g milled sample
was placed into porcelain bowl. After adding 50 mL distilled water, the
porcelain bowl was covered with the lid and stewed for 15 min. After
slightly cooled, the prepared cooked rice water sample was ready for
sensory evaluation with respect to flavor intensity, flavor types and
flavor descriptions. At the same time, cooked rice sample was also
prepared for identifying aroma retention intensity, aroma retention
duration and comprehensive impression. 40 g milled rice was washed
for twice and soaked with 1.2 times mass of water for 30 min before
cooked for 40 min, and finally simmer for 20 min.
Then, five skilled panelists scored the cooked rice water sample and
cooked rice sample by using their sense. Based on the sensory evaluation
of one panelist, overall sensory score was obtained as: overall sensory
score ¼ flavor intensity score þ flavor type score þ aroma retention
intensity score þ aroma retention duration score þ comprehensive
impression score. Finally, ultimate score of test sample was determined
as the average value of five sensory scores.
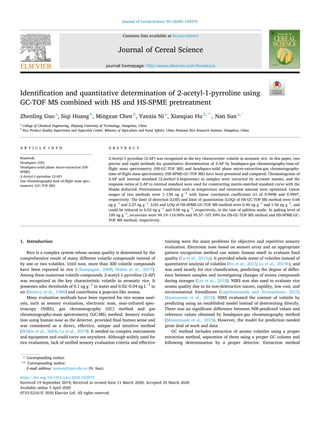
Fig. 1. Mass spectrum of 2-AP (A) and 2-methyl-3-heptanone (D) obtained by using HS-GC-TOF MS method. (A) 10 μL 10 μg mL 1
2-AP was added for analysis. (D)
10 μL 0.102 μg mL 1
2-methyl-3-heptanone was added for analysis. (B) EIC chromatogram for 2-AP, m/z of 83.0728 was used for extraction. (C) EIC chromatogram
for 2-methyl-3-heptanone, m/z of 128.1191 was used for extraction. a, b and c represent three repeats under the same experimental conditions, respectively.
Z. Guo et al.
4. Journal of Cereal Science 93 (2020) 102975
4
3. Results and discussion
3.1. Qualitative and quantitative analysis of 2-AP and 2-methyl-3-
heptanone
Searching NIST library combined with comparing retention index
(RI) was widely used for qualitative analysis of volatiles. However, it
was more suitable for qualitative analysis of pure compounds than
complex samples. GC-TOF MS plays an important role in compound
analysis, especially in screening analysis due to its advantage of high
resolution, high mass accuracy and high sensitivity. In this paper, exact
mass obtained from GC-TOF MS as well as the retention time was used
for qualitative analysis of target compounds. The fragment of target
compound was extracted from scan mode data using exact mass with
mass accuracy error of 10 ppm. Due to the high-resolution of data, the
target compound could be separated from background interference,
eliminating the interference of other compounds in sample and conse
quently reducing the detection limit. The m/z of 111, 83, and 68 were
often mentioned as characteristic fragments of 2-AP in the literature
(Ying et al., 2011; Liu et al., 2015; Peddamma et al., 2018). Fig. 1(A)
showed a mass spectrum of 2-AP standard solution obtained by using
HS-GC-TOF MS method and the m/z of fragments were 111.0672,
83.0728, 82.0646, 69.0563, 68.0491, 55.0424, 45.0336, 43.0181, etc.
Since the information of mass spectra obtained by using HS-GC-TOF MS
method and HS-SPME-GC-TOF MS method was more detailed and ac
curate, they could both be stored as high-resolution mass spectra of 2-AP
standard. Among them, the fragment ion with m/z of 83.0728 was a
base peak generated by α-cleavage reaction of a carbonyl group, and its
fragment ion was þ
C5H9N. By using m/z of 83.0728, the extracted ion
chromatogram (EIC) of 2-AP was extracted from the total ion chro
matogram (Fig. 1(B)). The retention time of 2-AP obtained by using
HS-GC-TOF MS method was 8.885 � 0.003 min, the average peak area
was 5.53eþ06 (relative standard deviation (RSD) was 5.56%). The
retention time of 2-AP obtained by using HS-SPME-GC-TOF MS method
was 8.556 � 0.001 min.
Internal standards were often used to overcome the effects of 2-AP
instability, which was caused by volatility and oxidation of 2-AP. The
physicochemical properties of internal standard should be similar to
those of 2-AP (e.g., relative molecular mass, melting point, density, etc.),
while it could be completely separated from 2-AP during detection.
Besides, it should not be present in the sample or react chemically with
the sample. From the perspective of internal standard selection, isotope
was the most ideal internal standard (Yoshihashi, 2002; Hopfer et al.,
2016). The stable isotope dilution method and isotope internal standard
method were the future research trends. However, 2-methyl-3-hepta
none was selected as internal standard in this paper due to the limited
sources and expensive cost of stable isotopes. In addition, the process of
sample preparation was completed under ice bath conditions to mini
mize errors caused by the instability of 2-AP.
Exact mass and retention time were also used for qualitative analysis
of internal standard solution. The internal standard was diluted to 0.102
μg mL 1
. Then 10 μL internal standard solution was extracted and
analyzed (n ¼ 3). Fig. 1(D) showed a mass spectrum of 2-methyl-3-hep
tanone obtained by using HS-GC-TOF MS method and the m/z of frag
ments were 128.1191, 86.0720, 85.0646, 71.0488, 57.0700. 43.0545,
41.0388, etc. Among them, the fragment ion with m/z of 57.0700 had
the highest intensity, which was one of the main fragment ion peaks
generated by the α-cleavage reactions, and its fragment ion was þ
C4H9.
However, the fragment ion þ
C4H9 was not only detected in 2-methyl-3-
heptanone but also in other compounds, besides, it was a common
source of pollution in the equipment. Therefore, this fragment ion
couldn’t be used to extract a clean EIC from the total ion chromatogram.
In this paper, EIC of internal standard was extracted by using the mo
lecular ion peak with m/z of 128.1191. It could be seen from Fig. 1(C)
that the retention time of 2-methyl-3-heptanone obtained by using HS-
GC-TOF MS method was 7.358 � 0.001 min, the average peak area
was 2.74eþ06 (RSD ¼ 3.85%). The retention time of 2-methyl-3-hepta
none obtained by using HS-SPME-GC-TOF MS method was 7.223 �
0.005 min.
Furthermore, in this paper, the quantitative analysis of 2-AP in
sample was carried out by using standard curve method combined with
internal standard method. The standard curve method was particularly
suitable for the analysis of a large number of samples, and the internal
standard method to a certain extent eliminated the effects of the pre
treatment conditions (e.g., operating conditions, sample volume, etc.)
on the quantitative results (Amirahmadi et al., 2013; Shoeibi et al.,
2014).
3.2. Optimization of extraction conditions
Thai aromatic rice with high aroma and high 2-AP content was used
as the test sample in this paper for optimization of extraction conditions
such as extractant, extractant amount and extraction temperature.
3.2.1. Extractant
Hopfer et al. (Hopfer et al., 2016) used ethyl acetate as extractant in
combination with isotope internal standard method to obtain the lowest
detection limit to date. In addition, ethanol (Hu et al., 2014; Wakte et al.,
2017) has been one of the most commonly used extractants. Compared
to other organic solvents, ethanol and ethyl acetate were relatively safe
and green. Therefore, the extractant was selected among these two
organic solvents in this paper.
During HS extraction, 1 g Thai aromatic rice flour sample was
extracted at a steady temperature of 70 �
C for 30 min both without
extractant and with 100 μL ethanol or ethyl acetate. As shown in Fig. 2
(A), the extraction efficiency of 2-AP could be increased by 3–5 times
after adding extractant. It was preferred to add an extractant to the
sample in this paper. The extraction efficiency of adding ethanol was
about 1.5 times that of ethyl acetate. Therefore, ethanol was used as the
extractant in HS-GC-TOF MS method. During HS-SPME extraction, 1 g
Thai aromatic rice flour sample was extracted at water bath temperature
of 60 �
C for 50 min both without extractant and with 100 μL ethanol or
ethyl acetate. It could be seen from Fig. 2(B) that the extraction effi
ciency of adding ethanol was about 2.5 times that of ethyl acetate.
Therefore, ethanol was also used as the extractant in HS-SPME-GC-TOF
MS method.
3.2.2. Amount of extractant and extraction temperature
The extraction conditions for the combination of five extractant
amounts (0, 50, 100, 200, and 400 μL) and four extraction temperatures
(60, 70, 80, and 90 �
C) were tested under both two extraction methods.
When using HS extraction method, the extraction efficiency
increased first and then decreased with the increase of extractant
amount at the same extraction temperature, as shown in Fig. 2(C).
Among them, the extraction efficiency of 50 μL and 100 μL extractant
was better than that of 0, 200 and 400 μL in most cases. Excessive
extractant competed with the target during extraction process, reducing
the extraction efficiency of the target. Besides, it showed that the
extraction efficiency was increased with the increase of extraction
temperature in the case of the same amount of extractant in Fig. 2(C).
Increased temperature led to intense molecular thermal motion which
improved extraction efficiency of the target. However, too high pre
treatment temperature would also lead to the synthesis of new 2-AP in
sample, resulting in higher results (Yoshihashi, 2002; Maraval et al.,
2010; Liu et al., 2015; Hopfer et al., 2016). There is no consensus on
whether high temperature will lead to synthesis of new 2-AP in rice
sample. The extraction temperatures were set around 50 �
C (Hopfer
et al., 2016; Peddamma et al., 2018) in some literature while some were
set at 80 �
C (Grimm et al., 2001; Hu et al., 2014). Reliable results had
also been obtained at 120 �
C (Sriseadka et al., 2006; Sansenya et al.,
2018). In order to ensure the reliability of results, the extraction tem
perature was controlled below 100 �
C in this paper. Based on the
Z. Guo et al.
5. Journal of Cereal Science 93 (2020) 102975
5
comprehensive analysis of extraction results, extraction temperature of
90 �
C and extractant amount of 50 μL was selected as the final extraction
condition for HS extraction method.
Similarly, when using HS-SPME extraction method, the extraction
efficiency increased first and then decreased with the increase of
extractant amount at the same extraction temperature (Fig. 2(D)). The
extraction efficiency of 100 μL and 200 μL extractant was better than
that of 0, 50 and 400 μL. The extraction efficiency was not remarkable
with low amount extractant. When the amount of extractant was
excessive, extractant would cause adsorption competition in the SPME
fiber head, resulting in a decrease in the adsorption effect of the target. It
could also be seen from Fig. 2(D) that the extraction efficiency also
increased first and then decreased with the increase of extraction tem
perature with the same amount of extractant. Increased temperature
improved extraction efficiency of 2-AP, but too high temperature would
reduce it. By observing the experimental phenomena, we speculated that
too high temperature caused expansion of the septum and consequently
broken of the seal of vial, causing loss of target and reducing the
Fig. 2. Effect of extractant (A, B), extractant amount and extraction temperature (C, D) on extraction efficiency. (A) Effect of different extractants on extraction
efficiency by using HS extraction method. Extraction temperature: 70 �
C, stabilization time: 30 min, amount of extractant: 100 μL; (B) Effect of different extractants
on extraction efficiency by using HS-SPME extraction method. Extraction temperature: 60 �
C, extraction time: 50 min, amount of extractant: 100 μL; (C) Effect of
extraction temperature and extractant amount on extraction efficiency by using HS extraction method; (D) Effect of extraction temperature and extractant amount on
extraction efficiency by using HS-SPME extraction method.
Z. Guo et al.
6. Journal of Cereal Science 93 (2020) 102975
6
extraction stability. Base on the comprehensive analysis of extraction
results, extraction temperature of 80 �
C and extractant amount of 200 μL
was selected as the final extraction condition for HS-SPME extraction
method.
Under the selected extraction conditions, HS extraction method was
more convenient than HS-SPME extraction method due to its high
automation, while the response signal of HS-SPME extraction method
was higher than that of HS extraction method due to the strong
enrichment ability of SPME fiber.
3.3. Performance
2-AP had a very low sensory threshold (Buttery et al., 1988), and its
content in most rice samples was low. The extraction efficiency of 2-AP
in rice flour sample was quite different from that in standard solution
because of a large matrix effect. Even adding an extractant in rice flour
sample, the extraction efficiency was still somewhat different from that
in standard solution. At spiking level of 100 ng g 1
, recoveries of 2-AP in
HS-GC-TOF MS method were less than 10%. Although the SPME fiber
had a strong enrichment ability, recoveries of 2-AP in HS-SPME-GC-TOF
MS method were also only 69.60%. Therefore, the matrix effect of the
rice flour sample couldn’t be ignored. Matrix-matched standard curve
method was preferred to avoid matrix effects (Jung et al., 2019; Lee
et al., 2019). In this paper, the matrix effect caused by starch adsorption
was reduced by using matrix-matched standard curve established by
adding 2-AP standard solution to rice matrix (Zhongzao 39). At the same
spiking level of 100 ng g 1
, recoveries of 2-AP increased to
94.19–116.00% (n ¼ 3) and 95.57–107.49% (n ¼ 3) for HS-GC-TOF MS
method and HS-SPME-GC-TOF MS method, respectively.
Matrix-matched standard curves of these two methods were obtained
by testing seven types of matrix-matched samples at different spiking
levels of 2-AP (0, 1, 5, 10, 50, 100 and 150 ng g 1
, respectively). Matrix-
matched standard curve equation in HS-GC-TOF MS method was y ¼
0.0018x-0.0001 (r ¼ 0.9998), the limit of detection (LOD, signal-to-nose
ratios (S/N) ¼ 3) was 0.68 ng g 1
, and the limit of quantitation (LOQ, S/
N ¼ 10) was 2.27 ng g 1
. When using HS-SPME extraction method, a
large amount of collected volatiles was desorbed into the instrument due
to the strong enrichment ability of SPME fiber. Excessive target caused
signal saturation in the detector of the mass spectrometer, leading to
signal errors. Therefore, a larger split ratio mode was preferred to use in
HS-SPME-GC-TOF MS method. In the case of a large split ratio, low
limits of detection could still be obtained despite a significant reduction
of the content of targets entering the instrument. When the split ratio
was 20:1, the matrix-matched standard curve equation was y ¼ 0.0097x-
0.0007 (r ¼ 0.9997), LOD was 0.46 ng g 1
, and LOQ was 1.50 ng g 1
. In
addition, LOD and LOQ in splitless mode could be reduced to 0.02 ng g 1
and 0.06 ng g 1
, respectively, which were below the sensory threshold.
The performances of methods established in this paper and some
literature were listed in Table 1. The detection limits of the two methods
established in this paper were lower than that of methods in the litera
ture (Ying et al., 2011; Liu et al., 2015; Peddamma et al., 2018). In the
splitless mode, LOD of HS-SPME-GC-TOF MS method was close to that of
SPME-GC-MS/MS method established by Hoper et al. (2016). As far as
these performances concerned listed in Table 1, both two methods in
this paper met the requirements of daily testing and research.
3.4. Determination of 2-AP in rice flour samples
The sensory scores and 2-AP contents of seven samples were
measured in this paper. As shown in Fig. 3, 2-AP contents measured by
two methods ranged from 81.84 ng g 1
to 1.17 ng g 1
and from 72.00
ng g 1
to 1.00 ng g 1
, respectively. Using paired t-test, there was no
significant difference in 2-AP content measured by two methods (P >
0.05), indicating the reliability of results obtained by two methods. A
weak positive correlation (r ¼ 0.45) was obtained between sensory score
and 2-AP content. According to the agricultural industry standard of
aromatic rice (NY/T 596–2002), only five types of samples were aro
matic rice (sensory score � 60 points). During the sensory evaluation,
samples 3 and 5 were judged as non-aromatic rice because strong rubber
flavor affected the overall flavor. However, 2-AP contents measured in
these two types of samples were 55.87 and 17.33 ng g 1
, respectively,
which was not lowest 2-AP content among the seven types of samples. In
addition, sample 7 with the content of only 1 ng g 1
was also aromatic
rice in the sense of sensory. These phenomena indicated that other
compounds besides 2-AP also affected the aroma intensity of rice. The
most likely reason was that the key compounds for aroma in rice was not
a single 2-AP (Hien et al., 2006). 2-AP has always been the most obvious
feature to distinguish aromatic rice from non-aromatic rice due to its low
sensory threshold. However, the aroma flavor of rice may be produced
integrated expression of more than one volatile compound.
4. Conclusion
In this paper, HS and HS-SPME extraction methods combined with
GC-TOF MS were establish for quantitative analysis of 2-AP. LOD and
LOQ of 0.68 ng g 1
and 2.27 ng g 1
, recoveries of 94.19–116.00%
(spiking level: 100 ng g 1
) were obtained for HS-GC-TOF MS method.
Meanwhile, LOD and LOQ of 0.46 ng g 1
and 1.50 ng g 1
, recoveries of
95.57–107.49% (spiking level: 100 ng g 1
) were obtained for HS-SPME-
GC-TOF MS method. Both two methods had good linearity (1–150 ng
g 1
, r > 0.9995), low detection limits, and high recoveries. And there
was no significant difference in results obtained by these two methods
(p > 0.05), indicating the reliability of the established methods. HS-GC-
TOF MS method was suitable for daily batch detection of samples due to
Table 1
Performances of 2-AP determination methods established in this paper and in some literature.
Sample
volume
Extraction method Split
mode
LOD LOQ RSD Linear range Recovery Ref.
1 g SPME 20:1 0.46 ng g 1
1.50 ng
g 1
7.02–7.77% 1–150 ng g 1
95.57–107.49% Experimental data
No Split 0.02 ng g 1
0.06 ng
g 1
/ / /
HS 5:1 0.68 ng g 1
2.27 ng
g 1
2.34–13.98% 1–150 ng g 1
94.19–116.00%
0.5 g HS No Split 1 ng g 1
5 ng g 1
<5% 0.1–250 ng g 1
/ Peddamma et al.
(2018)
1 g SPME No Split 0.039 ng
g 1
0.103 ng
g 1
5–33% 0.053–5.38 ng
g 1
107–109% Hopfer et al. (2016)
1 g SPME No Split 45.5 ng g 1
152 ng g 1
8.54% 500–4000 ng
g 1
96.3–103.5% Liu et al. (2015)
3 g (NAFION/PDDAC)Homemade SPME
fiber head
/ 0.10 ng
mL 1
/ 5.79% 0.5–8.00 ng
mL 1
105.1–103.9% Hu et al. (2014)
1 g SPME No Split 10 ng g 1
/ 5.09% / 82.57% Ying et al. (2011)
Z. Guo et al.
7. Journal of Cereal Science 93 (2020) 102975
7
its advantages of high automation, simple operation and short prepa
ration time, while HS-SPME-GC-TOF MS method was more suitable for
identifying and analyzing complex samples with low content target due
to the strong enrichment ability of SPME fiber. In addition, sensory re
sults of seven samples had weak positive correlation (r ¼ 0.45) with 2-
AP content. This phenomenon indicated that the aroma flavor of rice
was produced by the comprehensive expression of multiple volatile
compounds, although 2-AP was one of the key components of the aroma.
Other key volatile compounds were needed for further study.
Declaration of competing interest
The authors declare that there is no conflict of interest.
CRediT authorship contribution statement
Zhenling Guo: Investigation, Data curation, Writing - original draft,
Writing - review & editing. Siqi Huang: Investigation, Data curation.
Mingxue Chen: Resources, Funding acquisition. Yanxia Ni: Investiga
tion. Xianqiao Hu: Resources, Writing - review & editing, Supervision,
Funding acquisition. Nan Sun: Resources, Writing - review & editing.
Acknowledgement
This work was supported by Zhejiang Provincial Natural Science
Foundation of China (grant no. LQ15C200007); Agricultural Science
and Technology Innovation Program of CAAS (grant no. CAAS-
XTCX2019024); and the earmarked fund for China Agriculture Research
System (grant no. CARS-01-47).
Appendix A. Supplementary data
Supplementary data to this article can be found online at https://doi.
org/10.1016/j.jcs.2020.102975.
References
Amirahmadi, M., Yazdanpanah, H., Shoeibi, S., Pirali-Hamedani, M., Gholami, M.O.,
Mohseninia, M.F., Kobarfard, F., 2013. Simultaneous determination of 17 pesticide
residues in rice by GC/MS using a direct sample introduction procedure and spiked
calibration curves. Iran. J. Pharm. Res. (IJPR) 12 (2), 295–302.
Buttery, R.G., Turnbaugh, J.G., Ling, L.C., 1988. Contribution of volatiles to rice aroma.
J. Agric. Food Chem. 36 (5), 1006–1009.
Champagne, E.I., 2008. Rice aroma and flavor: a literature review. Cereal Chem. 85 (4),
447–456.
García-Reyes, J.F., Ferrer, C., Thurman, E.M., Fern�
andez-Alba, A.R., Ferrer, I., 2006.
Analysis of herbicides in olive oil by liquid chromatography time-of-flight mass
spectrometry. J. Agric. Food Chem. 54 (18), 6493–6500.
Grimm, C.C., Bergman, C., Delgado, J.T., Bryant, R., 2001. Screening for 2-acetyl-1-
pyrroline in the headspace of rice using SPME/GC-MS. J. Agric. Food Chem. 49 (1),
245–249.
Hien, N.L., Yoshihashi, T., Sarhadi, W.A., Hirata, Y., 2006. Sensory test for aroma and
quantitative analysis of 2-acetyl-1-pyrroline in Asian aromatic rice varieties. Plant
Prod. Sci. 9 (3), 294–297.
Hopfer, H., Jodari, F., Negre-Zakharov, F., Wylie, P.L., Ebeler, S.E., 2016. HS-SPME-GC-
MS/MS method for the rapid and sensitive quantitation of 2-acetyl-1-pyrroline in
single rice kernels. J. Agric. Food Chem. 64, 4114–4120.
Hu, C.Y., Zhu, Y.L., Ye, Y.X., Qiao, Z.Y., Cheng, H.Y., 2014. Preconcentration and
determination of 2-acetyl pyrrolidine in rice based on Nafion and PDDAC coated
solid-phase microextraction. Journal of Suzhou University of Science and
Technology (Natural Science) 31 (4), 42–45þ61.
Ito, M., Ikehama, K., Yoshida, K., Haraguchi, T., Yoshida, M., Wada, K., Uchida, T., 2013.
Bitterness prediction of H1-antihistamines and prediction of masking effects of
artificial sweeteners using an electronic tongue. Int. J. Pharm. 441, 121–127.
Jung, D., Kreher, J.D., Kratz, H.U., Michalik, U., 2019. A new matrix-matched calibration
strategy for static headspace gas chromatography to enable high throughputs in
pharmaceutical quality control laboratories. Analytical Methods 11, 4242–4248.
Lapchareonsuk, R., Sirisomboon, P., 2015. Sensory quality evaluation of rice using
visible and shortwave near-infrared spectroscopy. Int. J. Food Prop. 18 (5),
1128–1138.
Lee, Y.S., Oh, Y., Kim, T.H., Cho, Y.H., 2019. Quantitation of 2-acetyl-1-pyrroline in
aseptic-packaged cooked fragrant rice by HS-SPME/GC-MS. Food Sci. Nutr. 7,
266–272.
Lin, C.F., Hsieh, T.C.Y., Hoff, B.J., 1990. Identification and quantification of the
“popcorn”-like aroma in Louisiana aromatic Della rice (Oryza-sativa, L). J. Food Sci.
55 (5), 1466–1467.
Lin, H., Man, Z.X., Kang, W.C., Guan, B.B., Chen, Q.S., Xue, Z.L., 2018. A novel
colorimetric sensor array based on boron-dipyrromethene dyes for monitoring the
storage time of rice. Food Chem. 268, 300–306.
Liu, H., Rao, D., Ren, Y., Qiu, Y., Chen, X., Xu, Z., 2015. A method on determination the
2-acetyl-1-pyrroline of aromatic rice. J. Hunan Agric. Univ. 41 (3), 234–238.
Lu, L., Deng, S.P., Zhu, Z.W., Tian, S.Y., 2015a. Classification of rice by combining
electronic tongue and nose. Food Analytical Methods 8, 1893–1902.
Lu, L., Fang, C.Y., Hu, Z.Q., Hu, X.Q., Zhu, Z.W., 2019. Grade classification model
tandem BpNN method with multi-metal sensor for rice eating quality evaluation.
Sensor. Actuator. B Chem. 281, 22–27.
Lu, L., Tian, S.Y., Deng, S.P., Zhu, Z.W., Hu, X.Q., 2015b. Determination of rice sensory
quality with similarity analysis-artificial neural network method in electronic tongue
system. RSC Adv. 5, 47900–47908.
Mahatheeranont, S., Keawsa-ard, S., Dumri, K., 2001. Quantification of the rice aroma
compound, 2-acetyl-1-pyrroline, in uncooked Khao Dawk Mali 105 brown rice.
J. Agric. Food Chem. 49 (2), 773–779.
Maneenuam, T., Chanprasert, W., Rittiron, R., Prasertsak, A., Wongpiyachon, S., 2015.
Rapid determination of trace substance, 2-acetyl-1-pyrroline content in Hom Mali
rice using near infrared spectroscopy. J. Near Infrared Spectrosc. 23, 361–367.
Maraval, I., Sen, K., Agrebi, A., Menut, C., Morere, A., Boulanger, R., Gay, F., Mestres, C.,
Gunata, Z., 2010. Quantification of 2-acetyl-1-pyrroline in rice by stable isotope
dilution assay through headspace solid-phase microextraction coupled to gas
chromatography-tandem mass spectrometry. Anal. Chim. Acta 675, 148–155.
Mathure, S.V., Wakte, K.V., Jawali, N., Nadaf, A.B., 2011. Quantification of 2-acetyl-1-
pyrroline and other rice aroma volatiles among Indian scented rice cultivars by HS-
SPME/GC-FID. Food Analytical Methods 4, 326–333.
Peddamma, S.K., Ragichedu, P.K., Maddala, S., Rao, D.S., Lella, V.S.R., Konne, K.,
Sripada, P., Krishnan, G.S., Singh, A.K., Maganti, S.M., 2018. Insight of aroma in
brown rice through chemical assessment of 2-acetyl-1-pyrroline (2AP) in aromatic
germplasm of India. Cereal Chem. 95, 679–688.
Fig. 3. 2-AP contents obtained by the HS-GC-TOF MS method and the HS-SPME-GC-TOF MS method and sensory scores obtained by sensory evaluation for seven
rice samples.
Z. Guo et al.
8. Journal of Cereal Science 93 (2020) 102975
8
Sansenya, S., Hua, Y.L., Chumanee, S., 2018. The correlation between 2-acetyl-1-pyrro
line content, biological compounds and molecular characterization to the aroma
intensities of Thai local rice. J. Oleo Sci. 67 (7), 893–904.
Shoeibi, S., Goudarzi, M.I., Rastegar, H., Janat, B., Sadeghi, N., Hajimahmoodi, M.,
Amirahmadi, M., 2014. Spiked calibration curve: a valid method for simultaneous
analysis of pesticides in melon using gas chromatography mass spectrometry (GC/
MS). Iranian Journal of Chemistry & Chemical Engineering-International English
Edition 33 (3), 21–27.
Sriseadka, T., Wongpornchai, S., Kitsawatpaiboon, P., 2006. Rapid method for
quantitative analysis of the aroma impact compound, 2-acetyl-1-pyrroline, in
fragrant rice using automated headspace gas chromatography. J. Agric. Food Chem.
54 (21), 8183–8189.
Wakte, K., Zanan, R., Hinge, V., Khandagale, K., Nadaf, A., Henry, R., 2017. Thirty-three
years of 2-acetyl-1-pyrroline, a principal basmati aroma compound in scented rice
(Oryza Sativa L.): a status review. Society of Chemical Industry 97, 384–395.
Wilkie, K., Wootton, M., Paton, J.E., 2004. Sensory testing of Australian fragrant,
imported fragrant, and non-fragrant rice aroma. Int. J. Food Prop. 7 (1), 27–36.
Ying, X., Xu, X., Ouyang, Y., Zhu, Z., Chen, M., Han, S., Min, J., 2011. Analysis of
characteristic compound in aroma rice by gas chromatography/mass spectrometry
with solid-phase microextraction. J. Anal. Sci. 27 (1), 69–71.
Yoshihashi, T., 2002. Quantitative analysis on 2-acetyl-1-pyrroline of an aromatic rice by
stable isotope dilution method and model studies on its formation during cooking.
J. Food Sci. 67 (2), 619–622.
Z. Guo et al.