Download to read offline
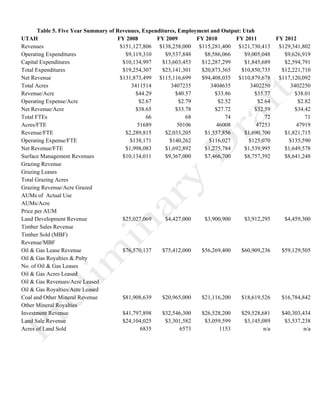
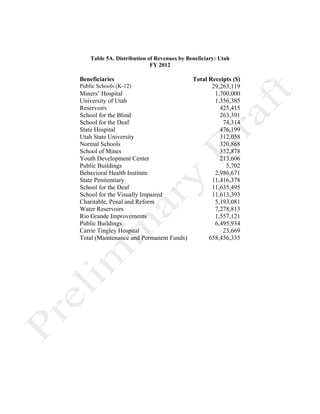
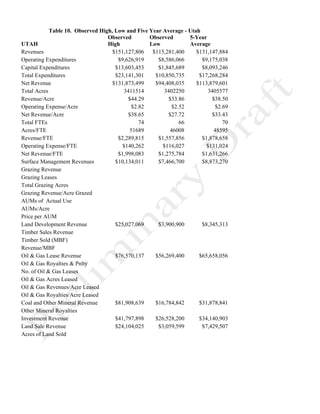
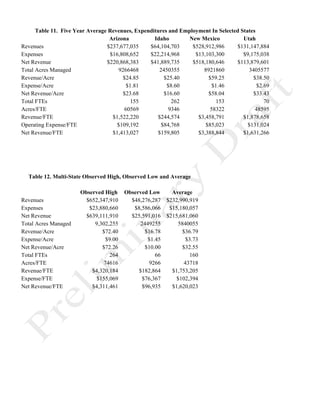
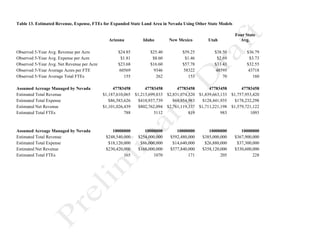
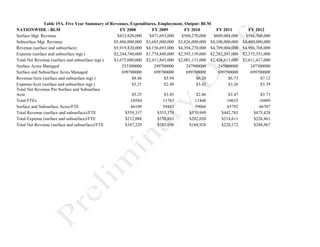

This document contains tables summarizing land management revenues, expenditures, employment, and output for Utah and several other states over a five year period from 2008-2012. It also contains tables projecting potential revenues, expenditures, employment if Nevada were to expand its state land management program based on averages from Utah, Arizona, New Mexico, and Idaho models. Revenues come from sources like surface management, oil and gas leasing, timber, and land sales. Expenditures covered operating and capital costs. Projections for Nevada estimated revenues of $248-592 million, expenditures of $18-86 million, and 165-1070 jobs depending on the state model used.


