Download as PDF, PPTX
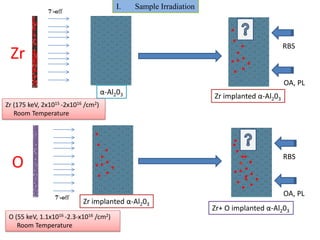
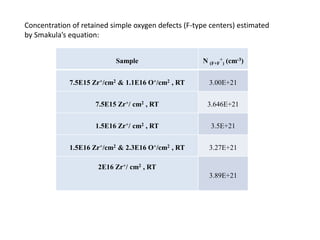
![Buried amorphous layer suggest
concentration of Zr may be
controlling factor
E= 175 keV
Φ= 4E16 Zr+/cm2
120 9
8
100
7
6
80
5
dpa 60 4 Zr%
3
40
2
1
20
0
0 -1
0 500 1000 1500 2000 2500 3000
5
Depth [Å]](https://image.slidesharecdn.com/icdimpresentation-120703104220-phpapp01/85/ICDIM-2012-presentation-5-320.jpg)
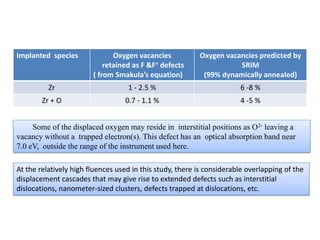
![16
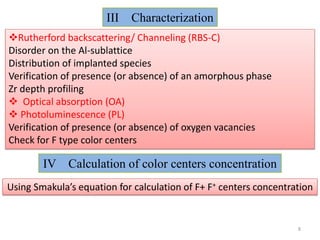
Sample 1.5x10 Zr .cm
+ -2 Rutherford backscattering spectrometry along a
2000
channeling direction (RBS-C) using 2.0 MeV He+
<0001>
1600
O random
1200
Al
Yield
Zr fluence just above amorphization threshold
800 Zr
400
0
100 200 300 400 500 600 700
channel 175 keV
45 3.5
40 Φ=1.5×10¹⁶ 3
35
dpa @ E=175keV, 2.5
30 Φ=1.5E16
40 dpa
25 2
dpa
Zr%
20 1.5
15
1
10
0.5
5
0 0
0 50 100 150 200 250 300
Depth [nm]
40 nm](https://image.slidesharecdn.com/icdimpresentation-120703104220-phpapp01/85/ICDIM-2012-presentation-11-320.jpg)
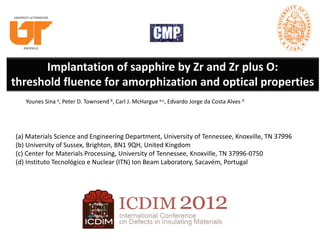
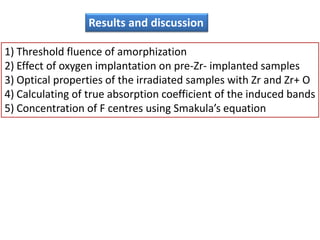
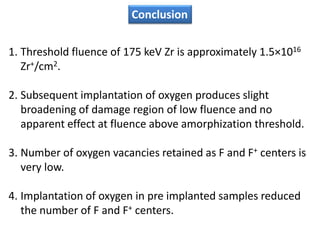
![1800
1600 2E15 Aligned
1400 7.5E15 Aligned
1200
1.5E16 Zr+/cm2 Aligned
1000
Yield
800
600
400
200
By increasing Zr fluence damage in Al and
0 O- sublattices increase
300 800 Energy [keV] 1300 1800
1800
1600 ---- 1.5E16 Zr+/cm2 & 2.3E16 O+/cm2 Aligned
1400
1200
---- 7.5E15 Zr+/cm@ & 1.1E16 O+/cm2 Aligned
1000
Yield
800
By implantation of O in pre-implanted Zr
600
samples, damage in Al sublattice
400
increases and in O sublattice decreases
200
0
300 800 1300 1800
Energy [keV]](https://image.slidesharecdn.com/icdimpresentation-120703104220-phpapp01/85/ICDIM-2012-presentation-13-320.jpg)
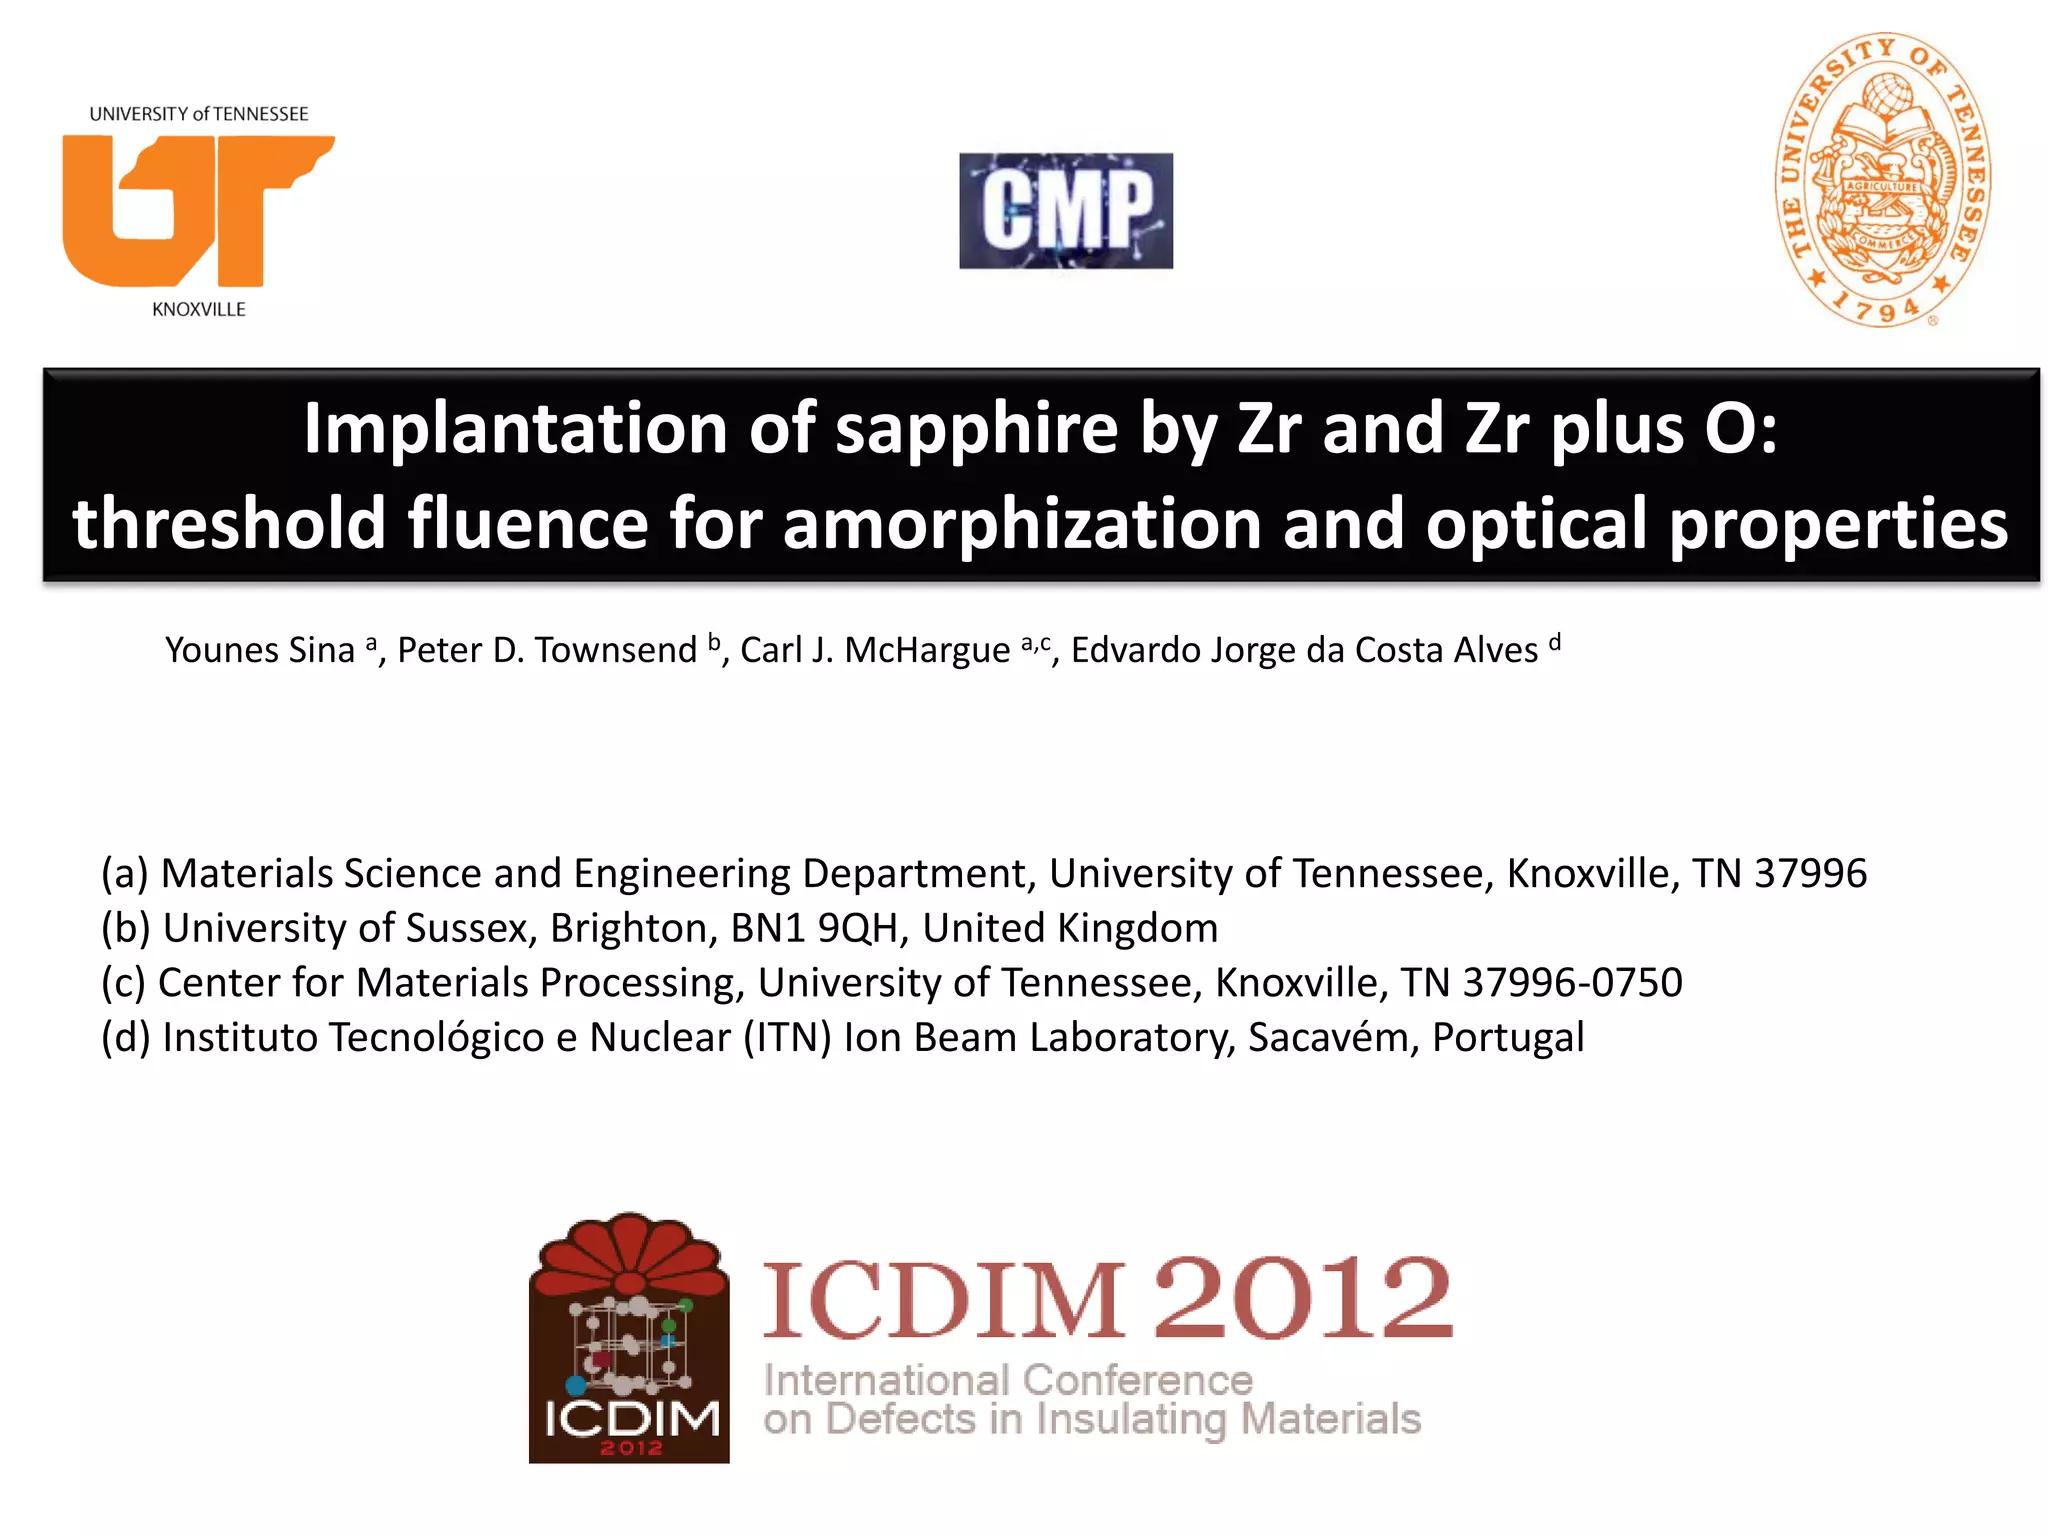
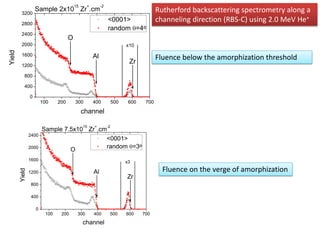
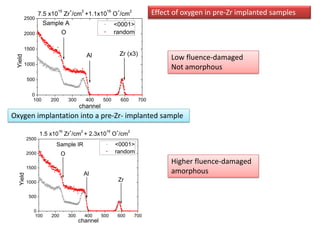
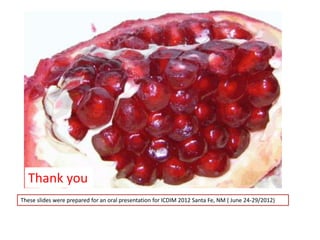
![Zr distribution 2) Effect of oxygen implantation on pre-Zr- implanted samples
400
7.5E15 Zr+/cm2 Random
b
350 1.5E16 Zr+/cm2 Random
7.5E15 Zr+/cm2 & 1.1E16 O+/cm2 Random
300
1.5E16 Zr+/cm2 & 2.3 E16 O+/cm2 Random
250
Yield
200
a
150
100
50
0
1500 1550 1600 1650 1700 1750 1800
Energy [keV]
Zirconium profiles in sapphire implanted with oxygen subsequent to implantation with
Zr: (a) below and (b) at the threshold for amorphization.
The subsequent implantation of oxygen produces a slight broadening of the zirconium
distribution, probably due to collisional mixing](https://image.slidesharecdn.com/icdimpresentation-120703104220-phpapp01/85/ICDIM-2012-presentation-14-320.jpg)
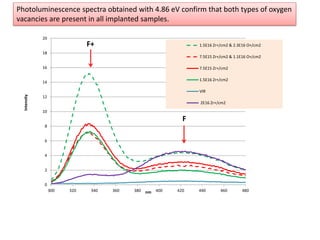
![Optical properties of the irradiated samples with Zr and Zr+ O
F+F+
1
1.5E16 Zr+/cm2 & 2.3E16 O+/cm2 , RT
0.9
2E16 Zr+/cm2 , RT
0.8
Intensity [Arbit. Unit]
0.7 1.5E16 Zr+/cm2 ,RT
0.6
F+ 7.5E15 Zr+/cm2 & 1.1E16 O+/cm2 , RT
0.5 2E16 Zr+/cm2 & 4E16 O+/cm2 , RT
0.4
7.5E15 Zr+/cm2 , RT
0.3
0.2
0.1
0
3 4 5 6 7
Energy [eV]
Optical absorption spectra with the absorption from a virgin crystal subtracted](https://image.slidesharecdn.com/icdimpresentation-120703104220-phpapp01/85/ICDIM-2012-presentation-15-320.jpg)
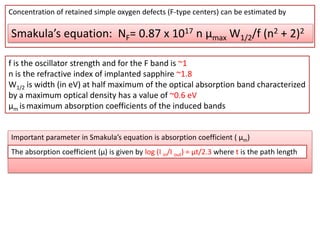
![Calculated oxygen vacancy profiles produced by Zr and O irradiation in sapphire
1.2
7.5E15 Zr
1 1.1E16 O
Number/(Angstrom-Ion)
0.8
O Vacancies after Zr
0.6
O Vacancies after O
0.4
0.2
0
0 500 1000 1500 2000 2500
Depth [A]
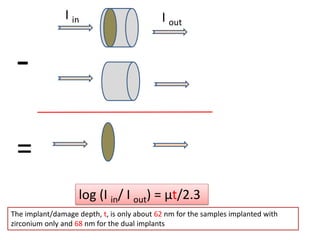
The implant/damage depth, t, is only about 62 nm for the samples implanted with
zirconium only and 68 nm for the dual implants
Number of O vacancies/Cm3 = [Number/Å × Ions].[Ions]. [Å/Cm3]](https://image.slidesharecdn.com/icdimpresentation-120703104220-phpapp01/85/ICDIM-2012-presentation-18-320.jpg)

This study investigated the implantation of sapphire by zirconium and zirconium plus oxygen ions. Important factors that influence amorphization during ion implantation include temperature, ion mass, energy, and fluence. Rutherford backscattering spectrometry was used to determine the threshold fluence for amorphization in sapphire by zirconium implantation and examine the effect of additional oxygen implantation. Optical absorption and photoluminescence measurements provided information about induced color centers and defects from the ion irradiation.