

Recommended
More Related Content
Similar to IBM FlashSystem 840 eng
Similar to IBM FlashSystem 840 eng (20)
More from Oleg Korol
More from Oleg Korol (15)
Recently uploaded
Recently uploaded (20)
IBM FlashSystem 840 eng
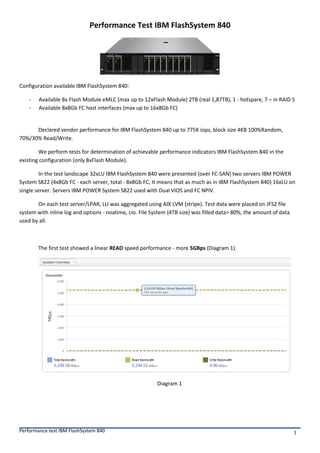
- 1. Performance test IBM FlashSystem 840 1 Performance Test IBM FlashSystem 840 Configuration available IBM FlashSystem 840: - Available 8х Flash Module eMLC (max up to 12хFlash Module) 2TB (real 1,87TB), 1 - hotspare, 7 – in RAID 5 - Available 8x8Gb FC host interfaces (max up to 16x8Gb FC) Declared vendor performance for IBM FlashSystem 840 up to 775K iops, block size 4KB 100%Random, 70%/30% Read/Write. We perform tests for determination of achievable performance indicators IBM FlashSystem 840 in the existing configuration (only 8хFlash Module). In the test landscape 32хLU IBM FlashSystem 840 were presented (over FC-SAN) two servers IBM POWER System S822 (4х8Gb FC - each server, total - 8x8Gb FC, It means that as much as in IBM FlashSystem 840) 16хLU on single server. Servers IBM POWER System S822 used with Dual VIOS and FC NPIV. On each test server/LPAR, LU was aggregated using AIX LVM (stripe). Test data were placed on JFS2 file system with inline log and options - noatime, cio. File System (4TB size) was filled data> 80%, the amount of data used by all. The first test showed a linear READ speed performance - more 5GBps (Diagram 1). Diagram 1
- 2. Performance test IBM FlashSystem 840 2 The next test WRITE speed performance showed almost 2GBps (Diagram 2). Diagram 2 The multi-thread test - 100% Random, Read/Write=80/20, block size 4KB – performance over 500K iops (Diagram 3). Diagram 3
- 3. Performance test IBM FlashSystem 840 3 Repeat test with multi-thread workload - 100% Random, Read/Write=80/20, changing the size of the data block (Diagram 4 – performance in iops, Diagram 5 – the response time of the disk subsystem in ms). 4KB 8KB 16KB 32KB 64KB 128KB IBM FlashSystem 840 507724 325057 174311 90340 45839 23059 0 100000 200000 300000 400000 500000 600000 IOPS Diagram 4 - IBM FlashSystem 840 100% Random, Read/Write= 80/20 0 5 10 15 20 25 4KB 8KB 16KB 32KB 64KB 128KB ms 4KB 8KB 16KB 32KB 64KB 128KB IBM FlashSystem 840, write ms 0.6 1.1 2.9 7.6 16.2 31 IBM FlashSystem 840, read ms 1.2 2.4 4.8 9.6 18.8 34.5 Diagram 5 - IBM FlashSystem 840 average latency
- 4. Performance test IBM FlashSystem 840 4 And for the next test will leave the fixed data block size - 8KB, and will change the ratio Read/Write. As shown in Diagram 6 - maximum performance was achieved at a ratio other than 100% Read. 100% Write 10% Read 90% Write 20% Read 80% Write 30% Read 70% Write 40% Read 60% Write 50% Read 50% Write 60% Read 40% Write 70% Read 30% Write 80% Read 20% Write 90% Read 10% Write 100% Read IBM FlashSystem 840 187480 199834 213311 226443 241190 257174 274482 296792 325265 385369 378269 0 50000 100000 150000 200000 250000 300000 350000 400000 450000 IOPS Diagram 6 - IBM FlashSystem 840 100% Random, Read/Write= 0/100-100/0
- 5. Performance test IBM FlashSystem 840 5 Next, consider some aspect - how to change the performance of IBM FlashSystem 840 when updating firmware? Vendors always recommend updating firmware in the minimal load window, but never specify that under this understanding ... 1K iops, 10K iops, 100K iops? Generate a load of about ~ 100K iops - 100% Random, Read/Write = 80/20, the block size 8KB, and simultaneously start firmware update for IBM FlashSystem 840. As shown in Diagram 7 and 8, slow performance very short (directly while upgrading controllers - more detailed this situation is shown in Diagram 9) and a slight increase in response time is during the verification RAID stripes. Diagram 7 Diagram 8 0 20000 40000 60000 80000 100000 120000 140000 16:10 16:16 16:21 16:27 16:32 16:38 16:43 16:49 16:54 17:00 17:05 17:11 17:16 17:22 17:27 17:33 17:38 17:44 17:49 17:55 18:00 18:06 18:11 18:17 18:22 18:28 18:33 18:39 18:44 18:50 18:55 19:01 19:06 Disk xfers IO/sec 0.0 0.1 0.2 0.3 0.4 0.5 0.6 0.7 0.8 0.9 16:10 16:16 16:21 16:27 16:32 16:38 16:43 16:49 16:54 17:00 17:05 17:11 17:16 17:22 17:27 17:33 17:38 17:44 17:49 17:55 18:00 18:06 18:11 18:17 18:22 18:28 18:33 18:39 18:44 18:50 18:55 19:01 19:06 Disk Service Time msec/xfer
- 6. Performance test IBM FlashSystem 840 6 Diagram 9
- 7. Performance test IBM FlashSystem 840 7 Thank you for your attention! Oleg Korol November 2014 http://ua.linkedin.com/pub/oleg-korol/26/920/716/