The study used very low frequency (VLF) electromagnetic profiling to map subsurface fracture systems within Bowen University's permanent site in Nigeria. Six profiling lines were established and readings were taken at 20m intervals. The results revealed alternating positive and negative peaks, indicating fractured and competent zones. A conductivity contour map showed the southwestern, northwestern, central and northeastern parts have lower conductivity and are suitable for engineering structures, while the highly conductive northeastern zones are best for groundwater development. The study provides information on the subsurface geology that can aid in planning construction projects and locating productive boreholes at the university site.
![Mapping Of Subsurface Fracture Systems Within…
www.theijes.com The IJES Page 57
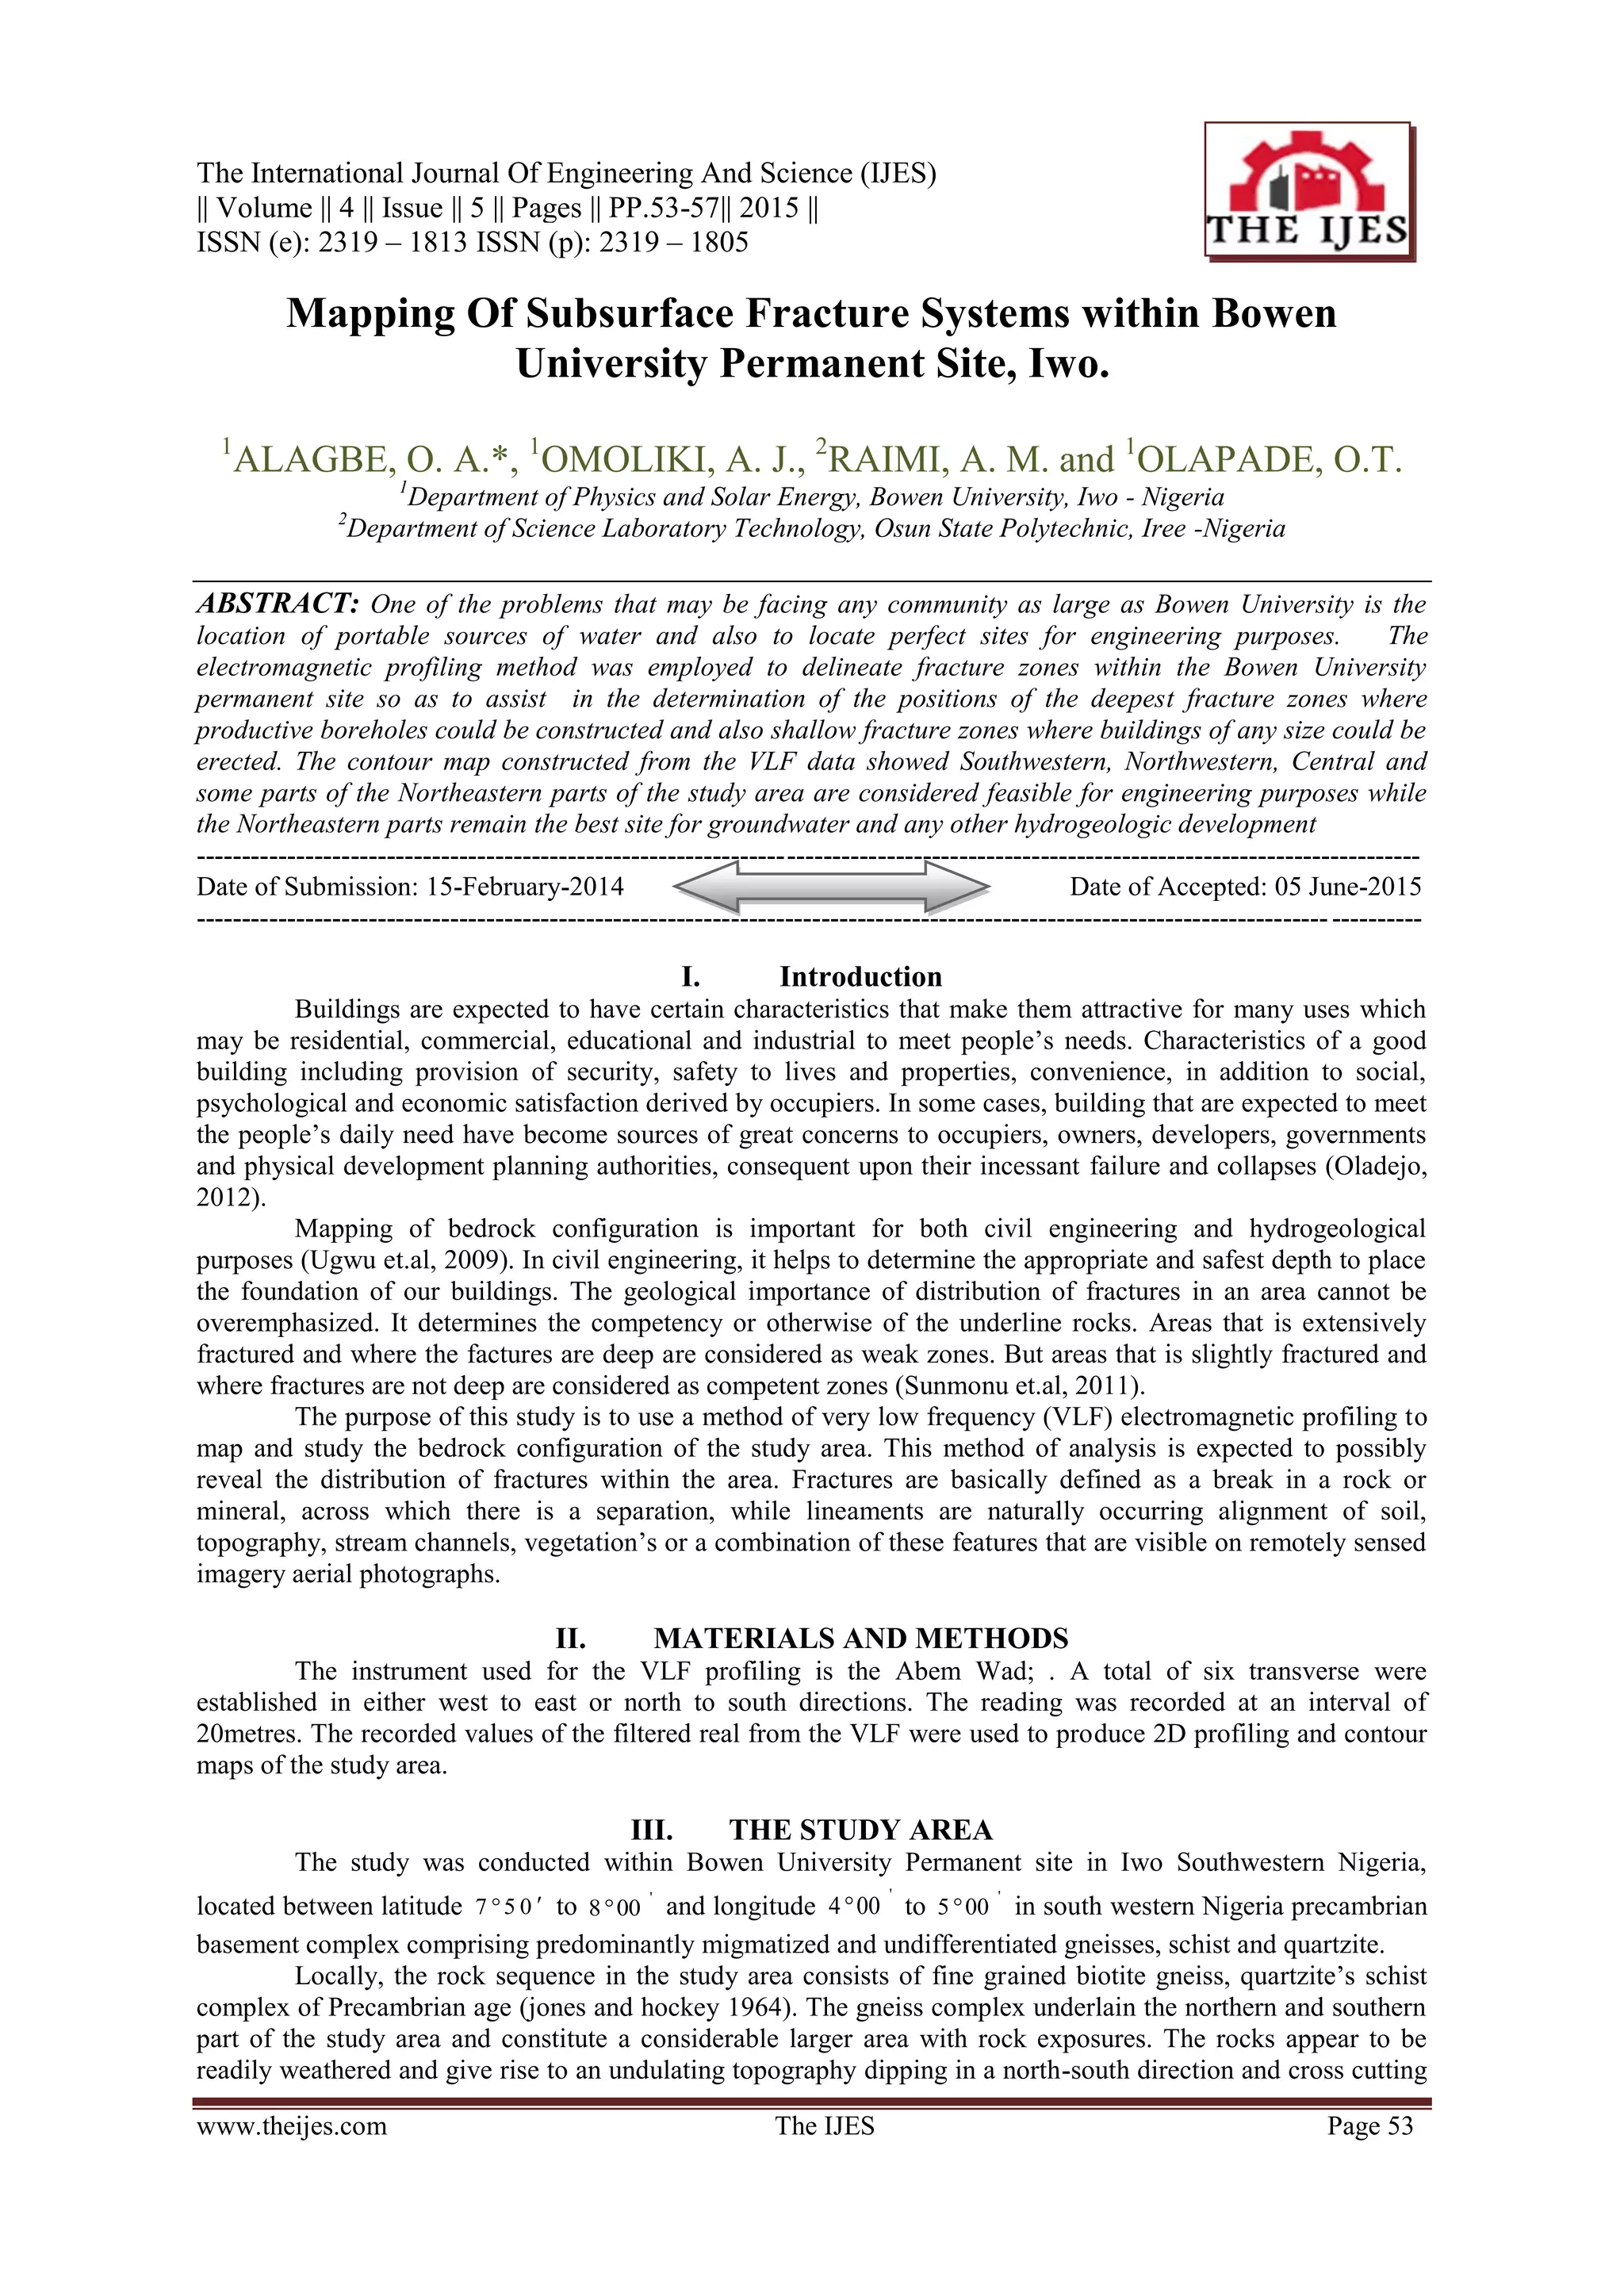
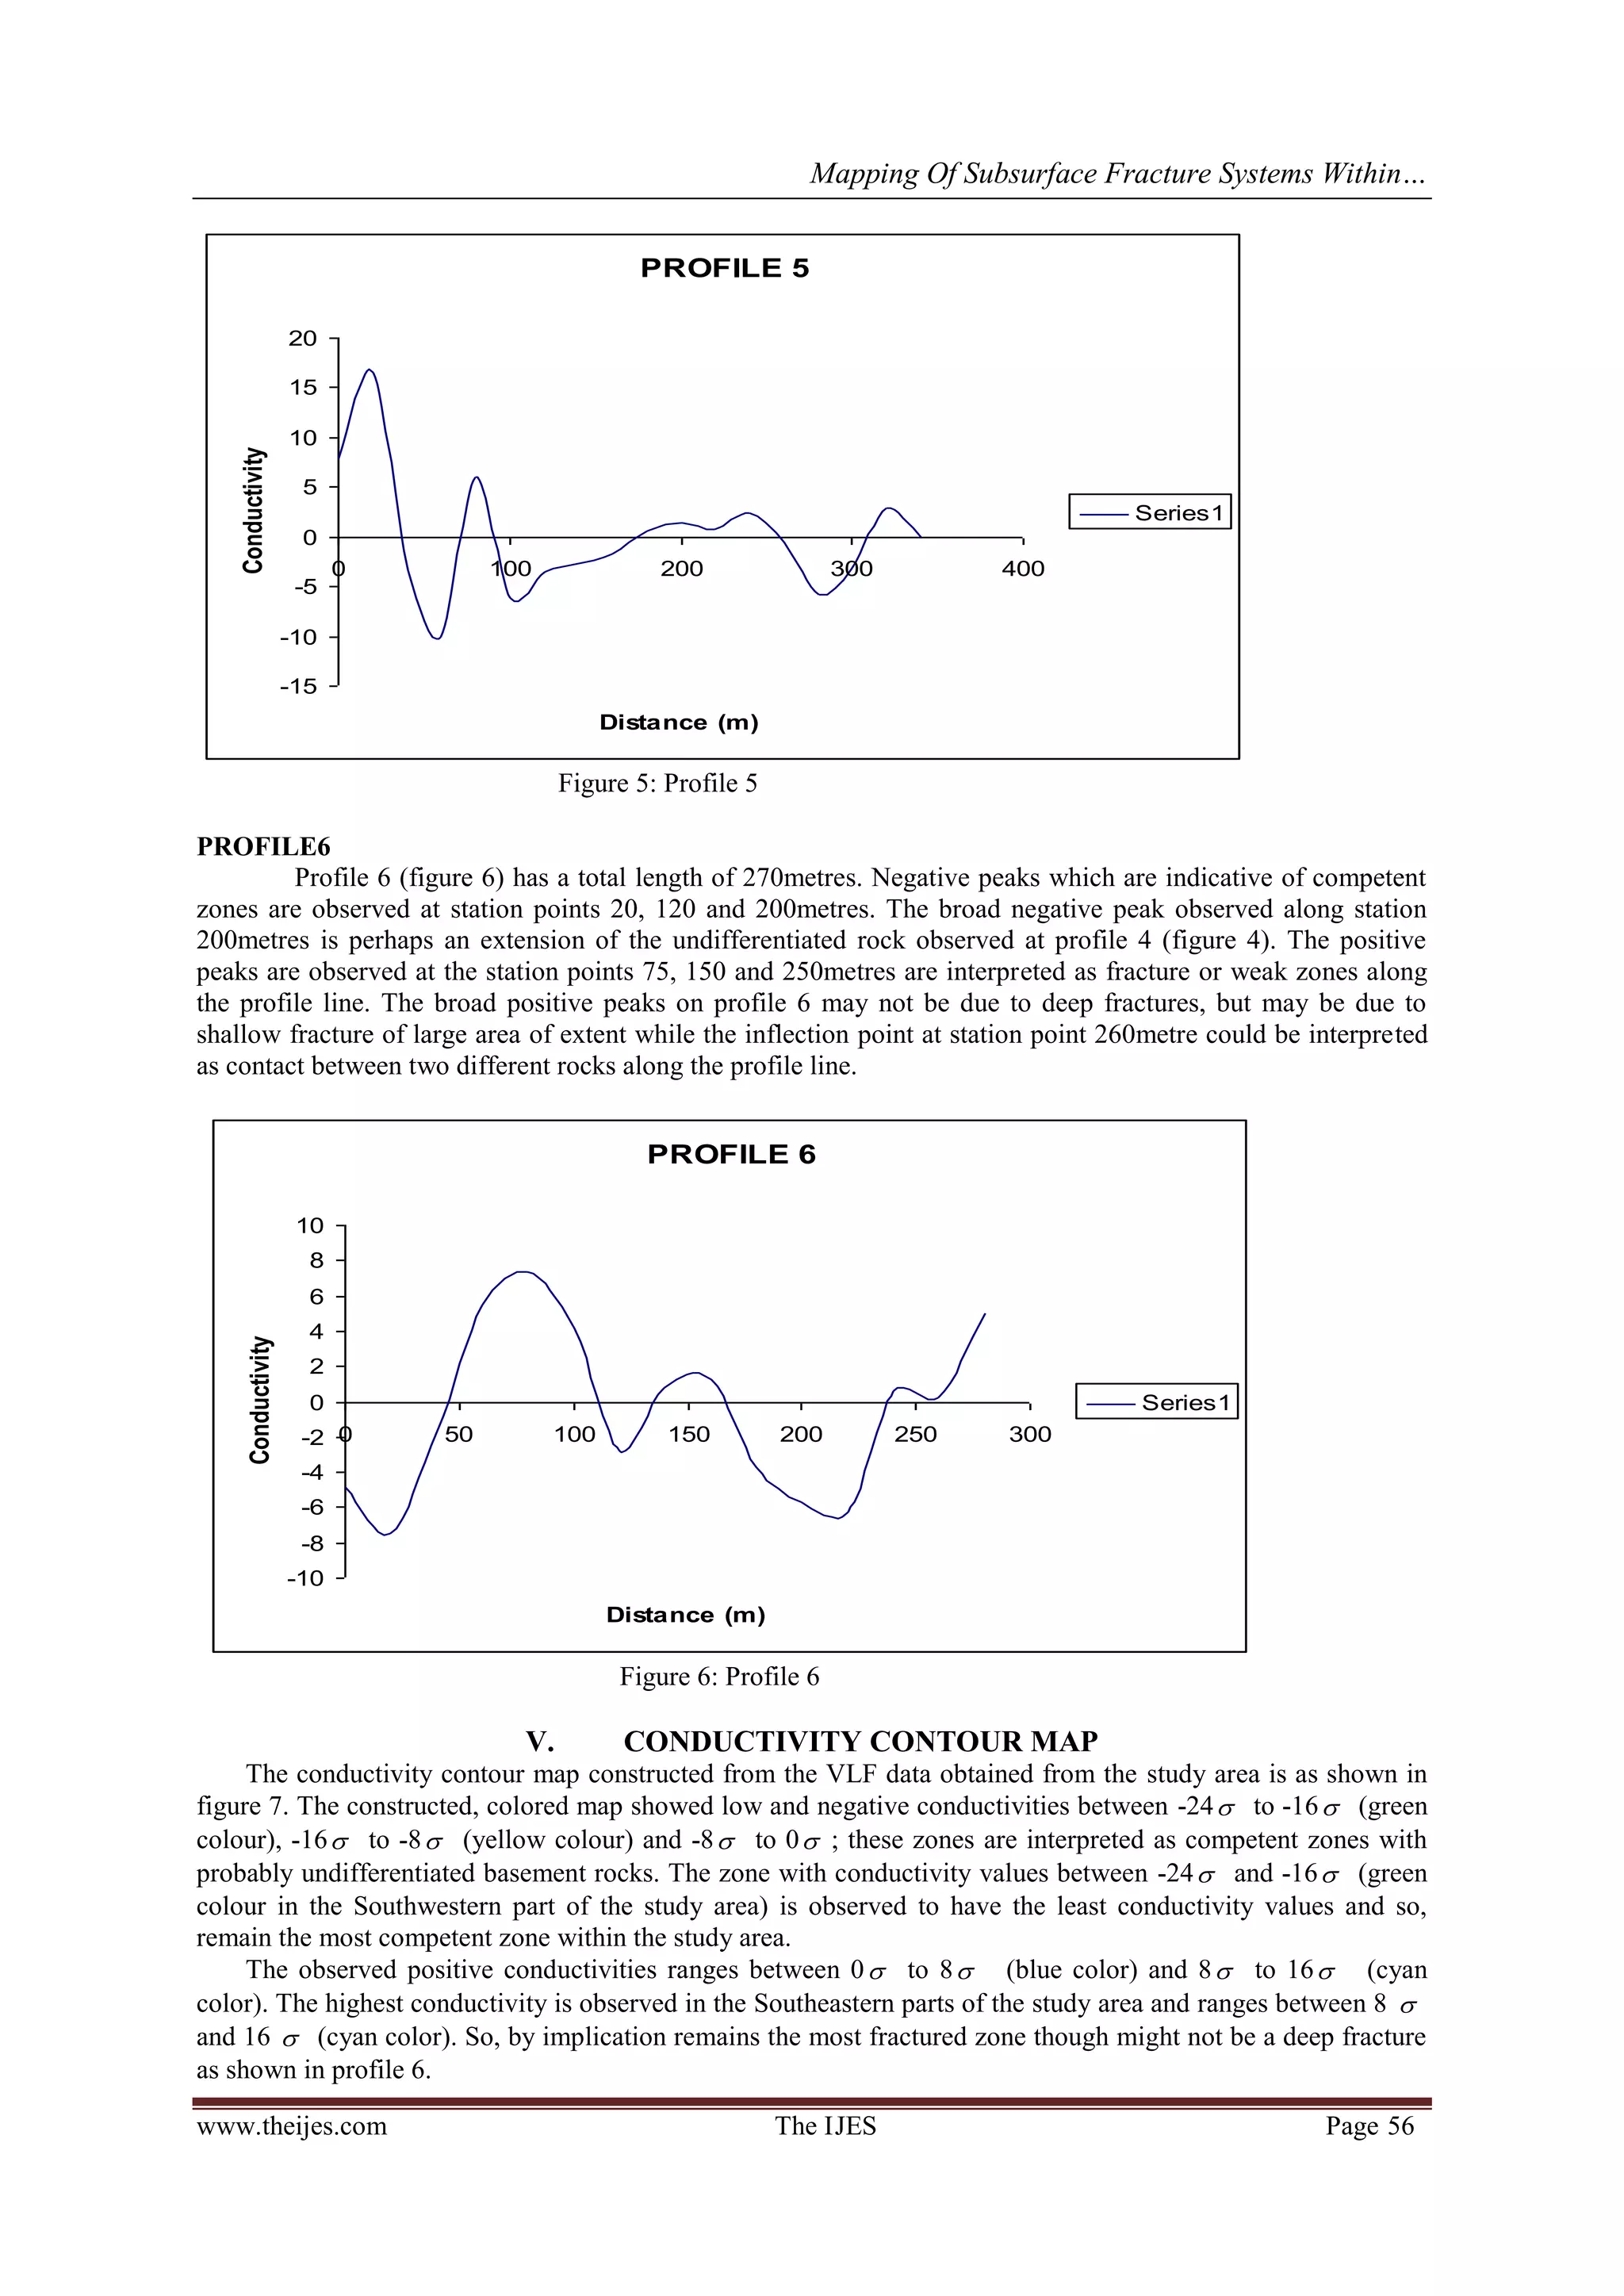
Since low or negative conductivities values are associated with shallow fractures which are interpreted as
competent zones, the South Western point of the study area remain the only feasible zone for the errection of
heavy structures. This justified the siting of the university worship center (chapel), new female hostel and the
new university library in the Southwestern part of the university permanent site. Other areas that are still good
for engineering works includes the Northwestern, central, and some parts of Northeastern parts of the study area.
Other zones or parts with high conductivity values and positive peaks especially in Northeastern parts of the
study area are better sites for hydrogeological purposes.
Figure 7: Conductivity contour map of the study area
VI. CONCLUSION
The VLF method of analysis of the data from Bowen University permanent site was carried out. The
study revealed a network of geologic features which are the reflections of the basement pattern within study
area. The south western, Northwestern, central and some parts of Northeastern parts of the study area are
considered feasible for any engineering purposes while the Northeastern parts remain the best site for ground
water development.
REFERENCES
[1]. Akinloye, M. K.; Fadipe, D. O.; Adabanija, M.A. (2002). A Radiometric Mapping of the Ladoke Akintola University
Campus, Ogbomoso Southwestern Nigeria. Science Focus 1; 55-61
[2]. Jones, H A ; Hockey R D.(1964). The Geology of Southwestern Nigeria. Geol. Surv. of Nig. Bull ; 31 (101).
[3]. Oladejo, O.P. (2012): The Site Characterization of Oyo State Housing Estate, Ogbomoso North
[4]. Local Government Using Integrated Techniques.: An unpublished M.Tech. thesis,
[5]. Department of Pure and Applied Physics, Ladoke Akintola University of Technology Ogbomoso Nigeria.
[6]. Sunmonu, L. A.; Alagbe, O. A. (2011) : Groundmagnetic Study to Locate Burried Faults (A Case study of Abandoned Local
Government Secretariat in Ogbomoso). International Journal of Physics 3 (1) 70-75
[7]. Ugwu, S. A.; Eze, C. L. (2009). Mapping Bedrock Topography Using Electromagnetic Profiling. Journal Of Applied Sciences
and Environmental Management 13 (4), 43-46.
0 1 2 3 4
-24
-22
-20
-18
-16
-14
-12
-10
-8
-6
-4
-2
0
2
4
6
8
10
12
14
16
18
Longitude in degree
Latitudeindegree
8 00
7 50
4 00 5 00
0
0
0 0
'
'
'
'](https://image.slidesharecdn.com/i0453053057-150624041544-lva1-app6892/75/Mapping-Of-Subsurface-Fracture-Systems-within-Bowen-University-Permanent-Site-Iwo-5-2048.jpg)