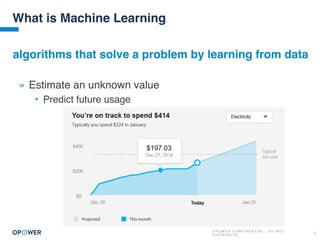
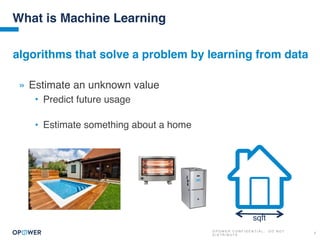
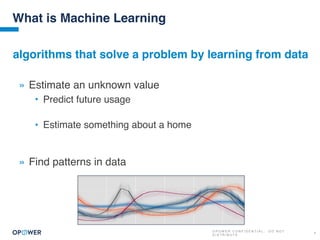
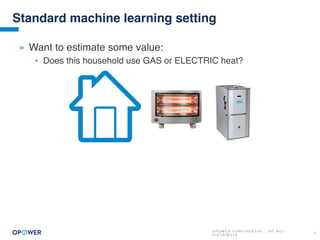
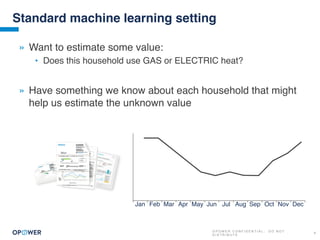
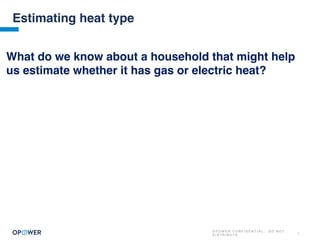
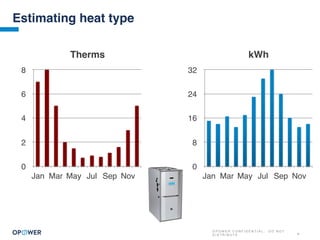
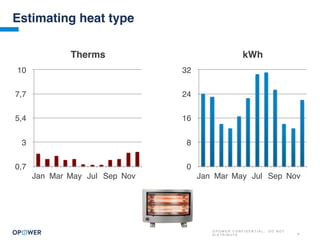
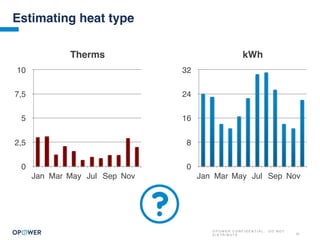
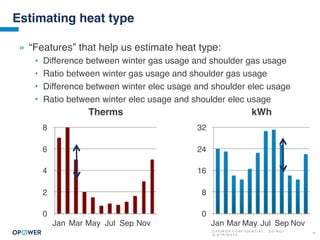
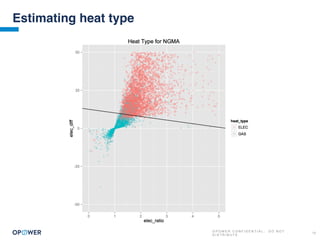
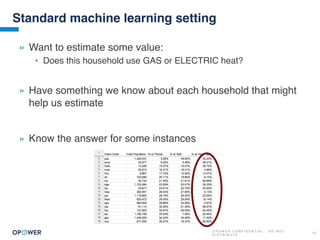
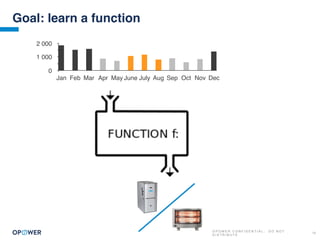
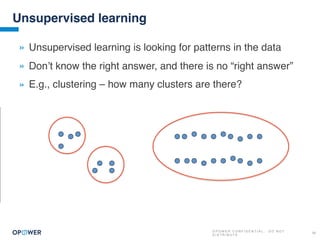
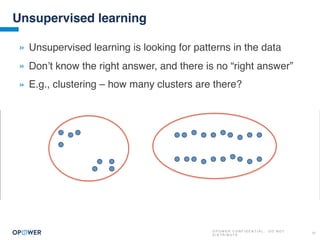
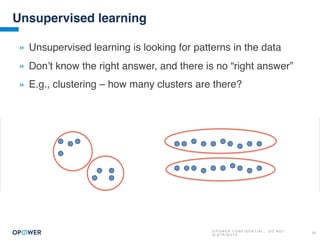
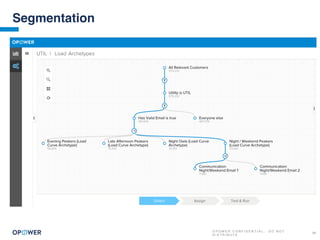
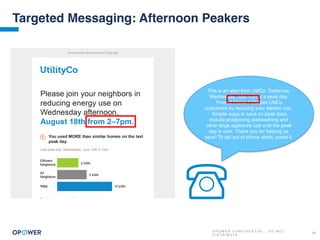
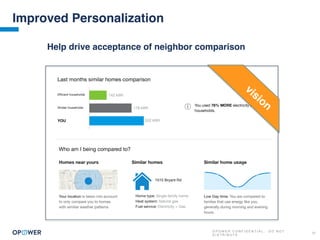
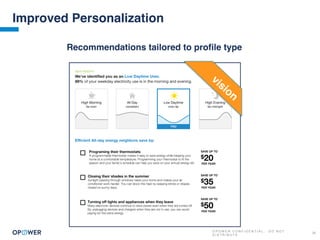
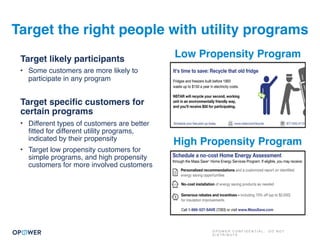
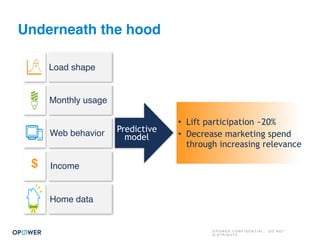
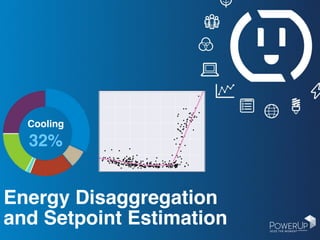
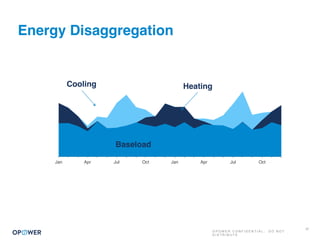
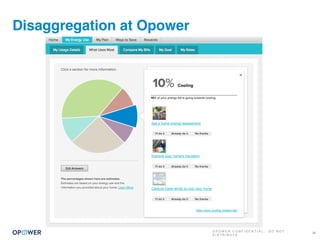
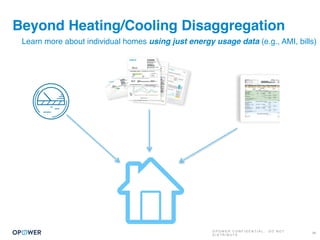
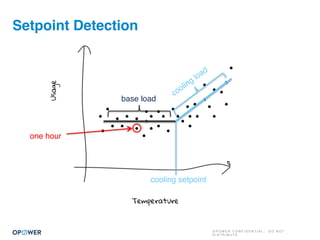
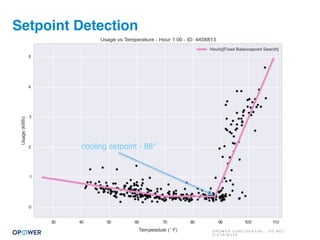
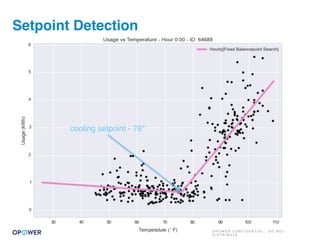
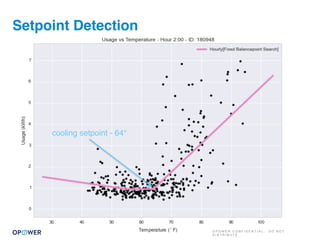
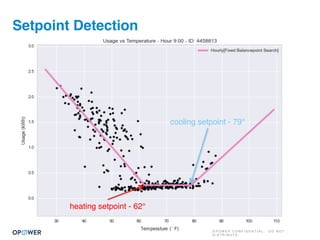
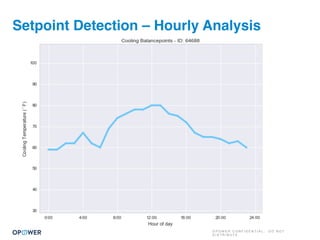
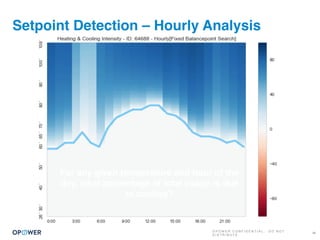
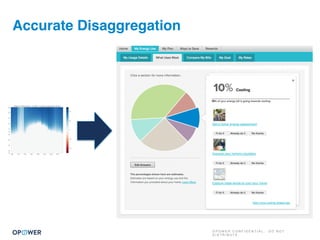
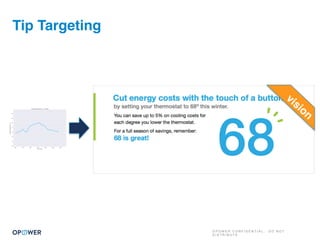
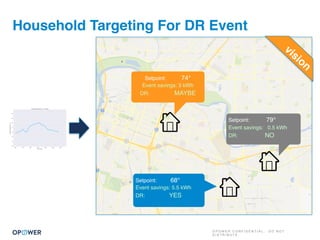
The document discusses machine learning and how it can be applied by a utility company. It explains how machine learning involves using algorithms to find patterns in data to help estimate unknown values or predict future usage. Specific applications discussed include estimating a home's heating type from usage data, creating customer segmentation profiles based on load curve patterns, and using disaggregated load data to estimate customer setpoints for heating and cooling. The goal is to apply these techniques to improve customer personalization, targeting, and participation in utility programs.
ИТМО Machine Learning. Рекомендательные системы — часть 2Andrey Danilchenko
Лекция-введение в рекомендательные системы в рамках курса по машинному обучению для студентов четвертого курса на кафедре КТ ИТМО. Часть 2 — explanations, RBM, evaluation metrics, BPR
ИТМО Machine Learning. Рекомендательные системы — часть 1Andrey Danilchenko
Лекция-введение в рекомендательные системы в рамках курса по машинному обучению для студентов четвертого курса на кафедре КТ ИТМО. Часть 1 — kNN, SVD, iALS.
Artificial Intelligence – Case-based reasoning for recommender systems – Invi...Thomas Roth-Berghofer
Artificial Intelligence is mimicking cognitive abilities. Experience guides us in our learning efforts and is one of the most important assets for problem solving. Experience is everywhere. For example, a recording technician needs experience in the studio to produce a recording worth listening to. Does the recording sound full and rich or still too tinny? Does the bass section sound overwhelming? Experience — my own or someone else’s — can help me solve a current problem, for example, in the recording studio. Case-based reasoning, a methodology in which experience is expressed in the form cases, allows transferring and applying expert knowledge where needed.
Mirko Lorenz Data Driven Journalism Overview Seminar Ordine dei Giornalisti d...Massimiliano Crosato
A seminar by Mirko Lorenz @MIRKOLORENZ (EJC European Journalism Center) on Data Driven Journalism topics at Ordine dei Giornalisti del Veneto, Venezia. 14 April 2015 #DDJ
Expert workshop on the creation and uses of combined environmental and economic performance datasets at the micro-level - 10-11 July 2018 - OECD, Paris
Statistical Programming with JavaScriptDavid Simons
Almost every application needs data to function - and if you don't know how to be nice to your data, then things will start to go wrong. This talk aims to convince JavaScript developers that they do need to care about statistics, and then talk about how to do so. We look at some theory and lots of case studies and real-world advice to deal with a range of scenarios.
The talk aims to touch on the entire data life cycle: We'll dive into data modelling and how the shape and size of your data affects your architecture, and how to build these architectures using JavaScript. Once the data is in the front-end, we'll touch on the wide range of libraries that allows your code to react based on the data, and the wrappers on top that aid visualisation and readability.
Improvement of strip thickness control through the process of data analyticsSri Raghavan
o The aim of this research study is to perform data mining for the improvement of strip thickness control on a cold reduction mill using data analytics. This project is done for Cogent Power (a subsidiary company of Tata Steel) located at Newport, UK. Further to this, a software was developed in python to perform data mining to avoid developing codes for future purposes
Machine Learning Project for Georgetown University's Data Science Certificate Program. Our team collected sensor data from the classroom using Raspberry Pi 3 sensors and other devices, and then built supervised classification and regression models to predict the room's occupancy.
Wiring the IoT for modern manufacturingFlorent Solt
The IoT has the potential to create a renaissance of manufacturing in the US and elsewhere. The expected exponential increase in the amount of data that will be processed, transported, stored, and accessed means there will be a huge demand for smart technologies to deliver it.
Managing codebases and projects takes time, and time usually means money (especially with development resources). Using some of the methods discussed, we can help make ourselves and our teams more productive as we move from project to project, which saves time, money, and costly research time. We'll cover code complexity, reusability, and the dreaded 'refactoring' question.
4Developers 2015: Measure to fail - Tomasz KowalczewskiPROIDEA
YouTube: https://www.youtube.com/watch?v=H5F0D55nKX4&index=11&list=PLnKL6-WWWE_WNYmP_P5x2SfzJ7jeJNzfp
Tomasz Kowalczewski
Language: English
Hardware fails, applications fail, our code... well, it fails too (at least mine). To prevent software failure we test. Hardware failures are inevitable, so we write code that tolerates them, then we test. From tests we gather metrics and act upon them by improving parts that perform inadequately. Measuring right things at right places in an application is as much about good engineering practices and maintaining SLAs as it is about end user experience and may differentiate successful product from a failure.
In order to act on performance metrics such as max latency and consistent response times we need to know their accurate value. The problem with such metrics is that when using popular tools we get results that are not only inaccurate but also too optimistic.
During my presentation I will simulate services that require monitoring and show how gathered metrics differ from real numbers. All this while using what currently seems to be most popular metric pipeline - Graphite together with com.codahale metrics library - and get completely false results. We will learn to tune it and get much better accuracy. We will use JMeter to measure latency and observe how falsely reassuring the results are. We will check how graphite averages data just to helplessly watch important latency spikes disappear. Finally I will show how HdrHistogram helps in gathering reliable metrics. We will also run tests measuring performance of different metric classes
Hardware fails, applications fail, our code... well, it fails too (at least mine). To prevent software failure we test. Hardware failures are inevitable, so we write code that tolerates them, then we test. From tests we gather metrics and act upon them by improving parts that perform inadequately. Measuring right things at right places in an application is as much about good engineering practices and maintaining SLAs as it is about end user experience and may differentiate successful product from a failure.
In order to act on performance metrics such as max latency and consistent response times we need to know their accurate value. The problem with such metrics is that when using popular tools we get results that are not only inaccurate but also too optimistic.
During my presentation I will simulate services that require monitoring and show how gathered metrics differ from real numbers. All this while using what currently seems to be most popular metric pipeline - Graphite together with metrics.dropwizard.io library - and get completely false results. We will learn to tune it and get much better accuracy. We will use JMeter to measure latency and observe how falsely reassuring the results are. Finally I will show how HdrHistogram helps in gathering reliable metrics. We will also run tests measuring performance of different metric classes.
Switching horses midstream - From Waterfall to AgileDoc Norton
You’ve been working for several months on a key software initiative for the company and leadership has decided they want it faster than projected, so the team has been told they’re getting “the agile” installed next week.
“Great.”, you think, “Right in the middle of the project. Nothing like changing horses in midstream. One way or another, this will go swimmingly.”
Sarcasm and puns aside, you’ve got a point. It isn’t easy to switch methodologies in the middle of a project. Doc shares some stories from his own experiences helping teams make this change and provides a few pointers that can help you do the same.
While this talk is focused on testing, it involves the whole team, as agile methods usually do.
Canary Deployments on Amazon EKS with Istio - SRV305 - Chicago AWS SummitAmazon Web Services
Within complex systems, even well-written code can behave in unexpected ways and lead to outages and critical issues. Amazon Elastic Container Service for Kubernetes (Amazon EKS) enables you to easily run Kubernetes, quickly deploy new code, and revert to safe, stable releases when issues are identified. But the damage done in the short period between deployment and rollback can be significant. In this session, we show you how to limit the effect of unforeseen issues using canary deployments with Istio and how to better monitor your applications in Amazon EKS and spot potential problems before they affect your customer base. This session is brought to you by AWS partner, Datadog.
Agree to Disagree: Improving Disagreement Detection with Dual GRUs. Presentation of our work on disagreement detection at ESSEM 2017. In this work, we show that by using a Siamese inspired architecture to encode the discussions, we no longer need to rely on hand-crafted features to exploit the meta thread structure. The research paper can be found at https://arxiv.org/abs/1708.05582
Similar to Hub AI&BigData meetup / Вадим Кузьменко: Как машинное обучение помогает снизить энергопотребление (20)
Hub IT School: Лекция "IT профессии" / 14.1.16
На этой лекции Людмила Денисенко из рекрутингового агентства GUID рассказала о существующих IT профессиях, их положении на рынке труда и требованиях, которые предъявляют к новичкам.
Hub AI&BigData meetup / Дмитрий Сподарец: Введение в машинное обучениеHub-IT-School
Hub IT School 26/12/15
Подпишитесь на нас в соц. сетях, чтобы не пропустить новые мероприятия!
https://www.facebook.com/Hub.IT.School/
https://vk.com/hub.itschool
Hub IT School 15.12 / Олег Саламаха: "Как пройти долину смерти"Hub-IT-School
Hub Startup meetup #2 / 15.12
Олег Саламаха (CEO Prodvigator/Serpstat): Как пройти долину смерти и не прострелить себе ногу.
Мы в соц. сетях:
https://vk.com/hub.itschool
https://www.facebook.com/Hub.IT.School
Эд Изотов: "In God we trust the REST we test".Hub-IT-School
Выступление Эда Изотова про тестирование REST-систем на Hub QA meetup #1.
Больше мероприятий:
https://vk.com/hub.itschool
https://facebook.com/Hub.IT.School
Андрей Сильчук: "Автоматическое тестирование".Hub-IT-School
Выступление Андрея Сильчука об автоматическом тестировании ПО на Hub QA meetup #1.
Больше мероприятий:
https://vk.com/hub.itschool
https://facebook.com/Hub.IT.School
Chatty Kathy - UNC Bootcamp Final Project Presentation - Final Version - 5.23...John Andrews
SlideShare Description for "Chatty Kathy - UNC Bootcamp Final Project Presentation"
Title: Chatty Kathy: Enhancing Physical Activity Among Older Adults
Description:
Discover how Chatty Kathy, an innovative project developed at the UNC Bootcamp, aims to tackle the challenge of low physical activity among older adults. Our AI-driven solution uses peer interaction to boost and sustain exercise levels, significantly improving health outcomes. This presentation covers our problem statement, the rationale behind Chatty Kathy, synthetic data and persona creation, model performance metrics, a visual demonstration of the project, and potential future developments. Join us for an insightful Q&A session to explore the potential of this groundbreaking project.
Project Team: Jay Requarth, Jana Avery, John Andrews, Dr. Dick Davis II, Nee Buntoum, Nam Yeongjin & Mat Nicholas
Levelwise PageRank with Loop-Based Dead End Handling Strategy : SHORT REPORT ...Subhajit Sahu
Abstract — Levelwise PageRank is an alternative method of PageRank computation which decomposes the input graph into a directed acyclic block-graph of strongly connected components, and processes them in topological order, one level at a time. This enables calculation for ranks in a distributed fashion without per-iteration communication, unlike the standard method where all vertices are processed in each iteration. It however comes with a precondition of the absence of dead ends in the input graph. Here, the native non-distributed performance of Levelwise PageRank was compared against Monolithic PageRank on a CPU as well as a GPU. To ensure a fair comparison, Monolithic PageRank was also performed on a graph where vertices were split by components. Results indicate that Levelwise PageRank is about as fast as Monolithic PageRank on the CPU, but quite a bit slower on the GPU. Slowdown on the GPU is likely caused by a large submission of small workloads, and expected to be non-issue when the computation is performed on massive graphs.
As Europe's leading economic powerhouse and the fourth-largest hashtag#economy globally, Germany stands at the forefront of innovation and industrial might. Renowned for its precision engineering and high-tech sectors, Germany's economic structure is heavily supported by a robust service industry, accounting for approximately 68% of its GDP. This economic clout and strategic geopolitical stance position Germany as a focal point in the global cyber threat landscape.
In the face of escalating global tensions, particularly those emanating from geopolitical disputes with nations like hashtag#Russia and hashtag#China, hashtag#Germany has witnessed a significant uptick in targeted cyber operations. Our analysis indicates a marked increase in hashtag#cyberattack sophistication aimed at critical infrastructure and key industrial sectors. These attacks range from ransomware campaigns to hashtag#AdvancedPersistentThreats (hashtag#APTs), threatening national security and business integrity.
🔑 Key findings include:
🔍 Increased frequency and complexity of cyber threats.
🔍 Escalation of state-sponsored and criminally motivated cyber operations.
🔍 Active dark web exchanges of malicious tools and tactics.
Our comprehensive report delves into these challenges, using a blend of open-source and proprietary data collection techniques. By monitoring activity on critical networks and analyzing attack patterns, our team provides a detailed overview of the threats facing German entities.
This report aims to equip stakeholders across public and private sectors with the knowledge to enhance their defensive strategies, reduce exposure to cyber risks, and reinforce Germany's resilience against cyber threats.
Hub AI&BigData meetup / Вадим Кузьменко: Как машинное обучение помогает снизить энергопотребление
1. O P O W E R C O N F I D E N T I A L : D O N O T
D I S T R I B U T E
What can Machine
Learning do for
you?
2. O P O W E R C O N F I D E N T I A L : D O N O T
D I S T R I B U T E
2
What is Machine Learning
» Estimate an unknown value
• Predict future usage
algorithms that solve a problem by learning from data
3. O P O W E R C O N F I D E N T I A L : D O N O T
D I S T R I B U T E
3
What is Machine Learning
» Estimate an unknown value
• Predict future usage
• Estimate something about a home
algorithms that solve a problem by learning from data
sqft
4. O P O W E R C O N F I D E N T I A L : D O N O T
D I S T R I B U T E
4
What is Machine Learning
» Estimate an unknown value
• Predict future usage
• Estimate something about a home
» Find patterns in data
algorithms that solve a problem by learning from data
5. O P O W E R C O N F I D E N T I A L : D O N O T
D I S T R I B U T E
5
Standard machine learning setting
» Want to estimate some value:
• Does this household use GAS or ELECTRIC heat?
6. O P O W E R C O N F I D E N T I A L : D O N O T
D I S T R I B U T E
6
Standard machine learning setting
» Want to estimate some value:
• Does this household use GAS or ELECTRIC heat?
» Have something we know about each household that might
help us estimate the unknown value
Jan Feb Mar Apr May Jun Jul Aug Sep Oct Nov Dec
7. O P O W E R C O N F I D E N T I A L : D O N O T
D I S T R I B U T E 7
Estimating heat type
What do we know about a household that might help
us estimate whether it has gas or electric heat?
8. O P O W E R C O N F I D E N T I A L : D O N O T
D I S T R I B U T E 8
Estimating heat type
kWh
0
8
16
24
32
Jan Mar May Jul Sep Nov
Therms
0
2
4
6
8
Jan Mar May Jul Sep Nov
9. O P O W E R C O N F I D E N T I A L : D O N O T
D I S T R I B U T E 9
Estimating heat type
kWh
0
8
16
24
32
Jan Mar May Jul Sep Nov
Therms
0,7
3
5,4
7,7
10
Jan Mar May Jul Sep Nov
10. O P O W E R C O N F I D E N T I A L : D O N O T
D I S T R I B U T E 10
Estimating heat type
Therms
0
2,5
5
7,5
10
Jan Mar May Jul Sep Nov
kWh
0
8
16
24
32
Jan Mar May Jul Sep Nov
11. O P O W E R C O N F I D E N T I A L : D O N O T
D I S T R I B U T E
11
Estimating heat type
» “Features” that help us estimate heat type:
• Difference between winter gas usage and shoulder gas usage
• Ratio between winter gas usage and shoulder gas usage
• Difference between winter elec usage and shoulder elec usage
• Ratio between winter elec usage and shoulder elec usage
Therms
0
2
4
6
8
Jan Mar May Jul Sep Nov
kWh
0
8
16
24
32
Jan Mar May Jul Sep Nov
12. O P O W E R C O N F I D E N T I A L : D O N O T
D I S T R I B U T E
12
Estimating heat type
13. O P O W E R C O N F I D E N T I A L : D O N O T
D I S T R I B U T E
13
Standard machine learning setting
» Want to estimate some value:
• Does this household use GAS or ELECTRIC heat?
» Have something we know about each household that might
help us estimate
» Know the answer for some instances
14. O P O W E R C O N F I D E N T I A L : D O N O T
D I S T R I B U T E
14
Standard machine learning setting
» Want to estimate some value: target variable
» Have something we know about each household that might
help us estimate: features
» Know the answer for some instances: labeled training set
15. O P O W E R C O N F I D E N T I A L : D O N O T
D I S T R I B U T E
15
Goal: learn a function
0
1 000
2 000
Jan Feb Mar Apr May June July Aug Sep Oct Nov Dec
16. O P O W E R C O N F I D E N T I A L : D O N O T
D I S T R I B U T E
16
Standard machine learning pipeline
Training Set Evaluation Set Real Life
train the function evaluate how well
the function predicts
use the function on
new data to get our
answers
JanFebMarAprMayJuneJulyAugSepOctNovDec
coeff1: 1.38
coeff2: 0.25
coeff3: 3.59
coeff4: 2.84
Model accuracy: 86%
Baseline accuracy: 72%
17. O P O W E R C O N F I D E N T I A L : D O N O T
D I S T R I B U T E
17
Standard machine learning setting
» Want to estimate some value: target variable
• Can be category (ELEC/GAS) or number (e.g., kWh)
• Category – classification; number – regression
» Have something we know about each instance that might
help us estimate: features
» Know the answer for some instances: labeled training set
The function you use doesn’t really matter
The function we used earlier was logistic regression
Others include SVM, nearest neighbor, neural networks
18. O P O W E R C O N F I D E N T I A L : D O N O T
D I S T R I B U T E
18
Unsupervised learning
» Everything we just saw was called “supervised learning”
» What if we don’t have labeled data?
Unsupervised Learning
19. O P O W E R C O N F I D E N T I A L : D O N O T
D I S T R I B U T E
19
Unsupervised learning
» Unsupervised learning is looking for patterns in the data
» Don’t know the right answer, and there is no “right answer”
» E.g., clustering – how many clusters are there?
20. O P O W E R C O N F I D E N T I A L : D O N O T
D I S T R I B U T E
20
Unsupervised learning
» Unsupervised learning is looking for patterns in the data
» Don’t know the right answer, and there is no “right answer”
» E.g., clustering – how many clusters are there?
21. O P O W E R C O N F I D E N T I A L : D O N O T
D I S T R I B U T E
21
Unsupervised learning
» Unsupervised learning is looking for patterns in the data
» Don’t know the right answer, and there is no “right answer”
» E.g., clustering – how many clusters are there?
22. O P O W E R C O N F I D E N T I A L : D O N O T
D I S T R I B U T E
22
Unsupervised learning
» Unsupervised learning is looking for patterns in the data
» Don’t know the right answer, and there is no “right answer”
» E.g., clustering – how many clusters are there?
23. O P O W E R C O N F I D E N T I A L : D O N O T
D I S T R I B U T E
23
Data Science workflow
Research
• Data exploration
• Accuracy testing
• Prototyping
Initial Rollout
• Professional
Service
• Pilot
General Availability
• Productionalized as a service
• Available to all clients
Research
• Continued exploration
• Accuracy testing
24. O P O W E R C O N F I D E N T I A L : D O N O T
D I S T R I B U T E
Personalization Through
Load Curve Analysis
25. O P O W E R C O N F I D E N T I A L : D O N O T
D I S T R I B U T E
25
Load Curves – All Customers
26. O P O W E R C O N F I D E N T I A L : D O N O T
D I S T R I B U T E
26
Load Curves – All Customers
27. O P O W E R C O N F I D E N T I A L : D O N O T
D I S T R I B U T E
27
Load Curves – All Customers
28. O P O W E R C O N F I D E N T I A L : D O N O T
D I S T R I B U T E
28
Load Curve Archetypes
Steady Eddies
Daytimers
Night Owls
0.00 4.00 8.00 12.00 16.00 20.00 24.00
3%
Proportionofusage
ineachhour
4%
5%
6%
Hour of the day
0.00 4.00 8.00 12.00 16.00 20.00 24.00
3%
Proportionofusage
ineachhour
4%
5%
6%
Hour of the day
0.004.00 8.00 12.00 16.00 20.00 24.00
3%
Proportionofusage
ineachhour
4%
5%
6%
Hour of the day
Evening Peakers
0.00 4.00 8.00 12.00 16.00 20.00 24.00
3%
Proportionofusage
ineachhour
4%
5%
6%
Hour of the day
Twin Peaks
0.00 4.00 8.00 12.00 16.00 20.00 24.00
3%
Proportionofusage
ineachhour
4%
5%
6%
Hour of the day
29. O P O W E R C O N F I D E N T I A L : D O N O T
D I S T R I B U T E
29
Segmentation
30. O P O W E R C O N F I D E N T I A L : D O N O T
D I S T R I B U T E
30
Targeted Messaging: Afternoon Peakers
This is an alert from UtilCo: Tomorrow,
Wednesday, July 10th is a peak day.
From 2 PM to 7 PM join UtilCo
customers by reducing your electric use.
Simple ways to save on peak days
include postponing dishwashing and
other large appliance use until the peak
day is over. Thank you for helping us
save! To opt out of phone alerts, press 9.
31. O P O W E R C O N F I D E N T I A L : D O N O T
D I S T R I B U T E
31
Improved Personalization
Help drive acceptance of neighbor comparison
vision
32. O P O W E R C O N F I D E N T I A L : D O N O T
D I S T R I B U T E
32
Improved Personalization
Recommendations tailored to profile type
vision
33. O P O W E R C O N F I D E N T I A L : D O N O T
D I S T R I B U T E
Program Propensity
34. O P O W E R C O N F I D E N T I A L : D O N O T
D I S T R I B U T E
Target the right people with utility programs
Target likely participants
• Some customers are more likely to
participate in any program
Target specific customers for
certain programs
• Different types of customers are better
fitted for different utility programs,
indicated by their propensity
• Target low propensity customers for
simple programs, and high propensity
customers for more involved customers
High Propensity Program
Low Propensity Program
35. O P O W E R C O N F I D E N T I A L : D O N O T
D I S T R I B U T E
Underneath the hood
Load shape
$
Monthly usage
Web behavior
Income
Home data
Predictive
model
• Lift participation ~20%
• Decrease marketing spend
through increasing relevance
36. O P O W E R C O N F I D E N T I A L : D O N O T
D I S T R I B U T E
Energy Disaggregation
and Setpoint Estimation
Cooling
32%
37. O P O W E R C O N F I D E N T I A L : D O N O T
D I S T R I B U T E
37
Jan Apr Jul Oct Jan Apr Jul Oct
Baseload
HeatingCooling
Energy Disaggregation
38. O P O W E R C O N F I D E N T I A L : D O N O T
D I S T R I B U T E
Disaggregation at Opower
38
39. O P O W E R C O N F I D E N T I A L : D O N O T
D I S T R I B U T E
Beyond Heating/Cooling Disaggregation
39
Learn more about individual homes using just energy usage data (e.g., AMI, bills)
40. O P O W E R C O N F I D E N T I A L : D O N O T
D I S T R I B U T E
Setpoint Detection
base load
cooling load
cooling setpoint
one
household
one hour
41. O P O W E R C O N F I D E N T I A L : D O N O T
D I S T R I B U T E
Setpoint Detection
cooling setpoint - 88°
42. O P O W E R C O N F I D E N T I A L : D O N O T
D I S T R I B U T E
Setpoint Detection
cooling setpoint - 76°
43. O P O W E R C O N F I D E N T I A L : D O N O T
D I S T R I B U T E
Setpoint Detection
cooling setpoint - 64°
44. O P O W E R C O N F I D E N T I A L : D O N O T
D I S T R I B U T E
Setpoint Detection
cooling setpoint - 79°
heating setpoint - 62°
45. O P O W E R C O N F I D E N T I A L : D O N O T
D I S T R I B U T E
Setpoint Detection – Hourly Analysis
46. O P O W E R C O N F I D E N T I A L : D O N O T
D I S T R I B U T E
Setpoint Detection – Hourly Analysis
46
For any given temperature and hour of the
day, what percentage of total usage is due
to cooling?
47. O P O W E R C O N F I D E N T I A L : D O N O T
D I S T R I B U T E
Setpoint Detection – hourly analysis
47
48. O P O W E R C O N F I D E N T I A L : D O N O T
D I S T R I B U T E
Accurate Disaggregation
49. O P O W E R C O N F I D E N T I A L : D O N O T
D I S T R I B U T E
Tip Targeting
vision
50. O P O W E R C O N F I D E N T I A L : D O N O T
D I S T R I B U T E
Household Targeting For DR Event
Setpoint: 74°
Event savings: 3 kWh
DR: MAYBE
Setpoint: 79°
Event savings: 0.5 kWh
DR: NO
Setpoint: 68°
Event savings: 5.5 kWh
DR: YES
vision
vision
51. O P O W E R C O N F I D E N T I A L : D O N O T
D I S T R I B U T E
Bill Forecasting
vision
vision
52. O P O W E R C O N F I D E N T I A L : D O N O T
D I S T R I B U T E
52
Thanks!