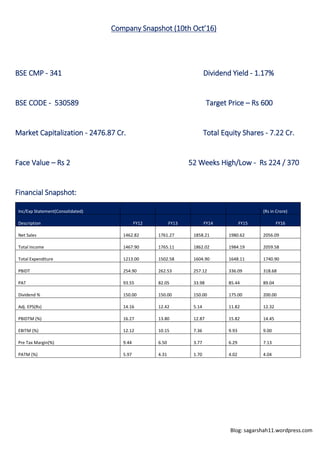
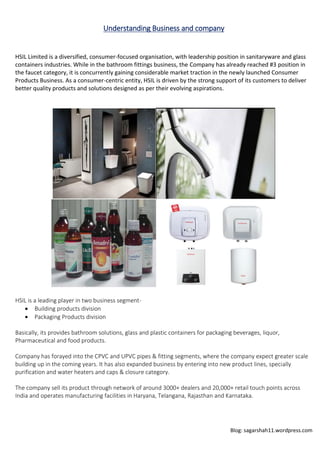
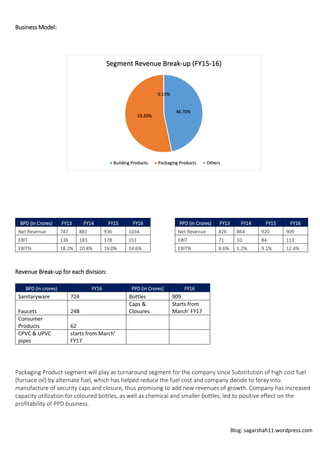
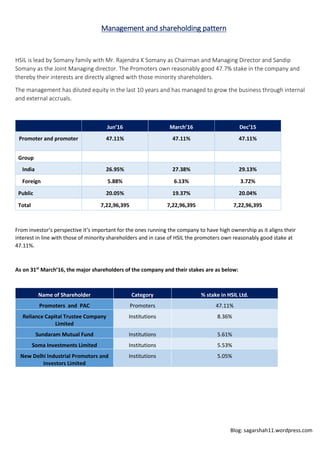
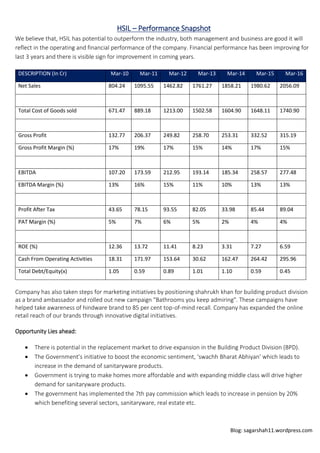
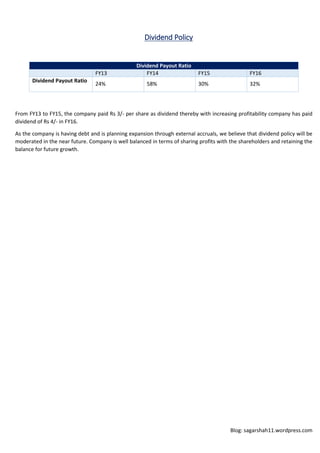
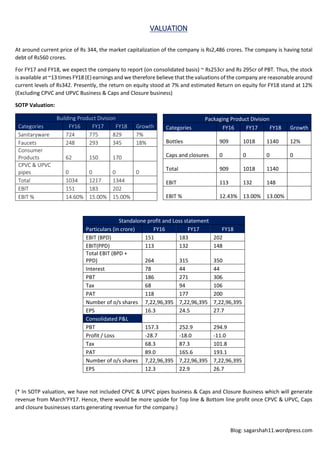
Blog: sagarshah11.wordpress.com
“slow and steady wins the race”
HSIL LTD (BSE Code: 500187)
Report made by:
Name: Sagar Shah
Email id: shah.sagar11@yahoo.in
Twitter : https://twitter.com/saggy_cool98
LinkedIn : https://www.linkedin.com/in/sagar-shah-583620b4
Facebook : https://www.facebook.com/sagar.shah.982
Blog: https://sagarshah11.wordpress.com/
Blog: sagarshah11.wordpress.com
Content Index
1. Company Snapshot
2. Understanding Business and company
3. Industry Overview
4. Financial Disclosure
5. Management and shareholding pattern
6. HSIL – Performance Snapshot
7. Dividend Policy
8. Valuations
9. Risk and Mitigation
Blog: sagarshah11.wordpress.com
Company Snapshot (10th Oct’16)
BSE CMP - 341 Dividend Yield - 1.17%
BSE CODE - 530589 Target Price – Rs 600
Market Capitalization - 2476.87 Cr. Total Equity Shares - 7.22 Cr.
Face Value – Rs 2 52 Weeks High/Low - Rs 224 / 370
Financial Snapshot:
Inc/Exp Statement(Consolidated) (Rs in Crore)
Description FY12 FY13 FY14 FY15 FY16
Net Sales 1462.82 1761.27 1858.21 1980.62 2056.09
Total Income 1467.90 1765.11 1862.02 1984.19 2059.58
Total Expenditure 1213.00 1502.58 1604.90 1648.11 1740.90
PBIDT 254.90 262.53 257.12 336.09 318.68
PAT 93.55 82.05 33.98 85.44 89.04
Dividend % 150.00 150.00 150.00 175.00 200.00
Adj. EPS(Rs) 14.16 12.42 5.14 11.82 12.32
PBIDTM (%) 16.27 13.80 12.87 15.82 14.45
EBITM (%) 12.12 10.15 7.36 9.93 9.00
Pre Tax Margin(%) 9.44 6.50 3.77 6.29 7.13
PATM (%) 5.97 4.31 1.70 4.02 4.04
Blog: sagarshah11.wordpress.com
Understanding Business and company
HSIL Limited is a diversified, consumer-focused organisation, with leadership position in sanitaryware and glass
containers industries. While in the bathroom fittings business, the Company has already reached #3 position in
the faucet category, it is concurrently gaining considerable market traction in the newly launched Consumer
Products Business. As a consumer-centric entity, HSIL is driven by the strong support of its customers to deliver
better quality products and solutions designed as per their evolving aspirations.
HSIL is a leading player in two business segment-
 Building products division
 Packaging Products division
Basically, its provides bathroom solutions, glass and plastic containers for packaging beverages, liquor,
Pharmaceutical and food products.
Company has forayed into the CPVC and UPVC pipes & fitting segments, where the company expect greater scale
building up in the coming years. It has also expanded business by entering into new product lines, specially
purification and water heaters and caps & closure category.
The company sell its product through network of around 3000+ dealers and 20,000+ retail touch points across
India and operates manufacturing facilities in Haryana, Telangana, Rajasthan and Karnataka.
Blog: sagarshah11.wordpress.com
Business Model:
BPD (in Crores) FY13 FY14 FY15 FY16 PPD (in Crores) FY13 FY14 FY15 FY16
Net Revenue 747 881 936 1034 Net Revenue 826 864 920 909
EBIT 136 183 178 151 EBIT 71 10 84 113
EBIT% 18.2% 20.8% 19.0% 14.6% EBIT% 8.6% 1.2% 9.1% 12.4%
Revenue Break-up for each division:
BPD (in crores) FY16 PPD (In Crores) FY16
Sanitaryware 724 Bottles 909
Faucets 248
Caps &
Closures
Starts from
March’ FY17
Consumer
Products 62
CPVC & UPVC
pipes
starts from March'
FY17
Packaging Product segment will play as turnaround segment for the company since Substitution of high cost fuel
(furnace oil) by alternate fuel, which has helped reduce the fuel cost and company decide to foray into
manufacture of security caps and closure, thus promising to add new revenues of growth. Company has increased
capacity utilization for coloured bottles, as well as chemical and smaller bottles, led to positive effect on the
profitability of PPD business.
46.70%
53.20%
0.10%
Segment Revenue Break-up (FY15-16)
Building Products Packaging Products Others
Blog: sagarshah11.wordpress.com
Industry Overview
Building Product Division
Sanitaryware Market:
 CAGR around 12-14% during last four years.
 Industry size currently estimated at around Rs3,800 Crore.
 Around 55% of market with organized player.
Faucet Market:
 CAGR of around 16%.
 Industry size estimated around Rs6,500 Crore.
 Around 52% of market with organized player.
Demand drivers for sanitaryware and Faucet Market:
 By 2025 India expected to have additional new mega cities, accommodating a population of 10 million or
More.
 The demand for replacement market in the sanitary ware industry is low in India - estimated at around
15% compared to developed countries where it is around 80%.
 Average life of a bathroom in urban India is expected to come down from 20 years to 12-14 years.
 Swachh Bharat Mission (SBM) launched on 2nd October, 2014 with an aim to eliminate open defecation.
Consumer Products Market:
 As per Management guidance, in next four to five years’ company will achieve 500 Crores with 5% market
share.
 It will generate 10% to 12% EBITDA Margin and it will generate more than 20% ROCE.
CPVC & UPVC pipes Market:
 Overall pipes industry estimated at around Rs25,000 Crore Market.
 Market size of this targeted segment in India estimated around at Rs 7,500 Crore.
 For plumbing Pipes, Industry CAGR around 18% and for Hot & cold pipes, Industry CAGR around 32%.
Asset turnover ratio for HSIL in sanitaryware segment is at 1.2x which seems as best in the industry while asset
turnover ratio for faucets is at 2.25x.
Blog: sagarshah11.wordpress.com
Packaging Product Division
Packaging Product Market:
 Global container and packaging market is expected to grow at 6.8%.
 Indian Glass Packaging Industry is estimated at around Rs. 6,000 crore.
 India’s per capita consumption of packaging is only 4.3 kgs as compared to Germany – 42 kgs and Taiwan –
19 kgs
 Liquor and beer represent the largest user segment of container glass and constitute 50% of the
requirement and this share has been growing in coming years.
 Total IMFL market estimated at around 320 million cases in year 2015-16 against 316 million cases in year
2014-15.
 Beer market in country is estimated at 250 million cases in 2015 and over 98% beer is packaged in glass
bottles with crown closure India’s per capita beer consumption of 1.9 bottles is lowest in BRIC nations.
Some Important Highlights:
 Company’s EBIT growth of 35% mainly due to higher usage of PET coke
 HNG and piramal are main competitors for the company which operates at 78% to 82% capacity utilization
while HSIL operates closed to 100% capacity utilization.
 Haldyn glass is leader in glass segments but profit margin of HSIL is higher than haldyn glass approx. around
50%.
Security caps and closures Market:
 Estimated market size is 3700 million pieces of caps per annum & with strong growth potential.
 New project will have capacity to produce 720 million pieces of caps per annum.
 Project located in State of Telangana & expected to be completed by March 2017.
Blog: sagarshah11.wordpress.com
Financial Disclosure
 In balance sheet, company has total debt of Rs 560 crore in which Rs230 crore working capital loan and
Rs330 is long term loan. In which company will repay Rs 125 crore in FY17 and FY18. So, company will
become debt free by FY18.
 Board has taken approval for issue of NCD worth of Rs 500 Crore (Non – convertible debenture). Cash flow
generated from current year. First, it will use to repay Rs125 crore. if company needed some fund for
setup security caps & closure plan then they will issue NCD to finance their new plant.
 Management has given guidance about Rs 350 crore capex for next 15 months.
 Company has subsidiary called HHRPL (Hindware Home Retail Private limited) which is incurring loss
around Rs 27 crore in FY16 mainly due to ownership business model. Now company has adopted new
strategy to minimize cost which is franchise business model. Presently, company has given 12 franchise
and 16 outlets are opened under ownership business model which should break even by FY 18. Company
has given guidance on loss reduction of 35% to 40% every year.
Blog: sagarshah11.wordpress.com
Management and shareholding pattern
HSIL is lead by Somany family with Mr. Rajendra K Somany as Chairman and Managing Director and Sandip
Somany as the Joint Managing director. The Promoters own reasonably good 47.7% stake in the company and
thereby their interests are directly aligned with those minority shareholders.
The management has diluted equity in the last 10 years and has managed to grow the business through internal
and external accruals.
Jun’16 March’16 Dec’15
Promoter and promoter 47.11% 47.11% 47.11%
Group
India 26.95% 27.38% 29.13%
Foreign 5.88% 6.13% 3.72%
Public 20.05% 19.37% 20.04%
Total 7,22,96,395 7,22,96,395 7,22,96,395
From investor’s perspective it’s important for the ones running the company to have high ownership as it aligns their
interest in line with those of minority shareholders and in case of HSIL the promoters own reasonably good stake at
47.11%.
As on 31st
March’16, the major shareholders of the company and their stakes are as below:
Name of Shareholder Category % stake in HSIL Ltd.
Promoters and PAC Promoters 47.11%
Reliance Capital Trustee Company
Limited
Institutions 8.36%
Sundaram Mutual Fund Institutions 5.61%
Soma Investments Limited Institutions 5.53%
New Delhi Industrial Promotors and
Investors Limited
Institutions 5.05%
Blog: sagarshah11.wordpress.com
HSIL – Performance Snapshot
We believe that, HSIL has potential to outperform the industry, both management and business are good it will
reflect in the operating and financial performance of the company. Financial performance has been improving for
last 3 years and there is visible sign for improvement in coming years.
Company has also taken steps for marketing initiatives by positioning shahrukh khan for building product division
as a brand ambassador and rolled out new campaign "Bathrooms you keep admiring". These campaigns have
helped take awareness of hindware brand to 85 per cent top-of-mind recall. Company has expanded the online
retail reach of our brands through innovative digital initiatives.
Opportunity Lies ahead:
 There is potential in the replacement market to drive expansion in the Building Product Division (BPD).
 The Government’s initiative to boost the economic sentiment, ‘swachh Bharat Abhiyan’ which leads to
increase in the demand of sanitaryware products.
 Government is trying to make homes more affordable and with expanding middle class will drive higher
demand for sanitaryware products.
 The government has implemented the 7th pay commission which leads to increase in pension by 20%
which benefiting several sectors, sanitaryware, real estate etc.
DESCRIPTION (In Cr) Mar-10 Mar-11 Mar-12 Mar-13 Mar-14 Mar-15 Mar-16
Net Sales 804.24 1095.55 1462.82 1761.27 1858.21 1980.62 2056.09
Total Cost of Goods sold 671.47 889.18 1213.00 1502.58 1604.90 1648.11 1740.90
Gross Profit 132.77 206.37 249.82 258.70 253.31 332.52 315.19
Gross Profit Margin (%) 17% 19% 17% 15% 14% 17% 15%
EBITDA 107.20 173.59 212.95 193.14 185.34 258.57 277.48
EBITDA Margin (%) 13% 16% 15% 11% 10% 13% 13%
Profit After Tax 43.65 78.15 93.55 82.05 33.98 85.44 89.04
PAT Margin (%) 5% 7% 6% 5% 2% 4% 4%
ROE (%) 12.36 13.72 11.41 8.23 3.31 7.27 6.59
Cash From Operating Activities 18.31 171.97 153.64 30.62 162.47 264.42 295.96
Total Debt/Equity(x) 1.05 0.59 0.89 1.01 1.10 0.59 0.45
Blog: sagarshah11.wordpress.com
Dividend Policy
Dividend Payout Ratio
FY13 FY14 FY15 FY16
Dividend Payout Ratio
24% 58% 30% 32%
From FY13 to FY15, the company paid Rs 3/- per share as dividend thereby with increasing profitability company has paid
dividend of Rs 4/- in FY16.
As the company is having debt and is planning expansion through external accruals, we believe that dividend policy will be
moderated in the near future. Company is well balanced in terms of sharing profits with the shareholders and retaining the
balance for future growth.
Blog: sagarshah11.wordpress.com
VALUATION
At around current price of Rs 344, the market capitalization of the company is Rs2,486 crores. The company is having total
debt of Rs560 crores.
For FY17 and FY18, we expect the company to report (on consolidated basis) ~ Rs253cr and Rs 295cr of PBT. Thus, the stock
is available at ~13 times FY18 (E) earnings and we therefore believe that the valuations of the company are reasonable around
current levels of Rs342. Presently, the return on equity stood at 7% and estimated Return on equity for FY18 stand at 12%
(Excluding CPVC and UPVC Business & Caps and Closure business)
SOTP Valuation:
Building Product Division
Categories FY16 FY17 FY18 Growth
Sanitaryware 724 775 829 7%
Faucets 248 293 345 18%
Consumer
Products 62 150 170
CPVC & UPVC
pipes 0 0 0 0
Total 1034 1217 1344
EBIT 151 183 202
EBIT % 14.60% 15.00% 15.00%
Standalone profit and Loss statement
Particulars (in crore) FY16 FY17 FY18
EBIT (BPD) 151 183 202
EBIT(PPD) 113 132 148
Total EBIT (BPD +
PPD) 264 315 350
Interest 78 44 44
PBT 186 271 306
Tax 68 94 106
PAT 118 177 200
Number of o/s shares 7,22,96,395 7,22,96,395 7,22,96,395
EPS 16.3 24.5 27.7
Consolidated P&L
PBT 157.3 252.9 294.9
Profit / Loss -28.7 -18.0 -11.0
Tax 68.3 87.3 101.8
PAT 89.0 165.6 193.1
Number of o/s shares 7,22,96,395 7,22,96,395 7,22,96,395
EPS 12.3 22.9 26.7
(* In SOTP valuation, we have not included CPVC & UPVC pipes business & Caps and Closure Business which will generate
revenue from March’FY17. Hence, there would be more upside for Top line & Bottom line profit once CPVC & UPVC, Caps
and closure businesses starts generating revenue for the company.)
Packaging Product Division
Categories FY16 FY17 FY18 Growth
Bottles 909 1018 1140 12%
Caps and closures 0 0 0 0
Total 909 1018 1140
EBIT 113 132 148
EBIT % 12.43% 13.00% 13.00%
Blog: sagarshah11.wordpress.com
Risk and Mitigation
 Adverse trends in the real estate sector and reduced activity in property repair and renovation may impact
demand for HSIL products. To mitigate the risk, the company reduced its dependence on institutional
sectors to 24% from 30% earlier, thus further curtailing the risk
 Market conditions remain highly competitive, which could lead to increased downward pressure on sales,
prices and profit margins. To mitigate the risk, Company has focussed expenditure on advertising and
promotional activities which enjoys “hindware brand” as top of the mind recall and is a market leader in
the sanitaryware industry.
 Cost pressures and reduced productivity could negatively impact operating margins and expansion plans.
To mitigate the risk, Company has started to use alternate fuels instead of high cost fuel has had a
significant bearing on margins in the container segment and focusing on improvement of productivity by
debottlenecking and capacity augmentation.
 HHRPL (Hindware Home Retail Private Limited) is making loss of Rs27 Crore in FY16. It will take two years
to perform and it should breakeven EBITDA level from FY18.
Blog: sagarshah11.wordpress.com
DISCLAIMER
Past performance is not indicative of future results. Neither my analysis nor my Report
guarantees any specific outcome or profit. You should be aware of the real risk of loss in
following any strategy or investment discussed on this Research Report. Strategies or
investments discussed may fluctuate in price or value. Investors may get back less than invested.
Investments or strategies mentioned on this Report or on the show may not be suitable for you.
This material does not take into account your particular investment objectives, financial situation
or needs and is not intended as recommendations appropriate for you. You must make an
independent decision regarding investments or strategies mentioned on this Research Report.
Before acting on information on this Research Report, you should consider whether it is suitable
for your particular circumstances and strongly consider seeking advice from your own financial or
investment adviser.

Hsil

  • 1.
    Blog: sagarshah11.wordpress.com “slow andsteady wins the race” HSIL LTD (BSE Code: 500187) Report made by: Name: Sagar Shah Email id: shah.sagar11@yahoo.in Twitter : https://twitter.com/saggy_cool98 LinkedIn : https://www.linkedin.com/in/sagar-shah-583620b4 Facebook : https://www.facebook.com/sagar.shah.982 Blog: https://sagarshah11.wordpress.com/
  • 2.
    Blog: sagarshah11.wordpress.com Content Index 1.Company Snapshot 2. Understanding Business and company 3. Industry Overview 4. Financial Disclosure 5. Management and shareholding pattern 6. HSIL – Performance Snapshot 7. Dividend Policy 8. Valuations 9. Risk and Mitigation
  • 3.
    Blog: sagarshah11.wordpress.com Company Snapshot(10th Oct’16) BSE CMP - 341 Dividend Yield - 1.17% BSE CODE - 530589 Target Price – Rs 600 Market Capitalization - 2476.87 Cr. Total Equity Shares - 7.22 Cr. Face Value – Rs 2 52 Weeks High/Low - Rs 224 / 370 Financial Snapshot: Inc/Exp Statement(Consolidated) (Rs in Crore) Description FY12 FY13 FY14 FY15 FY16 Net Sales 1462.82 1761.27 1858.21 1980.62 2056.09 Total Income 1467.90 1765.11 1862.02 1984.19 2059.58 Total Expenditure 1213.00 1502.58 1604.90 1648.11 1740.90 PBIDT 254.90 262.53 257.12 336.09 318.68 PAT 93.55 82.05 33.98 85.44 89.04 Dividend % 150.00 150.00 150.00 175.00 200.00 Adj. EPS(Rs) 14.16 12.42 5.14 11.82 12.32 PBIDTM (%) 16.27 13.80 12.87 15.82 14.45 EBITM (%) 12.12 10.15 7.36 9.93 9.00 Pre Tax Margin(%) 9.44 6.50 3.77 6.29 7.13 PATM (%) 5.97 4.31 1.70 4.02 4.04
  • 4.
    Blog: sagarshah11.wordpress.com Understanding Businessand company HSIL Limited is a diversified, consumer-focused organisation, with leadership position in sanitaryware and glass containers industries. While in the bathroom fittings business, the Company has already reached #3 position in the faucet category, it is concurrently gaining considerable market traction in the newly launched Consumer Products Business. As a consumer-centric entity, HSIL is driven by the strong support of its customers to deliver better quality products and solutions designed as per their evolving aspirations. HSIL is a leading player in two business segment-  Building products division  Packaging Products division Basically, its provides bathroom solutions, glass and plastic containers for packaging beverages, liquor, Pharmaceutical and food products. Company has forayed into the CPVC and UPVC pipes & fitting segments, where the company expect greater scale building up in the coming years. It has also expanded business by entering into new product lines, specially purification and water heaters and caps & closure category. The company sell its product through network of around 3000+ dealers and 20,000+ retail touch points across India and operates manufacturing facilities in Haryana, Telangana, Rajasthan and Karnataka.
  • 5.
    Blog: sagarshah11.wordpress.com Business Model: BPD(in Crores) FY13 FY14 FY15 FY16 PPD (in Crores) FY13 FY14 FY15 FY16 Net Revenue 747 881 936 1034 Net Revenue 826 864 920 909 EBIT 136 183 178 151 EBIT 71 10 84 113 EBIT% 18.2% 20.8% 19.0% 14.6% EBIT% 8.6% 1.2% 9.1% 12.4% Revenue Break-up for each division: BPD (in crores) FY16 PPD (In Crores) FY16 Sanitaryware 724 Bottles 909 Faucets 248 Caps & Closures Starts from March’ FY17 Consumer Products 62 CPVC & UPVC pipes starts from March' FY17 Packaging Product segment will play as turnaround segment for the company since Substitution of high cost fuel (furnace oil) by alternate fuel, which has helped reduce the fuel cost and company decide to foray into manufacture of security caps and closure, thus promising to add new revenues of growth. Company has increased capacity utilization for coloured bottles, as well as chemical and smaller bottles, led to positive effect on the profitability of PPD business. 46.70% 53.20% 0.10% Segment Revenue Break-up (FY15-16) Building Products Packaging Products Others
  • 6.
    Blog: sagarshah11.wordpress.com Industry Overview BuildingProduct Division Sanitaryware Market:  CAGR around 12-14% during last four years.  Industry size currently estimated at around Rs3,800 Crore.  Around 55% of market with organized player. Faucet Market:  CAGR of around 16%.  Industry size estimated around Rs6,500 Crore.  Around 52% of market with organized player. Demand drivers for sanitaryware and Faucet Market:  By 2025 India expected to have additional new mega cities, accommodating a population of 10 million or More.  The demand for replacement market in the sanitary ware industry is low in India - estimated at around 15% compared to developed countries where it is around 80%.  Average life of a bathroom in urban India is expected to come down from 20 years to 12-14 years.  Swachh Bharat Mission (SBM) launched on 2nd October, 2014 with an aim to eliminate open defecation. Consumer Products Market:  As per Management guidance, in next four to five years’ company will achieve 500 Crores with 5% market share.  It will generate 10% to 12% EBITDA Margin and it will generate more than 20% ROCE. CPVC & UPVC pipes Market:  Overall pipes industry estimated at around Rs25,000 Crore Market.  Market size of this targeted segment in India estimated around at Rs 7,500 Crore.  For plumbing Pipes, Industry CAGR around 18% and for Hot & cold pipes, Industry CAGR around 32%. Asset turnover ratio for HSIL in sanitaryware segment is at 1.2x which seems as best in the industry while asset turnover ratio for faucets is at 2.25x.
  • 7.
    Blog: sagarshah11.wordpress.com Packaging ProductDivision Packaging Product Market:  Global container and packaging market is expected to grow at 6.8%.  Indian Glass Packaging Industry is estimated at around Rs. 6,000 crore.  India’s per capita consumption of packaging is only 4.3 kgs as compared to Germany – 42 kgs and Taiwan – 19 kgs  Liquor and beer represent the largest user segment of container glass and constitute 50% of the requirement and this share has been growing in coming years.  Total IMFL market estimated at around 320 million cases in year 2015-16 against 316 million cases in year 2014-15.  Beer market in country is estimated at 250 million cases in 2015 and over 98% beer is packaged in glass bottles with crown closure India’s per capita beer consumption of 1.9 bottles is lowest in BRIC nations. Some Important Highlights:  Company’s EBIT growth of 35% mainly due to higher usage of PET coke  HNG and piramal are main competitors for the company which operates at 78% to 82% capacity utilization while HSIL operates closed to 100% capacity utilization.  Haldyn glass is leader in glass segments but profit margin of HSIL is higher than haldyn glass approx. around 50%. Security caps and closures Market:  Estimated market size is 3700 million pieces of caps per annum & with strong growth potential.  New project will have capacity to produce 720 million pieces of caps per annum.  Project located in State of Telangana & expected to be completed by March 2017.
  • 8.
    Blog: sagarshah11.wordpress.com Financial Disclosure In balance sheet, company has total debt of Rs 560 crore in which Rs230 crore working capital loan and Rs330 is long term loan. In which company will repay Rs 125 crore in FY17 and FY18. So, company will become debt free by FY18.  Board has taken approval for issue of NCD worth of Rs 500 Crore (Non – convertible debenture). Cash flow generated from current year. First, it will use to repay Rs125 crore. if company needed some fund for setup security caps & closure plan then they will issue NCD to finance their new plant.  Management has given guidance about Rs 350 crore capex for next 15 months.  Company has subsidiary called HHRPL (Hindware Home Retail Private limited) which is incurring loss around Rs 27 crore in FY16 mainly due to ownership business model. Now company has adopted new strategy to minimize cost which is franchise business model. Presently, company has given 12 franchise and 16 outlets are opened under ownership business model which should break even by FY 18. Company has given guidance on loss reduction of 35% to 40% every year.
  • 9.
    Blog: sagarshah11.wordpress.com Management andshareholding pattern HSIL is lead by Somany family with Mr. Rajendra K Somany as Chairman and Managing Director and Sandip Somany as the Joint Managing director. The Promoters own reasonably good 47.7% stake in the company and thereby their interests are directly aligned with those minority shareholders. The management has diluted equity in the last 10 years and has managed to grow the business through internal and external accruals. Jun’16 March’16 Dec’15 Promoter and promoter 47.11% 47.11% 47.11% Group India 26.95% 27.38% 29.13% Foreign 5.88% 6.13% 3.72% Public 20.05% 19.37% 20.04% Total 7,22,96,395 7,22,96,395 7,22,96,395 From investor’s perspective it’s important for the ones running the company to have high ownership as it aligns their interest in line with those of minority shareholders and in case of HSIL the promoters own reasonably good stake at 47.11%. As on 31st March’16, the major shareholders of the company and their stakes are as below: Name of Shareholder Category % stake in HSIL Ltd. Promoters and PAC Promoters 47.11% Reliance Capital Trustee Company Limited Institutions 8.36% Sundaram Mutual Fund Institutions 5.61% Soma Investments Limited Institutions 5.53% New Delhi Industrial Promotors and Investors Limited Institutions 5.05%
  • 10.
    Blog: sagarshah11.wordpress.com HSIL –Performance Snapshot We believe that, HSIL has potential to outperform the industry, both management and business are good it will reflect in the operating and financial performance of the company. Financial performance has been improving for last 3 years and there is visible sign for improvement in coming years. Company has also taken steps for marketing initiatives by positioning shahrukh khan for building product division as a brand ambassador and rolled out new campaign "Bathrooms you keep admiring". These campaigns have helped take awareness of hindware brand to 85 per cent top-of-mind recall. Company has expanded the online retail reach of our brands through innovative digital initiatives. Opportunity Lies ahead:  There is potential in the replacement market to drive expansion in the Building Product Division (BPD).  The Government’s initiative to boost the economic sentiment, ‘swachh Bharat Abhiyan’ which leads to increase in the demand of sanitaryware products.  Government is trying to make homes more affordable and with expanding middle class will drive higher demand for sanitaryware products.  The government has implemented the 7th pay commission which leads to increase in pension by 20% which benefiting several sectors, sanitaryware, real estate etc. DESCRIPTION (In Cr) Mar-10 Mar-11 Mar-12 Mar-13 Mar-14 Mar-15 Mar-16 Net Sales 804.24 1095.55 1462.82 1761.27 1858.21 1980.62 2056.09 Total Cost of Goods sold 671.47 889.18 1213.00 1502.58 1604.90 1648.11 1740.90 Gross Profit 132.77 206.37 249.82 258.70 253.31 332.52 315.19 Gross Profit Margin (%) 17% 19% 17% 15% 14% 17% 15% EBITDA 107.20 173.59 212.95 193.14 185.34 258.57 277.48 EBITDA Margin (%) 13% 16% 15% 11% 10% 13% 13% Profit After Tax 43.65 78.15 93.55 82.05 33.98 85.44 89.04 PAT Margin (%) 5% 7% 6% 5% 2% 4% 4% ROE (%) 12.36 13.72 11.41 8.23 3.31 7.27 6.59 Cash From Operating Activities 18.31 171.97 153.64 30.62 162.47 264.42 295.96 Total Debt/Equity(x) 1.05 0.59 0.89 1.01 1.10 0.59 0.45
  • 11.
    Blog: sagarshah11.wordpress.com Dividend Policy DividendPayout Ratio FY13 FY14 FY15 FY16 Dividend Payout Ratio 24% 58% 30% 32% From FY13 to FY15, the company paid Rs 3/- per share as dividend thereby with increasing profitability company has paid dividend of Rs 4/- in FY16. As the company is having debt and is planning expansion through external accruals, we believe that dividend policy will be moderated in the near future. Company is well balanced in terms of sharing profits with the shareholders and retaining the balance for future growth.
  • 12.
    Blog: sagarshah11.wordpress.com VALUATION At aroundcurrent price of Rs 344, the market capitalization of the company is Rs2,486 crores. The company is having total debt of Rs560 crores. For FY17 and FY18, we expect the company to report (on consolidated basis) ~ Rs253cr and Rs 295cr of PBT. Thus, the stock is available at ~13 times FY18 (E) earnings and we therefore believe that the valuations of the company are reasonable around current levels of Rs342. Presently, the return on equity stood at 7% and estimated Return on equity for FY18 stand at 12% (Excluding CPVC and UPVC Business & Caps and Closure business) SOTP Valuation: Building Product Division Categories FY16 FY17 FY18 Growth Sanitaryware 724 775 829 7% Faucets 248 293 345 18% Consumer Products 62 150 170 CPVC & UPVC pipes 0 0 0 0 Total 1034 1217 1344 EBIT 151 183 202 EBIT % 14.60% 15.00% 15.00% Standalone profit and Loss statement Particulars (in crore) FY16 FY17 FY18 EBIT (BPD) 151 183 202 EBIT(PPD) 113 132 148 Total EBIT (BPD + PPD) 264 315 350 Interest 78 44 44 PBT 186 271 306 Tax 68 94 106 PAT 118 177 200 Number of o/s shares 7,22,96,395 7,22,96,395 7,22,96,395 EPS 16.3 24.5 27.7 Consolidated P&L PBT 157.3 252.9 294.9 Profit / Loss -28.7 -18.0 -11.0 Tax 68.3 87.3 101.8 PAT 89.0 165.6 193.1 Number of o/s shares 7,22,96,395 7,22,96,395 7,22,96,395 EPS 12.3 22.9 26.7 (* In SOTP valuation, we have not included CPVC & UPVC pipes business & Caps and Closure Business which will generate revenue from March’FY17. Hence, there would be more upside for Top line & Bottom line profit once CPVC & UPVC, Caps and closure businesses starts generating revenue for the company.) Packaging Product Division Categories FY16 FY17 FY18 Growth Bottles 909 1018 1140 12% Caps and closures 0 0 0 0 Total 909 1018 1140 EBIT 113 132 148 EBIT % 12.43% 13.00% 13.00%
  • 13.
    Blog: sagarshah11.wordpress.com Risk andMitigation  Adverse trends in the real estate sector and reduced activity in property repair and renovation may impact demand for HSIL products. To mitigate the risk, the company reduced its dependence on institutional sectors to 24% from 30% earlier, thus further curtailing the risk  Market conditions remain highly competitive, which could lead to increased downward pressure on sales, prices and profit margins. To mitigate the risk, Company has focussed expenditure on advertising and promotional activities which enjoys “hindware brand” as top of the mind recall and is a market leader in the sanitaryware industry.  Cost pressures and reduced productivity could negatively impact operating margins and expansion plans. To mitigate the risk, Company has started to use alternate fuels instead of high cost fuel has had a significant bearing on margins in the container segment and focusing on improvement of productivity by debottlenecking and capacity augmentation.  HHRPL (Hindware Home Retail Private Limited) is making loss of Rs27 Crore in FY16. It will take two years to perform and it should breakeven EBITDA level from FY18.
  • 14.
    Blog: sagarshah11.wordpress.com DISCLAIMER Past performanceis not indicative of future results. Neither my analysis nor my Report guarantees any specific outcome or profit. You should be aware of the real risk of loss in following any strategy or investment discussed on this Research Report. Strategies or investments discussed may fluctuate in price or value. Investors may get back less than invested. Investments or strategies mentioned on this Report or on the show may not be suitable for you. This material does not take into account your particular investment objectives, financial situation or needs and is not intended as recommendations appropriate for you. You must make an independent decision regarding investments or strategies mentioned on this Research Report. Before acting on information on this Research Report, you should consider whether it is suitable for your particular circumstances and strongly consider seeking advice from your own financial or investment adviser.