Download to read offline
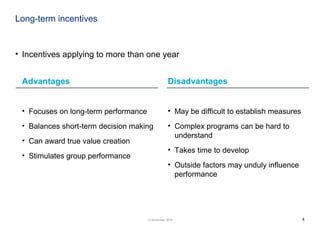
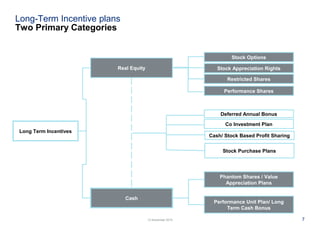
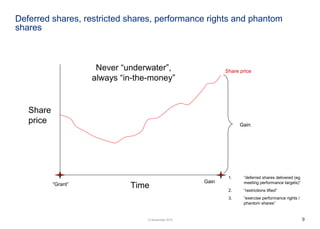


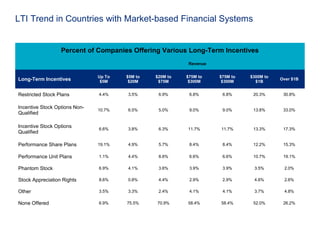
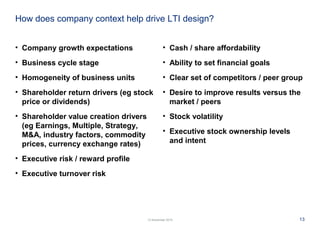

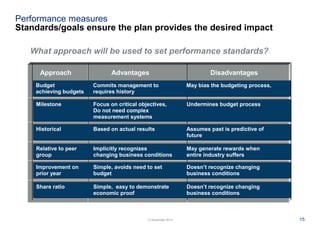


This document discusses long-term incentive plans and trends. It provides an overview of common long-term incentive types including real equity, cash, stock appreciation rights, restricted shares, performance units/cash bonuses, and phantom shares. It also discusses objectives for long-term incentive plans and considerations for designing plans including company context, performance measures, and emerging trends like increased emphasis on performance-based awards. Communication and administration of long-term incentive plans is also addressed.


