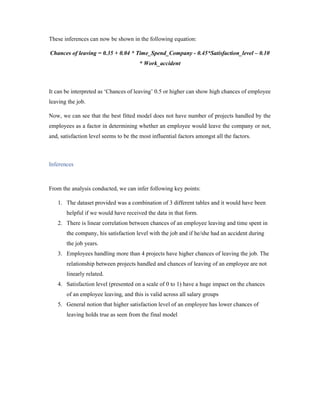
This report analyzes employee data to understand why employees leave companies. It explores relationships between variables like satisfaction level, projects handled, work accidents, and likelihood of leaving. It finds that higher satisfaction levels and more time at a company correlate with lower chances of leaving, while more projects and work accidents correlate with higher chances. The best predictor of leaving is satisfaction level. Employees handling over 4 projects or with satisfaction below 0.5 often leave.


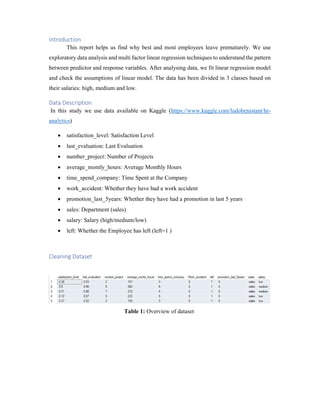
![We observed no null or missing values in
the data from figure 1.
Figure 1
Given the values in the data table, we can understand that the data is normalised and
has been collected by connecting employee record table, employee evaluation table and work
history table. Hence, we do not have to normalise the data.
As seen in the initial data exploration, satisfaction level and last evaluation have a scale
of 0 to 1 and work accident and promotion record have binary output [0,1]. Since, this data
does not have employee ID or employee name as attributes, it is difficult for us to identify
duplicate rows. Under the assumption that satisfaction level, last evaluation, number of projects
handled, time spent in the company and salary group can’t be the same for any 2 employees,
we check duplicates comparing these columns together.
After removing duplicates based on 9 variables, we find 11739 distinct rows. This step
helps us in eliminating data that may have been present in the dataset due to system error or
any other reason that we are not aware of.
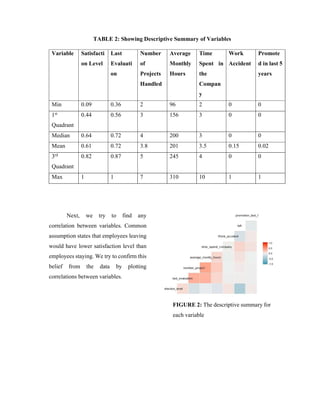
Now we study descriptive summary of the data:](https://image.slidesharecdn.com/hranalyticsproject-171220032557/85/Hr-analytics-project-3-320.jpg)