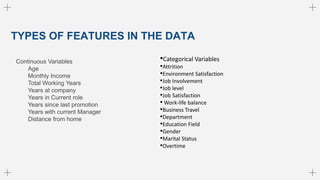
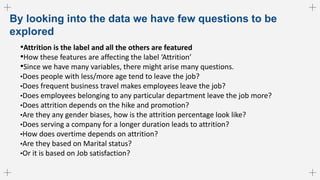
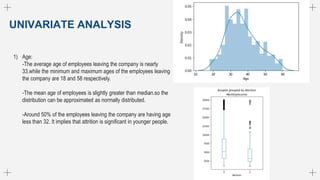
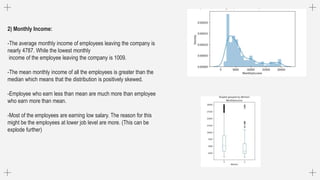
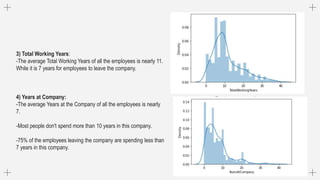
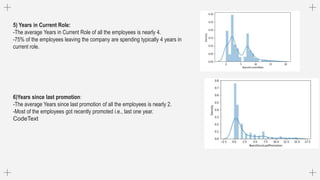
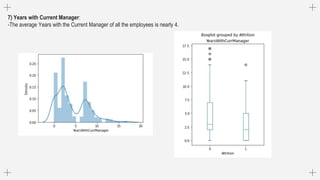
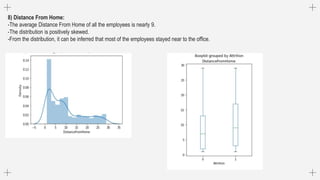
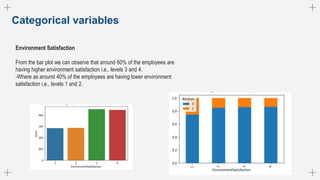
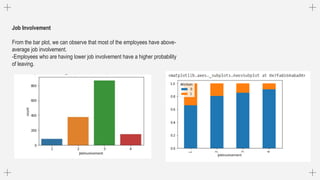
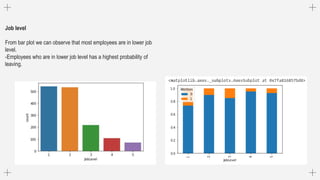
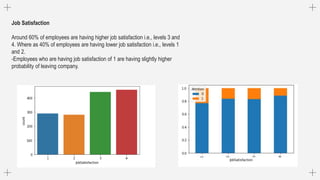
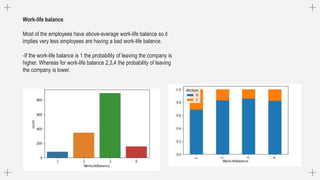
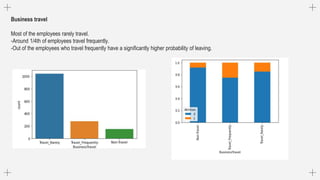
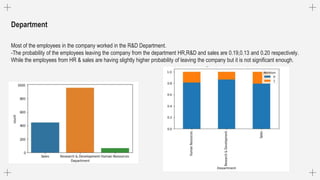
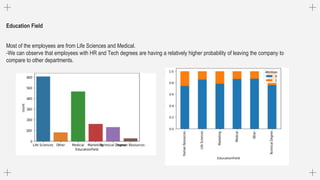
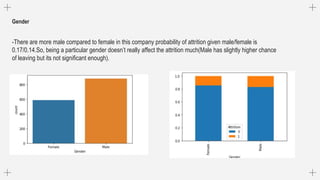
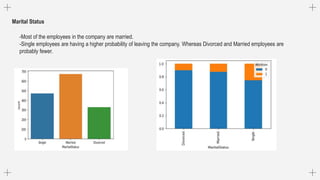
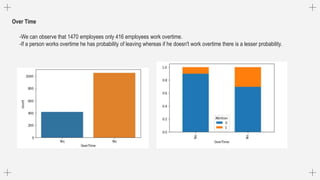
EXPLORATORY DATA ANALYSIS ON FACTORS AFFECTING
“ATTRITION RATE”
Team Members:
Gowtham Kumar (D22017)
Sekhar (D22041)
Vinay Kumar (D22049
Guide: Prof. Gourab Nath
Table of Contents
EDA on Employee attrition
Objective Looking into the
data
Type features in Data set
What are the
factors affecting
attrition
Variante Analysis Insights and
conclusions
01
04
02
05
03
06
TYPES OF FEATURES IN THE DATA
Continuous Variables
Age
Monthly Income
Total Working Years
Years at company
Years in Current role
Years since last promotion
Years with current Manager
Distance from home
•Categorical Variables
•Attrition
•Environment Satisfaction
•Job Involvement
•Job level
•Job Satisfaction
• Work-life balance
•Business Travel
•Department
•Education Field
•Gender
•Marital Status
•Overtime
By looking into the data we have few questions to be
explored
•Attrition is the label and all the others are featured
•How these features are affecting the label ‘Attrition’
•Since we have many variables, there might arise many questions.
•Does people with less/more age tend to leave the job?
•Does frequent business travel makes employees leave the job?
•Does employees belonging to any particular department leave the job more?
•Does attrition depends on the hike and promotion?
•Are they any gender biases, how is the attrition percentage look like?
•Does serving a company for a longer duration leads to attrition?
•How does overtime depends on attrition?
•Are they based on Marital status?
•Or it is based on Job satisfaction?
UNIVARIATE ANALYSIS
1) Age:
-The average age of employees leaving the company is nearly
33.while the minimum and maximum ages of the employees leaving
the company are 18 and 58 respectively.
2)
-The mean age of employees is slightly greater than median.so the
distribution can be approximated as normally distributed.
3)
-Around 50% of the employees leaving the company are having age
less than 32. It implies that attrition is significant in younger people.
2) Monthly Income:
-The average monthly income of employees leaving the company is
nearly 4787. While the lowest monthly
income of the employee leaving the company is 1009.
-The mean monthly income of all the employees is greater than the
median which means that the distribution is positively skewed.
-Employee who earn less than mean are much more than employee
who earn more than mean.
-Most of the employees are earning low salary. The reason for this
might be the employees at lower job level are more. (This can be
explode further)
3) Total Working Years:
-The average Total Working Years of all the employees is nearly 11.
While it is 7 years for employees to leave the company.
4) Years at Company:
-The average Years at the Company of all the employees is nearly
7.
-Most people don't spend more than 10 years in this company.
-75% of the employees leaving the company are spending less than
7 years in this company.
5) Years in Current Role:
-The average Years in Current Role of all the employees is nearly 4.
-75% of the employees leaving the company are spending typically 4 years in
current role.
6)Years since last promotion:
-The average Years since last promotion of all the employees is nearly 2.
-Most of the employees got recently promoted i.e., last one year.
CodeText
7) Years with Current Manager:
-The average Years with the Current Manager of all the employees is nearly 4.
8) Distance From Home:
-The average Distance From Home of all the employees is nearly 9.
-The distribution is positively skewed.
-From the distribution, it can be inferred that most of the employees stayed near to the office.
Categorical variables
Environment Satisfaction
From the bar plot we can observe that around 60% of the employees are
having higher environment satisfaction i.e., levels 3 and 4.
-Where as around 40% of the employees are having lower environment
satisfaction i.e., levels 1 and 2.
Job Involvement
From the bar plot, we can observe that most of the employees have above-
average job involvement.
-Employees who are having lower job involvement have a higher probability
of leaving.
Job level
From bar plot we can observe that most employees are in lower job
level.
-Employees who are in lower job level has a highest probability of
leaving.
Job Satisfaction
Around 60% of employees are having higher job satisfaction i.e., levels 3 and
4. Where as 40% of employees are having lower job satisfaction i.e., levels 1
and 2.
-Employees who are having job satisfaction of 1 are having slightly higher
probability of leaving company.
Work-life balance
Most of the employees have above-average work-life balance so it
implies very less employees are having a bad work-life balance.
-If the work-life balance is 1 the probability of leaving the company is
higher. Whereas for work-life balance 2,3,4 the probability of leaving
the company is lower.
Business travel
Most of the employees rarely travel.
-Around 1/4th of employees travel frequently.
-Out of the employees who travel frequently have a significantly higher probability of leaving.
Department
Most of the employees in the company worked in the R&D Department.
-The probability of the employees leaving the company from the department HR,R&D and sales are 0.19,0.13 and 0.20 respectively.
While the employees from HR & sales are having slightly higher probability of leaving the company but it is not significant enough.
Education Field
Most of the employees are from Life Sciences and Medical.
-We can observe that employees with HR and Tech degrees are having a relatively higher probability of leaving the company to
compare to other departments.
Gender
-There are more male compared to female in this company probability of attrition given male/female is
0.17/0.14.So, being a particular gender doesn’t really affect the attrition much(Male has slightly higher chance
of leaving but its not significant enough).
Marital Status
-Most of the employees in the company are married.
-Single employees are having a higher probability of leaving the company. Whereas Divorced and Married employees are
probably fewer.
Over Time
-We can observe that 1470 employees only 416 employees work overtime.
-If a person works overtime he has probability of leaving whereas if he doesn't work overtime there is a lesser probability.

Exploratory Data Analysis on Factors Affecting “Attrition Rate”.pptx

  • 1.
    EXPLORATORY DATA ANALYSISON FACTORS AFFECTING “ATTRITION RATE” Team Members: Gowtham Kumar (D22017) Sekhar (D22041) Vinay Kumar (D22049 Guide: Prof. Gourab Nath
  • 2.
    Table of Contents EDAon Employee attrition Objective Looking into the data Type features in Data set What are the factors affecting attrition Variante Analysis Insights and conclusions 01 04 02 05 03 06
  • 3.
    TYPES OF FEATURESIN THE DATA Continuous Variables Age Monthly Income Total Working Years Years at company Years in Current role Years since last promotion Years with current Manager Distance from home •Categorical Variables •Attrition •Environment Satisfaction •Job Involvement •Job level •Job Satisfaction • Work-life balance •Business Travel •Department •Education Field •Gender •Marital Status •Overtime
  • 4.
    By looking intothe data we have few questions to be explored •Attrition is the label and all the others are featured •How these features are affecting the label ‘Attrition’ •Since we have many variables, there might arise many questions. •Does people with less/more age tend to leave the job? •Does frequent business travel makes employees leave the job? •Does employees belonging to any particular department leave the job more? •Does attrition depends on the hike and promotion? •Are they any gender biases, how is the attrition percentage look like? •Does serving a company for a longer duration leads to attrition? •How does overtime depends on attrition? •Are they based on Marital status? •Or it is based on Job satisfaction?
  • 5.
    UNIVARIATE ANALYSIS 1) Age: -Theaverage age of employees leaving the company is nearly 33.while the minimum and maximum ages of the employees leaving the company are 18 and 58 respectively. 2) -The mean age of employees is slightly greater than median.so the distribution can be approximated as normally distributed. 3) -Around 50% of the employees leaving the company are having age less than 32. It implies that attrition is significant in younger people.
  • 6.
    2) Monthly Income: -Theaverage monthly income of employees leaving the company is nearly 4787. While the lowest monthly income of the employee leaving the company is 1009. -The mean monthly income of all the employees is greater than the median which means that the distribution is positively skewed. -Employee who earn less than mean are much more than employee who earn more than mean. -Most of the employees are earning low salary. The reason for this might be the employees at lower job level are more. (This can be explode further)
  • 7.
    3) Total WorkingYears: -The average Total Working Years of all the employees is nearly 11. While it is 7 years for employees to leave the company. 4) Years at Company: -The average Years at the Company of all the employees is nearly 7. -Most people don't spend more than 10 years in this company. -75% of the employees leaving the company are spending less than 7 years in this company.
  • 8.
    5) Years inCurrent Role: -The average Years in Current Role of all the employees is nearly 4. -75% of the employees leaving the company are spending typically 4 years in current role. 6)Years since last promotion: -The average Years since last promotion of all the employees is nearly 2. -Most of the employees got recently promoted i.e., last one year. CodeText
  • 9.
    7) Years withCurrent Manager: -The average Years with the Current Manager of all the employees is nearly 4.
  • 10.
    8) Distance FromHome: -The average Distance From Home of all the employees is nearly 9. -The distribution is positively skewed. -From the distribution, it can be inferred that most of the employees stayed near to the office.
  • 11.
    Categorical variables Environment Satisfaction Fromthe bar plot we can observe that around 60% of the employees are having higher environment satisfaction i.e., levels 3 and 4. -Where as around 40% of the employees are having lower environment satisfaction i.e., levels 1 and 2.
  • 12.
    Job Involvement From thebar plot, we can observe that most of the employees have above- average job involvement. -Employees who are having lower job involvement have a higher probability of leaving.
  • 13.
    Job level From barplot we can observe that most employees are in lower job level. -Employees who are in lower job level has a highest probability of leaving.
  • 14.
    Job Satisfaction Around 60%of employees are having higher job satisfaction i.e., levels 3 and 4. Where as 40% of employees are having lower job satisfaction i.e., levels 1 and 2. -Employees who are having job satisfaction of 1 are having slightly higher probability of leaving company.
  • 15.
    Work-life balance Most ofthe employees have above-average work-life balance so it implies very less employees are having a bad work-life balance. -If the work-life balance is 1 the probability of leaving the company is higher. Whereas for work-life balance 2,3,4 the probability of leaving the company is lower.
  • 16.
    Business travel Most ofthe employees rarely travel. -Around 1/4th of employees travel frequently. -Out of the employees who travel frequently have a significantly higher probability of leaving.
  • 17.
    Department Most of theemployees in the company worked in the R&D Department. -The probability of the employees leaving the company from the department HR,R&D and sales are 0.19,0.13 and 0.20 respectively. While the employees from HR & sales are having slightly higher probability of leaving the company but it is not significant enough.
  • 18.
    Education Field Most ofthe employees are from Life Sciences and Medical. -We can observe that employees with HR and Tech degrees are having a relatively higher probability of leaving the company to compare to other departments.
  • 19.
    Gender -There are moremale compared to female in this company probability of attrition given male/female is 0.17/0.14.So, being a particular gender doesn’t really affect the attrition much(Male has slightly higher chance of leaving but its not significant enough).
  • 20.
    Marital Status -Most ofthe employees in the company are married. -Single employees are having a higher probability of leaving the company. Whereas Divorced and Married employees are probably fewer.
  • 21.
    Over Time -We canobserve that 1470 employees only 416 employees work overtime. -If a person works overtime he has probability of leaving whereas if he doesn't work overtime there is a lesser probability.