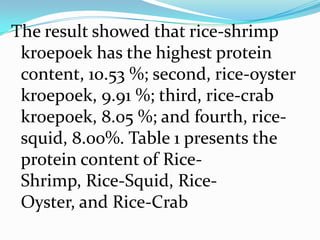
Chapter 4
Analysis, Presentati
      on, And
 Interpretation of
       Data
All specific questions in
 Chapter 1 under
 statement of the
 problem may be
 answered in this chapter
 supported with tables.
Analysis
 It is the process of breaking up the
whole study into its constituent
parts of categories according to the
specific questions under the
statement of the problem. This is to
bring out into focus the essential
features of the study. Analysis
usually precedes presentation.
Presentation of Data
 It is the process of organizing
 data into
 logical, sequential, and
 meaningful categories and
 classifications to make them
 amenable to study and
 interpretation.
Analysis and presentation put
data into proper order and in
categories reducing them into
forms that are intelligible and
interpretable so that the
relationships between the
research specific questions and
their intended answers can be
established.
Research Problem # 1
( under statement of the problem )
1. What is the protein
 content of Kroepoek from
 Rice-Shrimp, Rice-
 Squid, Rice-Oyster, and
 Rice-Crab?
Table 1. Protein Content of Kroepoek from Rice-
Shrimp, Rice-Squid, Rice-Oyster, and Rice-Crab
                  ProteinContent
 Kroepoek            Percent           Rank

Rice-Shrimp             10.53            1
 Rice-Squid              9.91            2
 Rice-Oyster            8.05             3
  Rice-Crab             8.00             4
The result showed that rice-shrimp
 kroepoek has the highest protein
 content, 10.53 %; second, rice-oyster
 kroepoek, 9.91 %; third, rice-crab
 kroepoek, 8.05 %; and fourth, rice-
 squid, 8.00%. Table 1 presents the
 protein content of Rice-
 Shrimp, Rice-Squid, Rice-
 Oyster, and Rice-Crab
Three Ways of Presenting Data
1. Textual Presentation of Data
    It uses statements with
numerals or numbers to describe
data. The main aims of textual
presentations are to focus attention
to some important data and to
supplement tabular presentation.
2.Tabular Presentation
A statistical table or simply table is
 defined as systematic arrangement of
 related data in which classes of
 numerical facts or data are given each
 a row and their sub classes are given
 each a column in order to present the
 relationships of the sets or numerical
 facts or data in a definite ,compact
 and understandable forms.
3.Graphical Presentation of
             Data.
A graph is a chart representing the
 quantitative variations or changes of
 a variable itself , or quantitative
 changes of a variable in comparison
 with those of another variable or
 variables in pictorial or
 diagrammatic form.
Limitations of graphs
1. Graphs do not show as much
  information at a time as do tables.
2. Graphs do not show data as
  accurately as the tables do.
3. Charts require more skill, more
  time, and more expense to prepare
  than tables.
Types of graphs or charts
1. Bar graphs
2. Linear graphs
3. Hundred percent graphs or charts
4. Pictographs
5. Statistical maps
6. Ratio charts

How to write chapter 4 sy '11'12

  • 1.
    Chapter 4 Analysis, Presentati on, And Interpretation of Data
  • 2.
    All specific questionsin Chapter 1 under statement of the problem may be answered in this chapter supported with tables.
  • 3.
    Analysis It isthe process of breaking up the whole study into its constituent parts of categories according to the specific questions under the statement of the problem. This is to bring out into focus the essential features of the study. Analysis usually precedes presentation.
  • 4.
    Presentation of Data It is the process of organizing data into logical, sequential, and meaningful categories and classifications to make them amenable to study and interpretation.
  • 5.
    Analysis and presentationput data into proper order and in categories reducing them into forms that are intelligible and interpretable so that the relationships between the research specific questions and their intended answers can be established.
  • 6.
    Research Problem #1 ( under statement of the problem ) 1. What is the protein content of Kroepoek from Rice-Shrimp, Rice- Squid, Rice-Oyster, and Rice-Crab?
  • 7.
    Table 1. ProteinContent of Kroepoek from Rice- Shrimp, Rice-Squid, Rice-Oyster, and Rice-Crab ProteinContent Kroepoek Percent Rank Rice-Shrimp 10.53 1 Rice-Squid 9.91 2 Rice-Oyster 8.05 3 Rice-Crab 8.00 4
  • 8.
    The result showedthat rice-shrimp kroepoek has the highest protein content, 10.53 %; second, rice-oyster kroepoek, 9.91 %; third, rice-crab kroepoek, 8.05 %; and fourth, rice- squid, 8.00%. Table 1 presents the protein content of Rice- Shrimp, Rice-Squid, Rice- Oyster, and Rice-Crab
  • 9.
    Three Ways ofPresenting Data 1. Textual Presentation of Data It uses statements with numerals or numbers to describe data. The main aims of textual presentations are to focus attention to some important data and to supplement tabular presentation.
  • 10.
    2.Tabular Presentation A statisticaltable or simply table is defined as systematic arrangement of related data in which classes of numerical facts or data are given each a row and their sub classes are given each a column in order to present the relationships of the sets or numerical facts or data in a definite ,compact and understandable forms.
  • 11.
    3.Graphical Presentation of Data. A graph is a chart representing the quantitative variations or changes of a variable itself , or quantitative changes of a variable in comparison with those of another variable or variables in pictorial or diagrammatic form.
  • 12.
    Limitations of graphs 1.Graphs do not show as much information at a time as do tables. 2. Graphs do not show data as accurately as the tables do. 3. Charts require more skill, more time, and more expense to prepare than tables.
  • 13.
    Types of graphsor charts 1. Bar graphs 2. Linear graphs 3. Hundred percent graphs or charts 4. Pictographs 5. Statistical maps 6. Ratio charts