Downloaded 51 times


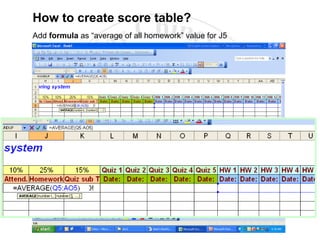


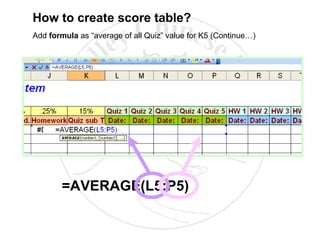

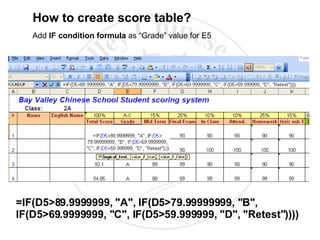


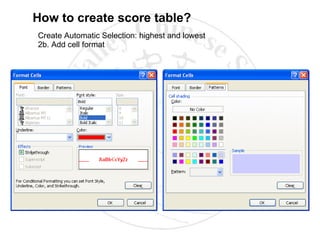

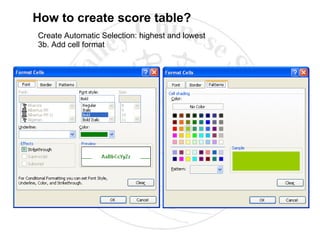


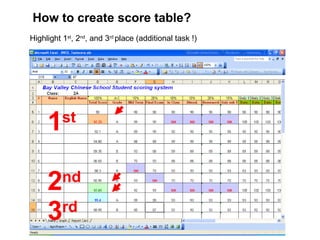


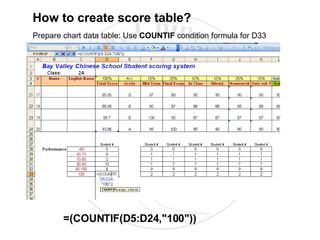
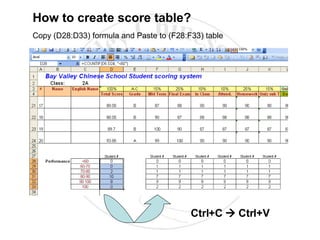
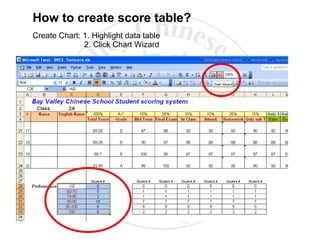
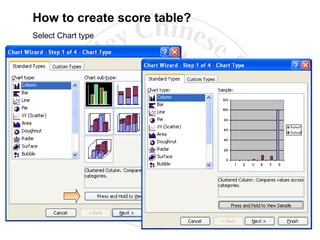


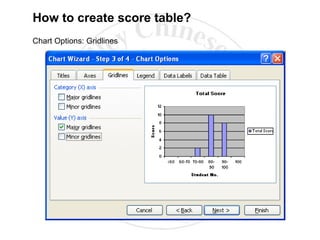


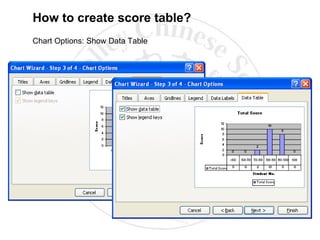

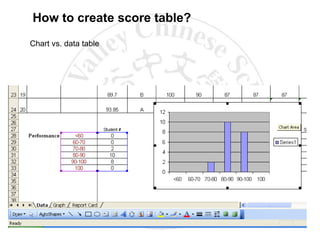


The document provides step-by-step instructions for creating a score table and chart in Excel. It describes how to enter column headers, define rows, add borders, colors and formulas to calculate percentages, averages, totals and grades. It also covers formatting the table, highlighting the highest and lowest scores, preparing chart data with COUNTIF formulas, selecting a chart type, formatting titles, axes, legend and data labels, and positioning the chart on the worksheet.