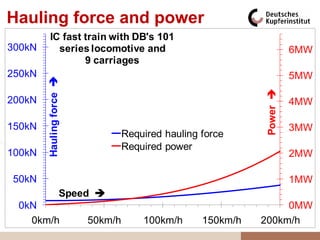
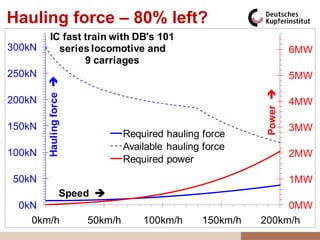
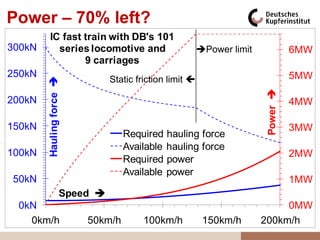
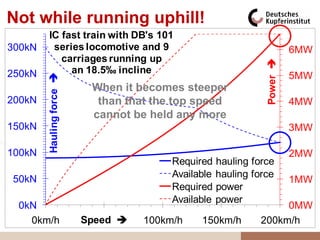
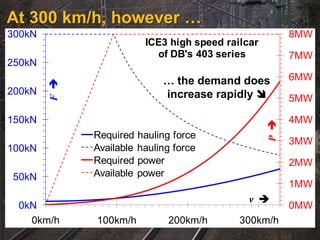
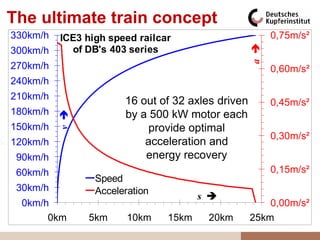
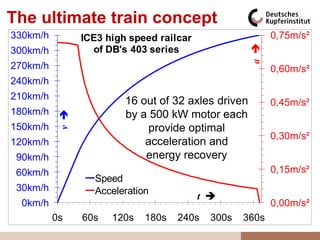
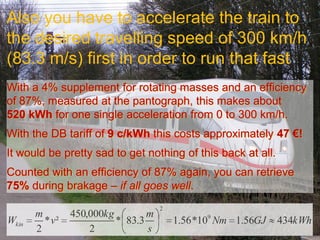
How energy efficient really is
railway transportation?
Stefan Fassbinder
Deutsches Kupferinstitut
Am Bonneshof 5
D-40474 Düsseldorf
Tel.: +49 211 4796-323
Fax: +49 211 4796-310
sfassbinder@kupferinstitut.de
stf@eurocopper.org
www.kupferinstitut.de
www.leonardo-energy.org
The German Copper Institute, DKI, is
the central information and advisory
service dealing with all uses of copper
and copper alloys.
We offer our services to:
   Commercial companies    We can be contacted by:
   The skilled trades       post
   Industry                 phone
   R & D institutes         fax
   Universities             e-mail
   Artists and craftsmen    internet
   Students                 online database, or
   Private individuals      personally
Does electricity boost mobility?
Electric cars are
• technically not feasible for long distances,
• economically not viable for short distances.
To charge up a laptop PC
• costs 1 cent for electricity from the socket.
• The battery costs 90 € and survives 1000 duty cycles.
• This means:
  10 times higher energy price while battery powered!
  With big units for vehicles the factor still is around 3.
The »tank« of an electric car
• costs 3000 €/l,     converted to energy equivalent diesel
• weighs 30 kg/l
                 }    fuel quantity (ηD = 30%, ηE = 90%)
• and is over and done with after 1000 … 3000 fillings.
But still the trade press
wanted it yet another time:
»Market introduction of electric cars to
start in 2011«
Comparison:     Citroën C-Zero     Citroën C1
                    (electric)   (petrol engine)


Length            3480 mm          3430 mm
Width             1475 mm          1630 mm At least one thing is
Height            1792 mm          1470 mm certain:
Empty mass         1195 kg           925 kg
Payload             255 kg           265 kg  These vehicles are
Luggage volume       166 l            139 l     really comparable.
Turning circle       9.0 m            9.5 m    This is a real electric
Drive                 back             front    car in its own right!
Gears (forward)        1                 5
                                               Only the payback –
Power rating        49 kW            50 kW
                                                even without fuel tax
Top speed         130 km/h         157 km/h
                                                – takes 469,000 km!
Acceleration         15.9 s           13.7 s
Cruising range      150 km           760 km  This corresponds to
CO2 emissions     100 g/km         107 g/km     3,000 charging
Energy costs    2.20 €/100 km    6.90 €/100 km cycles – the end of
Purchase price     35,165 €         13,120 €    the battery lifetime…
Electricity does boost mobility!
If only there is a way to bring the power into the vehicle
Electric motors
• have their highest torque at standstill:
  No disengaging, no gearchange, no torque converter
  required,
• provide a considerable short-term overload capability:
  Higher acceleration than the power rating would let you
  suppose,
• do not have any no-load consumption during standstill,
  rolling or braking,
• offer the opportunity to feed back energy during braking
  (motor = generator),
• and their primary fuel is totally flexible (fossil, nuclear,
  hydro, wind – just mix as you like!).
So it is not a miracle
if railway companies prefer
electric traction!
                                                     Characteristic data of 16.7 Hz railways
         Electricity system of DB AG
                                                                   in D-A-CH
                               Installed  Energy
Type of power plant                                                                          DB AG      ÖBB       SBB
                               capacity production
Vapour                             42.2%    66.0%                   Employees                 240242     42893     27822
Hydro                             11.0%     10.0%                   Passengers               1919Mio.   200Mio.   332Mio.


                                                     Railway grid
Rotating convertor                34.3%     14.6%                             total          33862km 11000km      3011km
Electronic convertor              11.9%      9.4%                            electrified     19300km    8200km    3011km


                                                                     share
Total                            3.2GW 11.0TWh/a                              of lines           57%       75%     100%
Sum of all electric vehicles    22.4GW (700%)                                 of transport       85%               100%
                                                                              volume

                                                         56% of DB lines are
    … since the energy                               electrified. These 56% carry
“consumption” of an electric                               85% of all traffic.
locomotive can be negative!                                   However …
…what about the other 15%?


                                   e. g. the
                                   612 series?
• Engine power rating: 2*560 kW = 1120 kW
• Smart and convenient:
  Tilting technique, air conditioning
• Maximum permissible speed: 160 km/h
• Fuel consumption: 1.7 l/km (for one, not 100 km!)
What about diesel locomotives?
• On a series 232 diesel locomotive (6 axles, 120 t,
  2,200 kW, max. 120 km/h) at a constant speed of
  120 km/h a consumption of 3 l/km was measured.
• (for good resons railway companies reference the fuel consumptions to
  one kilometre, not to 100 kilometres!)
• There have not been any new diesel locomotives for decades.
• There are old diesel locomotives with new engines.
•BR 232 “Ludmila” is then >40%.
 The engine efficiency                                                      BR 220 “Taiga Drum”
• But what„s the use of this if the engine is idling for >90% of its operating
  time?
• And if a DB technician explains: “Diesel locomotives hamper the traffic
  when circulating on an electrified line!” …
• …and if a railway trade journal reports the electrification of a line no
  longer than 22 km had already cut the circulation time by 5 minutes?
„Elektrischer Betrieb bei der Deutschen Bahn im Jahre 2009“. „eb“ Elektrische Bahnen & Verkehrssysteme 1-2/2010, p.19
However, the 101 series electric loco
(4 axles, 84 t, 220 km/h) provides a
motor power rating of 6,600 kW!


Note: It„s electricity that wakes trains up!
This explains it:
800kW/t

                                   Inverse trends!
600kW/t
                                Power density of reciprocating
                                combustion engines
          Power density →


400kW/t                         Power density per size of
                                respective electric motors


200kW/t


                            Power rating →
  0kW/t
      1kW                      10kW     100kW     1000kW 10000kW 100000kW
The parameters responsible for
the energy demand are
(at ≈200 km/h):       of a car of a train                  factor
                                    (4…5 seats)(450 seats) 100
Mass                                     1.5 t     450 t     300
Coefficient of staticare a means of mass transportation! 0.3
        Note: Trains friction             ≈1    0.28…0.35
Coefficient of rolling friction          ≈2%       <2‰!      0.1
Resulting: some good reasons railwaykN
Note: For Rolling friction force        0.3 companies give rolling
                                                    9 kN      30
Power demand resulting from as per kW figures!
             friction coefficients this 15 mille 450 kW       30
as a share of power rating               15%         7%      0.5
Air friction force                      1.5 kN     30 kN      20
Power demand resulting from this 85 kW           1550 kW      18
as a share of power rating               85%        23%      0.27
Total power demand                     100 kW    2000 kW      20
as a share of power rating              100%       30%!      3.3
Now what are the other
70% of power good for?
Compared to a car, a train has:
- A very great mass.
- Significantly less static friction
  (steel on steel rather than rubber on asphalt).
+ Significantly less rolling friction
  (steel on steel rather than rubber on asphalt).
+ Significantly less air friction (since the train
  travels “in its own windshade”, so to say).
On rails even a »Unimog« universal
miniature lorry can haul 1000 t!


Though not at a particularly high speed
Worth noting:
The top speed

of a car is usually   of a railway vehicle
the highest           is usually the
possible              highest
speed, limited by     permissible
the available         speed.
engine power.
With a great deal of good will
 66kW                                     6,6MW
we will now requirement car anda train
          Power let a car with IC

•55kW kW engine and (very tight) space for
  66  P (car) 
                                          5,5MW


                                     P (IC train) 
•44kW
  4 passengers travel at                  4,4MW
•33kW km/h, P (car)
  200                                     3,3MW
                 P (IC train)
while a train with a drive power rating of
 22kW                                     2,2MW
• 6,600 kW offers plenty of space to
•11kW passengers (including toilets, a
  400                                     1,1MW

  bistro, …). At a travelling speed of 0,0MW
  0kW
                                      v 

• 200 km/h50km/h requires: 150km/h 200km/h
    0km/h
               this 100km/h
But a car accelerates faster?
100%
90%    v/vmax 

80%
70%                               Well, initially process the
                                    Acceleration yes, but
                                 train has a lot of reserves!
                                car and train (0 … 200 km/h)
60%
50%
40%
                          Car acceleration v/vmax
30%
                          IC train (10 carriages) v/vmax
20%
10%
 0%
   0km            1km   2km   3km    4km    5km     s 
                                                    6km    7km   8km
Quiz question 1:
How far will an ICE2 express
train of the 402 series continue to roll
unbraked in a flat area when suddenly
the power fails at a speed of 230 km/h?
Answer 1:
The test was not carried out all through
to the end. After 32 km the train was still
rolling at 120 km/h!
Quiz question 2:
How fast will a railway carriage
become when you let it roll down a
decline of 5‰ (just 0.5%!)?
Answer 2:
Note: For some good reasons railway
companies give inclines and declines
According to technical documents by as
per mille Bahn AG
Deutsche figures! it will (finally) reach
a speed of 44 m/s ≈ 160 km/h (after
1 hour of rolling)!
A street car would simply just stall and not roll at all!
Quiz question 3:
Why is it that in a train repair
hall which can be opened at both ends
it is not allowed to leave both gates
open at the same time?
Answer 3:
Because the wind might blow the
locomotoves out of the hall!
So let’s just accelerate a
200km/h
fully occupied street car
   v 


to 200 km/h, disengage
150km/h
and see what will
happen…
100km/h
Mass:                          Train rolls kg
                                  2000
                               Train rolls
                               Train brakes
                               Car rolling out
Rolling friction coefficient: Car rolling out
 50km/h
                                         2%
                               Car rolling out

Front surface area:                      2 m²
cx value:
  0km/h                                  0.37
                             2km s 
Engine power: 1km
       0km
                                    105 kW     3km
Adapting the scale to the train:
200km/h
                             Rolling and braking:
   v 

                          Express train (10 carriages)
                                  versus car
150km/h


100km/h
                   Train rolls
                   Train brakes
                   Car rolling out
 50km/h


                                                   s 
  0km/h
       0km   5km       10km          15km   20km     25km
Adapting the scale to the train:
200km/h
                                Rolling and braking:
   v 

                             Express train (10 carriages)
                                     versus car
150km/h


100km/h
                      Train rolls
                      Train brakes
                      Car rolling out
 50km/h


                                                      t 
  0km/h
          0s   120s        240s         360s   480s         600s
Hauling force and power
           IC fast train with DB's 101
300kN        series locomotive and                                      6MW
                   9 carriages
250kN                                                                   5MW
        Hauling force 


                                                              Power 
200kN                                                                   4MW

150kN                                                                   3MW
                                   Required hauling force
                                   Required power
100kN                                                                   2MW

50kN                                                                    1MW
                      Speed 
 0kN                                                               0MW
   0km/h                  50km/h       100km/h      150km/h   200km/h
Hauling force – 80% left?
           IC fast train with DB's 101
300kN        series locomotive and                                      6MW
                   9 carriages
250kN                                                                   5MW
        Hauling force 


                                                              Power 
200kN                                                                   4MW

150kN                                                                   3MW
                                   Required hauling force
                                   Available hauling force
100kN                                                                   2MW
                                   Required power
50kN                                                                    1MW
                      Speed 
 0kN                                                               0MW
   0km/h                  50km/h       100km/h      150km/h   200km/h
Power – 70% left?
           IC fast train with DB's 101
300kN        series locomotive and                        Power limit             6MW
                   9 carriages
250kN                                                                              5MW
                                Static friction limit 
        Hauling force 


                                                                         Power 
200kN                                                                              4MW

150kN                                                                              3MW
                                   Required hauling force
                                   Available hauling force
100kN                                                                              2MW
                                   Required power
                                   Available power
50kN                                                                               1MW
                      Speed 
 0kN                                                                          0MW
   0km/h                  50km/h         100km/h           150km/h       200km/h
Not while running uphill!
         IC fast train with DB's 101
300kN     series locomotive and 9                                       6MW
            carriages running up


                                                              Power 
250kN         an 18.5‰ incline
                                                                        5MW
        Hauling force 


                           When it becomes steeper
200kN                       than that the top speed                     4MW
                           cannot be held any more
150kN                                                                   3MW

100kN                                                                   2MW
                                         Required hauling force
50kN                                     Available hauling force
                                                                        1MW
                                         Required power
                                         Available power
 0kN                                                             0MW
   0km/h                  Speed 
                           50km/h   100km/h    150km/h      200km/h
At 300 km/h, however …
300kN                                                    8MW
                         ICE3 high speed railcar
                           of DB's 403 series            7MW
250kN
                             … the demand does           6MW
        F 


200kN                        increase rapidly           5MW

150kN                                                    4MW


                                                   P 
              Required hauling force
                                                         3MW
100kN         Available hauling force
              Required power                             2MW
50kN          Available power
                                                         1MW
                                              v 
 0kN                                                     0MW
   0km/h      100km/h         200km/h       300km/h
The ultimate train concept
330km/h   ICE3 high speed railcar                        0,75m/s²


                                                   a 
300km/h     of DB's 403 series
270km/h                                                  0,60m/s²
240km/h
210km/h                16 out of 32 axles driven         0,45m/s²
180km/h
          v 


                       by a 500 kW motor each
150km/h                     provide optimal
                                                         0,30m/s²
120km/h                    acceleration and
 90km/h                    energy recovery
 60km/h                                                  0,15m/s²
                 Speed
 30km/h          Acceleration
                                       s 
  0km/h                                                0,00m/s²
       0km      5km     10km    15km    20km       25km
The ultimate train concept
330km/h          ICE3 high speed railcar                    0,75m/s²


                                                      a 
300km/h            of DB's 403 series
270km/h                                                     0,60m/s²
240km/h
210km/h                   16 out of 32 axles driven         0,45m/s²
180km/h
           v 


                          by a 500 kW motor each
150km/h                        provide optimal
                                                            0,30m/s²
120km/h                       acceleration and
 90km/h                       energy recovery
 60km/h                                                     0,15m/s²
                   Speed
 30km/h            Acceleration
                                           t 
  0km/h                                                     0,00m/s²
          0s     60s   120s   180s   240s    300s   360s
Also you have to accelerate the train to
the desired travelling speed of 300 km/h
(83.3 m/s) first in order to run that fast
With a 4% supplement for rotating masses and an efficiency
of 87%, measured at the pantograph, this makes about
520 kWh for one single acceleration from 0 to 300 km/h.
With the DB tariff of 9 c/kWh this costs approximately 47 €!
It would be pretty sad to get nothing of this back at all.
Counted with an efficiency of 87% again, you can retrieve
75% during brakage – if all goes well.
                                     2
       m        450,000kg        m
Wkin     * v²             * 83.3         1.56 *109 Nm 1.56GJ   434kWh
       2            2            s
Bad outlook for the diesel
Electric traction turns out to be far superior:
• Power density and dynamic behaviour are outstanding.
• 9% of all electricity consumed by locomotives in Germany
  has been used once before by another locomotive and fed
  back again into the supply system.
• Usually this works only with water (or e. g. copper!) but
  never ever with coal, gas and oil.
• The share will continue to grow, since by and large more
  and more old electric locos without feedback capability are
  being replaced with modern power electronic ones.
• But we will still have to wait for a long time to see a diesel
  engine coming around that, when braking, sucks up fumes
  and converts them back into fresh air and fuel.
Electric power speeds us up!
• For 2009, DB„s department for Energy Cost Management
  gives an average circulation of 347,620 km for each of their
  145 locomotives of the 101 series.
• The average consumption is ≈17 kWh/km (including
  electricity the locomotive has fed into the train for heating
  the carriages and for ancillary supplies).
• This yields an electricity cost of half a million Euros per
  year.
• The purchase price of the 101 series is around 3 million
  Euros.
• So for the power consumption of a locomotive„s 30-year-
  long life you could buy in 5 complete locomotives!
• 9% of energy fed back saves 1.2 million Euros per loco
  during 30 years!
Or let’s have a look at
suburban transportation
The regional train from Aachen to Dortmund
travels about 160 km far, calling 22 times.
Its top speed is 140 km/h.
If it went all through non-stop, it would consume
only 800 kWh for overcoming the friction.
But accelerating 22 times costs 1600 kWh!
So this is 2/3 of the overall energy consumption!
Hence, in theory about 3/4 out of 2/3, say half of the
energy, could be recovered, but unfortunately …
Or let’s have a look at
suburban transportation
… according to DB Regio the real rate of recovery
is only 10% in this business unit!
And now what to do? What’s the deficiency?
Hence DB’s plans for the
coming decades are:
• Increase the share of inverter
  locos from 47% (2009) to 100%:     10% → 20%
• Improve control infrastructure –
  no more odour of hot brakes:       20% → 50%
• Replace all Loco-and-carriage
  trains with railcars:              50% → 60%
• Railcars are lighter and hence use less energy
• The dispersed drive expands the opportunities
  for energy recuperation
Not fragile …
                         Stock of drive vehicles with DB AG
4000

3500
       Number 

                         Drive vehicles with feedback capability
3000                     Tap changer regulated drive vehicles
2500

2000

1500         Tap changer operated vehicles
1000        have no longer been commissioned
 500           already since 1985, but still…
  0
                  2007        2009           2010 Year  2011
If you see a tap-changer
controlled locomotive today
then it is most likely to be 36 years old.

In case of the 110 series, for
instance, this vehicle must be between
42 and 54 years old!

And it still keeps on running …
Old tap-changer vehicles
still on duty with DB AG
                                       Stock            BR         supplied         2007 2009 2010 2011        Age
                                       Locomotives      103     1972 to 1974                3     3     3 37a to 39a
Tap changer regulated drive vehicles


                                         DB Long        113     1962 to 1963        115     2     3     3 48a to 49a
                                         Distance       115     1962 to 1964               28    19    17 47a to 49a
                                                        110     1957 to 1969               109   88    64 42a to 54a
                                                        111     1975 to 1984               225   225   224 27a to 36a
                                       Locomotives       Legacy to 1993
                                                        112   1992 from             1115   89    89    89 18a to 19a
                                        DB Regio
                                                        114 the GDR
                                                              1990 to 1992                 40    39    38 19a to 21a
                                                        143 railways1990
                                                              1984 to                      556   520   487 21a to 27a
                                         Railcars       420     1969 to 1994               189   167   163 17a to 42a
                                                                                    205
                                         DB Regio       450                                 4     4     4
                                       Locomotives      140     1957 to 1973               172   74    81 38a to 54a
                                       DB Schenker      151     1973 to 1975        648    163   140   133 36a to 38a
                                       Rail (freight)   155     1974 to 1984               219   195   185 27a to 37a
                                         Sums                 Locomotives           1877 1606 1395 1324 33a 36a 40a
                                          resp.         Railcars / integr. trains   205    193   171   167 17a 30a 42a
                                       mean values               Total              2082 1799 1566 1491 25a 33a 41a
Now what„s up with
the 44% of lines
without a trolley wire?
• There is a diesel railcar standing at the railway station. There are 2
  engines mumbling under no-load conditions inside it – and are being
  cooled, while an oil heater fuelled with diesel fuel at the price of diesel
  fuel is heating the passenger cabin.
• The railcar starts. The engines raise their voices a little bit.
• Only above some 30 km/h … 60 km/h the full power can be transmitted
  to the rails: Now the engines hum a bit more vigorously – for about one
  minute. Then the top speed has been reached. About 30% of the
  engine rating suffice to sustain a constant speed of 160 km/h.
• But very soon we are approaching the next station. The railcar is kept
  rolling for several minutes, the engines disengage, mumbling calmly.
• Then the railcar brakes. The engines rev up – just to dissipate the
  heat from the hydraulic braking system via the engine radiators!
Is this a concept for the future? – Or rather a makeshift solution?
But wasn‘t there something else?
Oh, right: The 515 series!
• Accumulator-operated railcars
  have been in use since 1907!
• for 40 years, from 1955 to 1995, well over 220
  motor vehicles of the 515 series have been in use:
• Power rating 2*150 kW
• Maximum speed 100 km/h
• 10 t … 16 t of lead accumulators
• Capacity 352 kWh … 602 kWh
• Cruising range 300 km
Mental experiment:
A modern re-issue
• Today„s Li ion accumulators provide 4 times the
  energy density of the old lead acid batteries, so:
• you can double the capacity while halving the
  mass.
• Doubling the capacity doubles the cruising range
  to about 600 km.
• halving the weight along with the use of modern
  inverter technique with generative brakage im-
  prove the performance (min. 140 km/h) and the
  comfort (e. g. air conditioning).
Comparing a hypothetical electric
battery railcar to a street car
                             Tesla    Electric
                           Roadster   railcar
Energy capacity             55 kWh   1100 kWh
Energy demand             200 Wh/km 2000 Wh/km
Energy demand per seat 100 Wh/km     10 Wh/km
cruising range              350 km    600 km
Battery mass                 0.45 t      9t
as share of the vehicle      36%        12%
Battery price              45.000 €  900.000 €
as share of conv. vehicle    50%        25%
How much really is the
electricity from the battery?
Battery price:                900.000 €
Life time:                       3000 cycles
Energy capacity:                 1100 kWh
So in effect the power from the battery costs:
Electricity taken from trolley wire  90 €/MWh
Charge cycle / conversion losses +10 €/MWh
Night tariff rebate                 -10 €/MWh
Wear of the accumulator battery +270 €/MWh
Electricity cost from the battery   360 €/MWh
Comparison to the existing
series 612 diesel railcar
                          Diesel railcar Batt. railcar
Primary energy demand 20 kWh/km <6 kWh/km
Secondary energy demand 17 kWh/km          2 kWh/km
                               (1.7 l/km)
Net energy price                 1.03 €/l 0.09 €/kWh
Energy price from the battery – – – 0.36 €/kWh
Net energy cost               1.80 €/km    0.18 €/km
Energy cost incl. battery         – – –    0.72 €/km
At 250,000 km/a             450,000 €/a 180,000 €/a
During a 30 years„ life    13,500,000 € 5,400,000 €
Comparison to the existing
series 612 diesel railcar
The comparison is biased?
It is, but towards which side?
Note:
• The battery railcar will need at least 2 new
  batteries during its 30-year service life
But:
• Diesel driven trains require 3 times as much
  maintenance costs as electric trains do
So there is scope enough for 2 new batteries!
Alternative 1: Accumulator
railcar with pantograph
Local trains often leave
the city centres on
electrified lines and turn
off onto the seconday
lines only a bit later on.
Here the vehicles could
• be charged up during ride
• in part be driven as conventional electric railcars
   with pantograph (»pop-up hybrid«)
• and thus require only a fraction of the (expensive)
   battery capacity.
Alternative 2:
Hybrid diesel railcars
Do not confuse with the principle of the diesel-
electric locomotive! Since this is an electric locomotive lugging around
its own power plant.
• With the hybrid railcar, however, the diesel engine has only some 10%
  of the electric power (e. g. a 66 kW car engine instead of 2*315 kW
  railway engines).
• For the diesel engine is always running at the optimal point of operation
  (rated speed and power) instead of idling ≈90% of its time.
• Also the generator rating is only 10% that of the electrical traction
  power.
• The battery provides 90% or bears 110%, respectively, of the electrical
  traction power during acceleration and brakage, respectively.
• Continuous heat generation. Combined heat and power generation
  replaces the oil heater.
• Facilitates combination with alternative 1.
Hybrid diesel railcars – also
for long-distance fast trains?
Just take a trip from Berlin to Copenhagen!
There they are using up the unfortunate series 605 now.
• These railcars are equipped with diesel-electric drives, so
  these already avail of electric drive motors and inverters.
• These trains arose on the platform of the 415 series 5-
  carriage electric railcar!
• They had been withdrawn from service for several years.
• They were offered abroad for sale, but nobody wanted
  them.
• One of the reasons given for the latter two points are high
  fuel costs.
So why not convert these trains first?
Series 605 – ICE without pantograph
Just consider:
• Here the train does not run very fast and rarely stops.
• Still the fuel consumption lies around 3 l/km!
• This costs around 1800 € per single trip.
• For this alone 7 full-charge or 45 low-cost ticket passengers
  will have to be sitting on the total of 195 seats.
• Whereas the major share of the easement is electrified!
• And for one hour the train is not travelling at all but is
  standing on a ship.
So why not
• remove 3 of the 4 diesel engines and generators,
• replace them with accumulator batteries,
• possibly add a pantograph and a transformer
• but in any case reduce the fuel consumption by 1 l/km
• and save about 600 € of fuel cost on one trip?
Summary and conclusions
• Electric railway drives clearly outperform diesel
  engines.
• At the same time electric railway drives are way more energy efficient
  than diesel traction is.
• SBB operate 100% electrically – nothing left to do.
• E. g. DSB are 27% electrified – need for action!
• DB AG operate 85% electrically – this is fine so far.
• For the remaining 15% a re-introduction of battery operated railcars
  based on modern lithium ion cells should be considered. 40 years of
  good experinece even with lead acid accumulators support this idea.
• The economic viability of electric cars lies about 10 times further
  away from reality than that of the battery operated railway vehicle!
  The German Department of Technology and the EU Commission
  should urgently take this into consideration with their energy efficiency
  support programmes.

How energy efficient really is railway transportation?

  • 1.
    How energy efficientreally is railway transportation? Stefan Fassbinder Deutsches Kupferinstitut Am Bonneshof 5 D-40474 Düsseldorf Tel.: +49 211 4796-323 Fax: +49 211 4796-310 sfassbinder@kupferinstitut.de stf@eurocopper.org www.kupferinstitut.de www.leonardo-energy.org
  • 2.
    The German CopperInstitute, DKI, is the central information and advisory service dealing with all uses of copper and copper alloys. We offer our services to:  Commercial companies We can be contacted by:  The skilled trades  post  Industry  phone  R & D institutes  fax  Universities  e-mail  Artists and craftsmen  internet  Students  online database, or  Private individuals  personally
  • 3.
    Does electricity boostmobility? Electric cars are • technically not feasible for long distances, • economically not viable for short distances. To charge up a laptop PC • costs 1 cent for electricity from the socket. • The battery costs 90 € and survives 1000 duty cycles. • This means: 10 times higher energy price while battery powered! With big units for vehicles the factor still is around 3. The »tank« of an electric car • costs 3000 €/l, converted to energy equivalent diesel • weighs 30 kg/l } fuel quantity (ηD = 30%, ηE = 90%) • and is over and done with after 1000 … 3000 fillings.
  • 4.
    But still thetrade press wanted it yet another time: »Market introduction of electric cars to start in 2011«
  • 5.
    Comparison: Citroën C-Zero Citroën C1 (electric) (petrol engine) Length 3480 mm 3430 mm Width 1475 mm 1630 mm At least one thing is Height 1792 mm 1470 mm certain: Empty mass 1195 kg 925 kg Payload 255 kg 265 kg  These vehicles are Luggage volume 166 l 139 l really comparable. Turning circle 9.0 m 9.5 m  This is a real electric Drive back front car in its own right! Gears (forward) 1 5  Only the payback – Power rating 49 kW 50 kW even without fuel tax Top speed 130 km/h 157 km/h – takes 469,000 km! Acceleration 15.9 s 13.7 s Cruising range 150 km 760 km  This corresponds to CO2 emissions 100 g/km 107 g/km 3,000 charging Energy costs 2.20 €/100 km 6.90 €/100 km cycles – the end of Purchase price 35,165 € 13,120 € the battery lifetime…
  • 6.
    Electricity does boostmobility! If only there is a way to bring the power into the vehicle Electric motors • have their highest torque at standstill: No disengaging, no gearchange, no torque converter required, • provide a considerable short-term overload capability: Higher acceleration than the power rating would let you suppose, • do not have any no-load consumption during standstill, rolling or braking, • offer the opportunity to feed back energy during braking (motor = generator), • and their primary fuel is totally flexible (fossil, nuclear, hydro, wind – just mix as you like!).
  • 7.
    So it isnot a miracle if railway companies prefer electric traction! Characteristic data of 16.7 Hz railways Electricity system of DB AG in D-A-CH Installed Energy Type of power plant DB AG ÖBB SBB capacity production Vapour 42.2% 66.0% Employees 240242 42893 27822 Hydro 11.0% 10.0% Passengers 1919Mio. 200Mio. 332Mio. Railway grid Rotating convertor 34.3% 14.6% total 33862km 11000km 3011km Electronic convertor 11.9% 9.4% electrified 19300km 8200km 3011km share Total 3.2GW 11.0TWh/a of lines 57% 75% 100% Sum of all electric vehicles 22.4GW (700%) of transport 85% 100% volume 56% of DB lines are … since the energy electrified. These 56% carry “consumption” of an electric 85% of all traffic. locomotive can be negative! However …
  • 8.
    …what about theother 15%? e. g. the 612 series? • Engine power rating: 2*560 kW = 1120 kW • Smart and convenient: Tilting technique, air conditioning • Maximum permissible speed: 160 km/h • Fuel consumption: 1.7 l/km (for one, not 100 km!)
  • 9.
    What about diesellocomotives? • On a series 232 diesel locomotive (6 axles, 120 t, 2,200 kW, max. 120 km/h) at a constant speed of 120 km/h a consumption of 3 l/km was measured. • (for good resons railway companies reference the fuel consumptions to one kilometre, not to 100 kilometres!) • There have not been any new diesel locomotives for decades. • There are old diesel locomotives with new engines. •BR 232 “Ludmila” is then >40%. The engine efficiency BR 220 “Taiga Drum” • But what„s the use of this if the engine is idling for >90% of its operating time? • And if a DB technician explains: “Diesel locomotives hamper the traffic when circulating on an electrified line!” … • …and if a railway trade journal reports the electrification of a line no longer than 22 km had already cut the circulation time by 5 minutes? „Elektrischer Betrieb bei der Deutschen Bahn im Jahre 2009“. „eb“ Elektrische Bahnen & Verkehrssysteme 1-2/2010, p.19
  • 10.
    However, the 101series electric loco (4 axles, 84 t, 220 km/h) provides a motor power rating of 6,600 kW! Note: It„s electricity that wakes trains up!
  • 11.
    This explains it: 800kW/t Inverse trends! 600kW/t Power density of reciprocating combustion engines Power density → 400kW/t Power density per size of respective electric motors 200kW/t Power rating → 0kW/t 1kW 10kW 100kW 1000kW 10000kW 100000kW
  • 12.
    The parameters responsiblefor the energy demand are (at ≈200 km/h): of a car of a train factor (4…5 seats)(450 seats) 100 Mass 1.5 t 450 t 300 Coefficient of staticare a means of mass transportation! 0.3 Note: Trains friction ≈1 0.28…0.35 Coefficient of rolling friction ≈2% <2‰! 0.1 Resulting: some good reasons railwaykN Note: For Rolling friction force 0.3 companies give rolling 9 kN 30 Power demand resulting from as per kW figures! friction coefficients this 15 mille 450 kW 30 as a share of power rating 15% 7% 0.5 Air friction force 1.5 kN 30 kN 20 Power demand resulting from this 85 kW 1550 kW 18 as a share of power rating 85% 23% 0.27 Total power demand 100 kW 2000 kW 20 as a share of power rating 100% 30%! 3.3
  • 13.
    Now what arethe other 70% of power good for? Compared to a car, a train has: - A very great mass. - Significantly less static friction (steel on steel rather than rubber on asphalt). + Significantly less rolling friction (steel on steel rather than rubber on asphalt). + Significantly less air friction (since the train travels “in its own windshade”, so to say).
  • 14.
    On rails evena »Unimog« universal miniature lorry can haul 1000 t! Though not at a particularly high speed
  • 15.
    Worth noting: The topspeed of a car is usually of a railway vehicle the highest is usually the possible highest speed, limited by permissible the available speed. engine power.
  • 16.
    With a greatdeal of good will 66kW 6,6MW we will now requirement car anda train Power let a car with IC •55kW kW engine and (very tight) space for 66 P (car)  5,5MW P (IC train)  •44kW 4 passengers travel at 4,4MW •33kW km/h, P (car) 200 3,3MW P (IC train) while a train with a drive power rating of 22kW 2,2MW • 6,600 kW offers plenty of space to •11kW passengers (including toilets, a 400 1,1MW bistro, …). At a travelling speed of 0,0MW 0kW v  • 200 km/h50km/h requires: 150km/h 200km/h 0km/h this 100km/h
  • 17.
    But a caraccelerates faster? 100% 90% v/vmax  80% 70% Well, initially process the Acceleration yes, but train has a lot of reserves! car and train (0 … 200 km/h) 60% 50% 40% Car acceleration v/vmax 30% IC train (10 carriages) v/vmax 20% 10% 0% 0km 1km 2km 3km 4km 5km s  6km 7km 8km
  • 18.
    Quiz question 1: Howfar will an ICE2 express train of the 402 series continue to roll unbraked in a flat area when suddenly the power fails at a speed of 230 km/h? Answer 1: The test was not carried out all through to the end. After 32 km the train was still rolling at 120 km/h!
  • 19.
    Quiz question 2: Howfast will a railway carriage become when you let it roll down a decline of 5‰ (just 0.5%!)? Answer 2: Note: For some good reasons railway companies give inclines and declines According to technical documents by as per mille Bahn AG Deutsche figures! it will (finally) reach a speed of 44 m/s ≈ 160 km/h (after 1 hour of rolling)! A street car would simply just stall and not roll at all!
  • 20.
    Quiz question 3: Whyis it that in a train repair hall which can be opened at both ends it is not allowed to leave both gates open at the same time? Answer 3: Because the wind might blow the locomotoves out of the hall!
  • 21.
    So let’s justaccelerate a 200km/h fully occupied street car v  to 200 km/h, disengage 150km/h and see what will happen… 100km/h Mass: Train rolls kg 2000 Train rolls Train brakes Car rolling out Rolling friction coefficient: Car rolling out 50km/h 2% Car rolling out Front surface area: 2 m² cx value: 0km/h 0.37 2km s  Engine power: 1km 0km 105 kW 3km
  • 22.
    Adapting the scaleto the train: 200km/h Rolling and braking: v  Express train (10 carriages) versus car 150km/h 100km/h Train rolls Train brakes Car rolling out 50km/h s  0km/h 0km 5km 10km 15km 20km 25km
  • 23.
    Adapting the scaleto the train: 200km/h Rolling and braking: v  Express train (10 carriages) versus car 150km/h 100km/h Train rolls Train brakes Car rolling out 50km/h t  0km/h 0s 120s 240s 360s 480s 600s
  • 24.
    Hauling force andpower IC fast train with DB's 101 300kN series locomotive and 6MW 9 carriages 250kN 5MW Hauling force  Power  200kN 4MW 150kN 3MW Required hauling force Required power 100kN 2MW 50kN 1MW Speed  0kN 0MW 0km/h 50km/h 100km/h 150km/h 200km/h
  • 25.
    Hauling force –80% left? IC fast train with DB's 101 300kN series locomotive and 6MW 9 carriages 250kN 5MW Hauling force  Power  200kN 4MW 150kN 3MW Required hauling force Available hauling force 100kN 2MW Required power 50kN 1MW Speed  0kN 0MW 0km/h 50km/h 100km/h 150km/h 200km/h
  • 26.
    Power – 70%left? IC fast train with DB's 101 300kN series locomotive and Power limit 6MW 9 carriages 250kN 5MW Static friction limit  Hauling force  Power  200kN 4MW 150kN 3MW Required hauling force Available hauling force 100kN 2MW Required power Available power 50kN 1MW Speed  0kN 0MW 0km/h 50km/h 100km/h 150km/h 200km/h
  • 27.
    Not while runninguphill! IC fast train with DB's 101 300kN series locomotive and 9 6MW carriages running up Power  250kN an 18.5‰ incline 5MW Hauling force  When it becomes steeper 200kN than that the top speed 4MW cannot be held any more 150kN 3MW 100kN 2MW Required hauling force 50kN Available hauling force 1MW Required power Available power 0kN 0MW 0km/h Speed  50km/h 100km/h 150km/h 200km/h
  • 28.
    At 300 km/h,however … 300kN 8MW ICE3 high speed railcar of DB's 403 series 7MW 250kN … the demand does 6MW F  200kN increase rapidly  5MW 150kN 4MW P  Required hauling force 3MW 100kN Available hauling force Required power 2MW 50kN Available power 1MW v  0kN 0MW 0km/h 100km/h 200km/h 300km/h
  • 29.
    The ultimate trainconcept 330km/h ICE3 high speed railcar 0,75m/s² a  300km/h of DB's 403 series 270km/h 0,60m/s² 240km/h 210km/h 16 out of 32 axles driven 0,45m/s² 180km/h v  by a 500 kW motor each 150km/h provide optimal 0,30m/s² 120km/h acceleration and 90km/h energy recovery 60km/h 0,15m/s² Speed 30km/h Acceleration s  0km/h 0,00m/s² 0km 5km 10km 15km 20km 25km
  • 30.
    The ultimate trainconcept 330km/h ICE3 high speed railcar 0,75m/s² a  300km/h of DB's 403 series 270km/h 0,60m/s² 240km/h 210km/h 16 out of 32 axles driven 0,45m/s² 180km/h v  by a 500 kW motor each 150km/h provide optimal 0,30m/s² 120km/h acceleration and 90km/h energy recovery 60km/h 0,15m/s² Speed 30km/h Acceleration t  0km/h 0,00m/s² 0s 60s 120s 180s 240s 300s 360s
  • 31.
    Also you haveto accelerate the train to the desired travelling speed of 300 km/h (83.3 m/s) first in order to run that fast With a 4% supplement for rotating masses and an efficiency of 87%, measured at the pantograph, this makes about 520 kWh for one single acceleration from 0 to 300 km/h. With the DB tariff of 9 c/kWh this costs approximately 47 €! It would be pretty sad to get nothing of this back at all. Counted with an efficiency of 87% again, you can retrieve 75% during brakage – if all goes well. 2 m 450,000kg m Wkin * v² * 83.3 1.56 *109 Nm 1.56GJ 434kWh 2 2 s
  • 32.
    Bad outlook forthe diesel Electric traction turns out to be far superior: • Power density and dynamic behaviour are outstanding. • 9% of all electricity consumed by locomotives in Germany has been used once before by another locomotive and fed back again into the supply system. • Usually this works only with water (or e. g. copper!) but never ever with coal, gas and oil. • The share will continue to grow, since by and large more and more old electric locos without feedback capability are being replaced with modern power electronic ones. • But we will still have to wait for a long time to see a diesel engine coming around that, when braking, sucks up fumes and converts them back into fresh air and fuel.
  • 33.
    Electric power speedsus up! • For 2009, DB„s department for Energy Cost Management gives an average circulation of 347,620 km for each of their 145 locomotives of the 101 series. • The average consumption is ≈17 kWh/km (including electricity the locomotive has fed into the train for heating the carriages and for ancillary supplies). • This yields an electricity cost of half a million Euros per year. • The purchase price of the 101 series is around 3 million Euros. • So for the power consumption of a locomotive„s 30-year- long life you could buy in 5 complete locomotives! • 9% of energy fed back saves 1.2 million Euros per loco during 30 years!
  • 34.
    Or let’s havea look at suburban transportation The regional train from Aachen to Dortmund travels about 160 km far, calling 22 times. Its top speed is 140 km/h. If it went all through non-stop, it would consume only 800 kWh for overcoming the friction. But accelerating 22 times costs 1600 kWh! So this is 2/3 of the overall energy consumption! Hence, in theory about 3/4 out of 2/3, say half of the energy, could be recovered, but unfortunately …
  • 35.
    Or let’s havea look at suburban transportation … according to DB Regio the real rate of recovery is only 10% in this business unit! And now what to do? What’s the deficiency?
  • 36.
    Hence DB’s plansfor the coming decades are: • Increase the share of inverter locos from 47% (2009) to 100%: 10% → 20% • Improve control infrastructure – no more odour of hot brakes: 20% → 50% • Replace all Loco-and-carriage trains with railcars: 50% → 60% • Railcars are lighter and hence use less energy • The dispersed drive expands the opportunities for energy recuperation
  • 37.
    Not fragile … Stock of drive vehicles with DB AG 4000 3500 Number  Drive vehicles with feedback capability 3000 Tap changer regulated drive vehicles 2500 2000 1500 Tap changer operated vehicles 1000 have no longer been commissioned 500 already since 1985, but still… 0 2007 2009 2010 Year  2011
  • 38.
    If you seea tap-changer controlled locomotive today then it is most likely to be 36 years old. In case of the 110 series, for instance, this vehicle must be between 42 and 54 years old! And it still keeps on running …
  • 39.
    Old tap-changer vehicles stillon duty with DB AG Stock BR supplied 2007 2009 2010 2011 Age Locomotives 103 1972 to 1974 3 3 3 37a to 39a Tap changer regulated drive vehicles DB Long 113 1962 to 1963 115 2 3 3 48a to 49a Distance 115 1962 to 1964 28 19 17 47a to 49a 110 1957 to 1969 109 88 64 42a to 54a 111 1975 to 1984 225 225 224 27a to 36a Locomotives Legacy to 1993 112 1992 from 1115 89 89 89 18a to 19a DB Regio 114 the GDR 1990 to 1992 40 39 38 19a to 21a 143 railways1990 1984 to 556 520 487 21a to 27a Railcars 420 1969 to 1994 189 167 163 17a to 42a 205 DB Regio 450 4 4 4 Locomotives 140 1957 to 1973 172 74 81 38a to 54a DB Schenker 151 1973 to 1975 648 163 140 133 36a to 38a Rail (freight) 155 1974 to 1984 219 195 185 27a to 37a Sums Locomotives 1877 1606 1395 1324 33a 36a 40a resp. Railcars / integr. trains 205 193 171 167 17a 30a 42a mean values Total 2082 1799 1566 1491 25a 33a 41a
  • 40.
    Now what„s upwith the 44% of lines without a trolley wire? • There is a diesel railcar standing at the railway station. There are 2 engines mumbling under no-load conditions inside it – and are being cooled, while an oil heater fuelled with diesel fuel at the price of diesel fuel is heating the passenger cabin. • The railcar starts. The engines raise their voices a little bit. • Only above some 30 km/h … 60 km/h the full power can be transmitted to the rails: Now the engines hum a bit more vigorously – for about one minute. Then the top speed has been reached. About 30% of the engine rating suffice to sustain a constant speed of 160 km/h. • But very soon we are approaching the next station. The railcar is kept rolling for several minutes, the engines disengage, mumbling calmly. • Then the railcar brakes. The engines rev up – just to dissipate the heat from the hydraulic braking system via the engine radiators! Is this a concept for the future? – Or rather a makeshift solution?
  • 41.
    But wasn‘t theresomething else? Oh, right: The 515 series! • Accumulator-operated railcars have been in use since 1907! • for 40 years, from 1955 to 1995, well over 220 motor vehicles of the 515 series have been in use: • Power rating 2*150 kW • Maximum speed 100 km/h • 10 t … 16 t of lead accumulators • Capacity 352 kWh … 602 kWh • Cruising range 300 km
  • 42.
    Mental experiment: A modernre-issue • Today„s Li ion accumulators provide 4 times the energy density of the old lead acid batteries, so: • you can double the capacity while halving the mass. • Doubling the capacity doubles the cruising range to about 600 km. • halving the weight along with the use of modern inverter technique with generative brakage im- prove the performance (min. 140 km/h) and the comfort (e. g. air conditioning).
  • 43.
    Comparing a hypotheticalelectric battery railcar to a street car Tesla Electric Roadster railcar Energy capacity 55 kWh 1100 kWh Energy demand 200 Wh/km 2000 Wh/km Energy demand per seat 100 Wh/km 10 Wh/km cruising range 350 km 600 km Battery mass 0.45 t 9t as share of the vehicle 36% 12% Battery price 45.000 € 900.000 € as share of conv. vehicle 50% 25%
  • 44.
    How much reallyis the electricity from the battery? Battery price: 900.000 € Life time: 3000 cycles Energy capacity: 1100 kWh So in effect the power from the battery costs: Electricity taken from trolley wire 90 €/MWh Charge cycle / conversion losses +10 €/MWh Night tariff rebate -10 €/MWh Wear of the accumulator battery +270 €/MWh Electricity cost from the battery 360 €/MWh
  • 45.
    Comparison to theexisting series 612 diesel railcar Diesel railcar Batt. railcar Primary energy demand 20 kWh/km <6 kWh/km Secondary energy demand 17 kWh/km 2 kWh/km (1.7 l/km) Net energy price 1.03 €/l 0.09 €/kWh Energy price from the battery – – – 0.36 €/kWh Net energy cost 1.80 €/km 0.18 €/km Energy cost incl. battery – – – 0.72 €/km At 250,000 km/a 450,000 €/a 180,000 €/a During a 30 years„ life 13,500,000 € 5,400,000 €
  • 46.
    Comparison to theexisting series 612 diesel railcar The comparison is biased? It is, but towards which side? Note: • The battery railcar will need at least 2 new batteries during its 30-year service life But: • Diesel driven trains require 3 times as much maintenance costs as electric trains do So there is scope enough for 2 new batteries!
  • 47.
    Alternative 1: Accumulator railcarwith pantograph Local trains often leave the city centres on electrified lines and turn off onto the seconday lines only a bit later on. Here the vehicles could • be charged up during ride • in part be driven as conventional electric railcars with pantograph (»pop-up hybrid«) • and thus require only a fraction of the (expensive) battery capacity.
  • 48.
    Alternative 2: Hybrid dieselrailcars Do not confuse with the principle of the diesel- electric locomotive! Since this is an electric locomotive lugging around its own power plant. • With the hybrid railcar, however, the diesel engine has only some 10% of the electric power (e. g. a 66 kW car engine instead of 2*315 kW railway engines). • For the diesel engine is always running at the optimal point of operation (rated speed and power) instead of idling ≈90% of its time. • Also the generator rating is only 10% that of the electrical traction power. • The battery provides 90% or bears 110%, respectively, of the electrical traction power during acceleration and brakage, respectively. • Continuous heat generation. Combined heat and power generation replaces the oil heater. • Facilitates combination with alternative 1.
  • 49.
    Hybrid diesel railcars– also for long-distance fast trains? Just take a trip from Berlin to Copenhagen! There they are using up the unfortunate series 605 now. • These railcars are equipped with diesel-electric drives, so these already avail of electric drive motors and inverters. • These trains arose on the platform of the 415 series 5- carriage electric railcar! • They had been withdrawn from service for several years. • They were offered abroad for sale, but nobody wanted them. • One of the reasons given for the latter two points are high fuel costs. So why not convert these trains first?
  • 50.
    Series 605 –ICE without pantograph Just consider: • Here the train does not run very fast and rarely stops. • Still the fuel consumption lies around 3 l/km! • This costs around 1800 € per single trip. • For this alone 7 full-charge or 45 low-cost ticket passengers will have to be sitting on the total of 195 seats. • Whereas the major share of the easement is electrified! • And for one hour the train is not travelling at all but is standing on a ship. So why not • remove 3 of the 4 diesel engines and generators, • replace them with accumulator batteries, • possibly add a pantograph and a transformer • but in any case reduce the fuel consumption by 1 l/km • and save about 600 € of fuel cost on one trip?
  • 51.
    Summary and conclusions •Electric railway drives clearly outperform diesel engines. • At the same time electric railway drives are way more energy efficient than diesel traction is. • SBB operate 100% electrically – nothing left to do. • E. g. DSB are 27% electrified – need for action! • DB AG operate 85% electrically – this is fine so far. • For the remaining 15% a re-introduction of battery operated railcars based on modern lithium ion cells should be considered. 40 years of good experinece even with lead acid accumulators support this idea. • The economic viability of electric cars lies about 10 times further away from reality than that of the battery operated railway vehicle! The German Department of Technology and the EU Commission should urgently take this into consideration with their energy efficiency support programmes.