Download to read offline
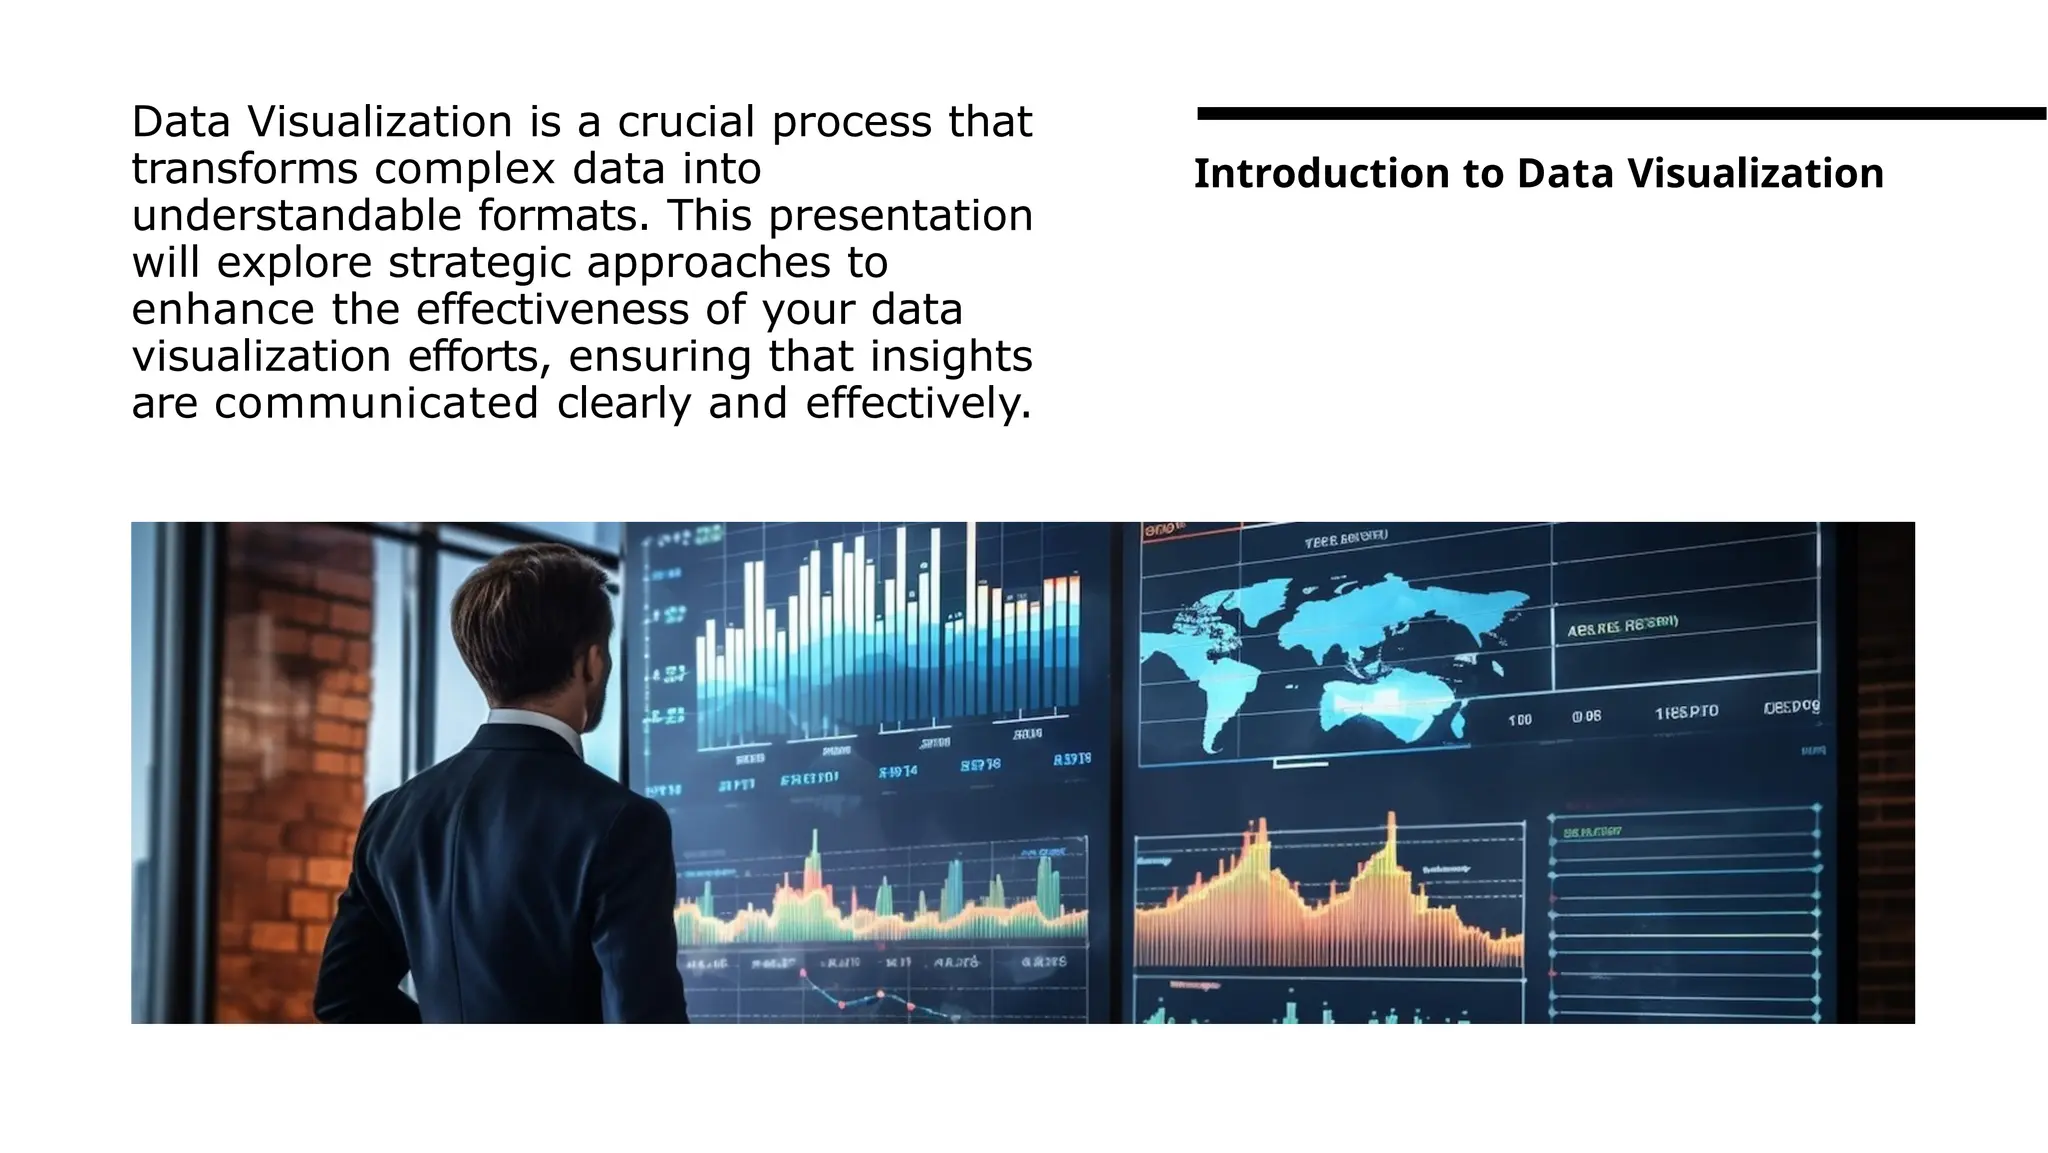


The document outlines essential strategies for effective data visualization, emphasizing the importance of understanding the audience's needs and preferences. It highlights the significance of selecting suitable tools, adhering to design principles for clarity, and utilizing an iterative feedback process for continuous improvement. By applying these approaches, individuals can enhance their data visualization efforts to communicate insights more effectively.