Download to read offline
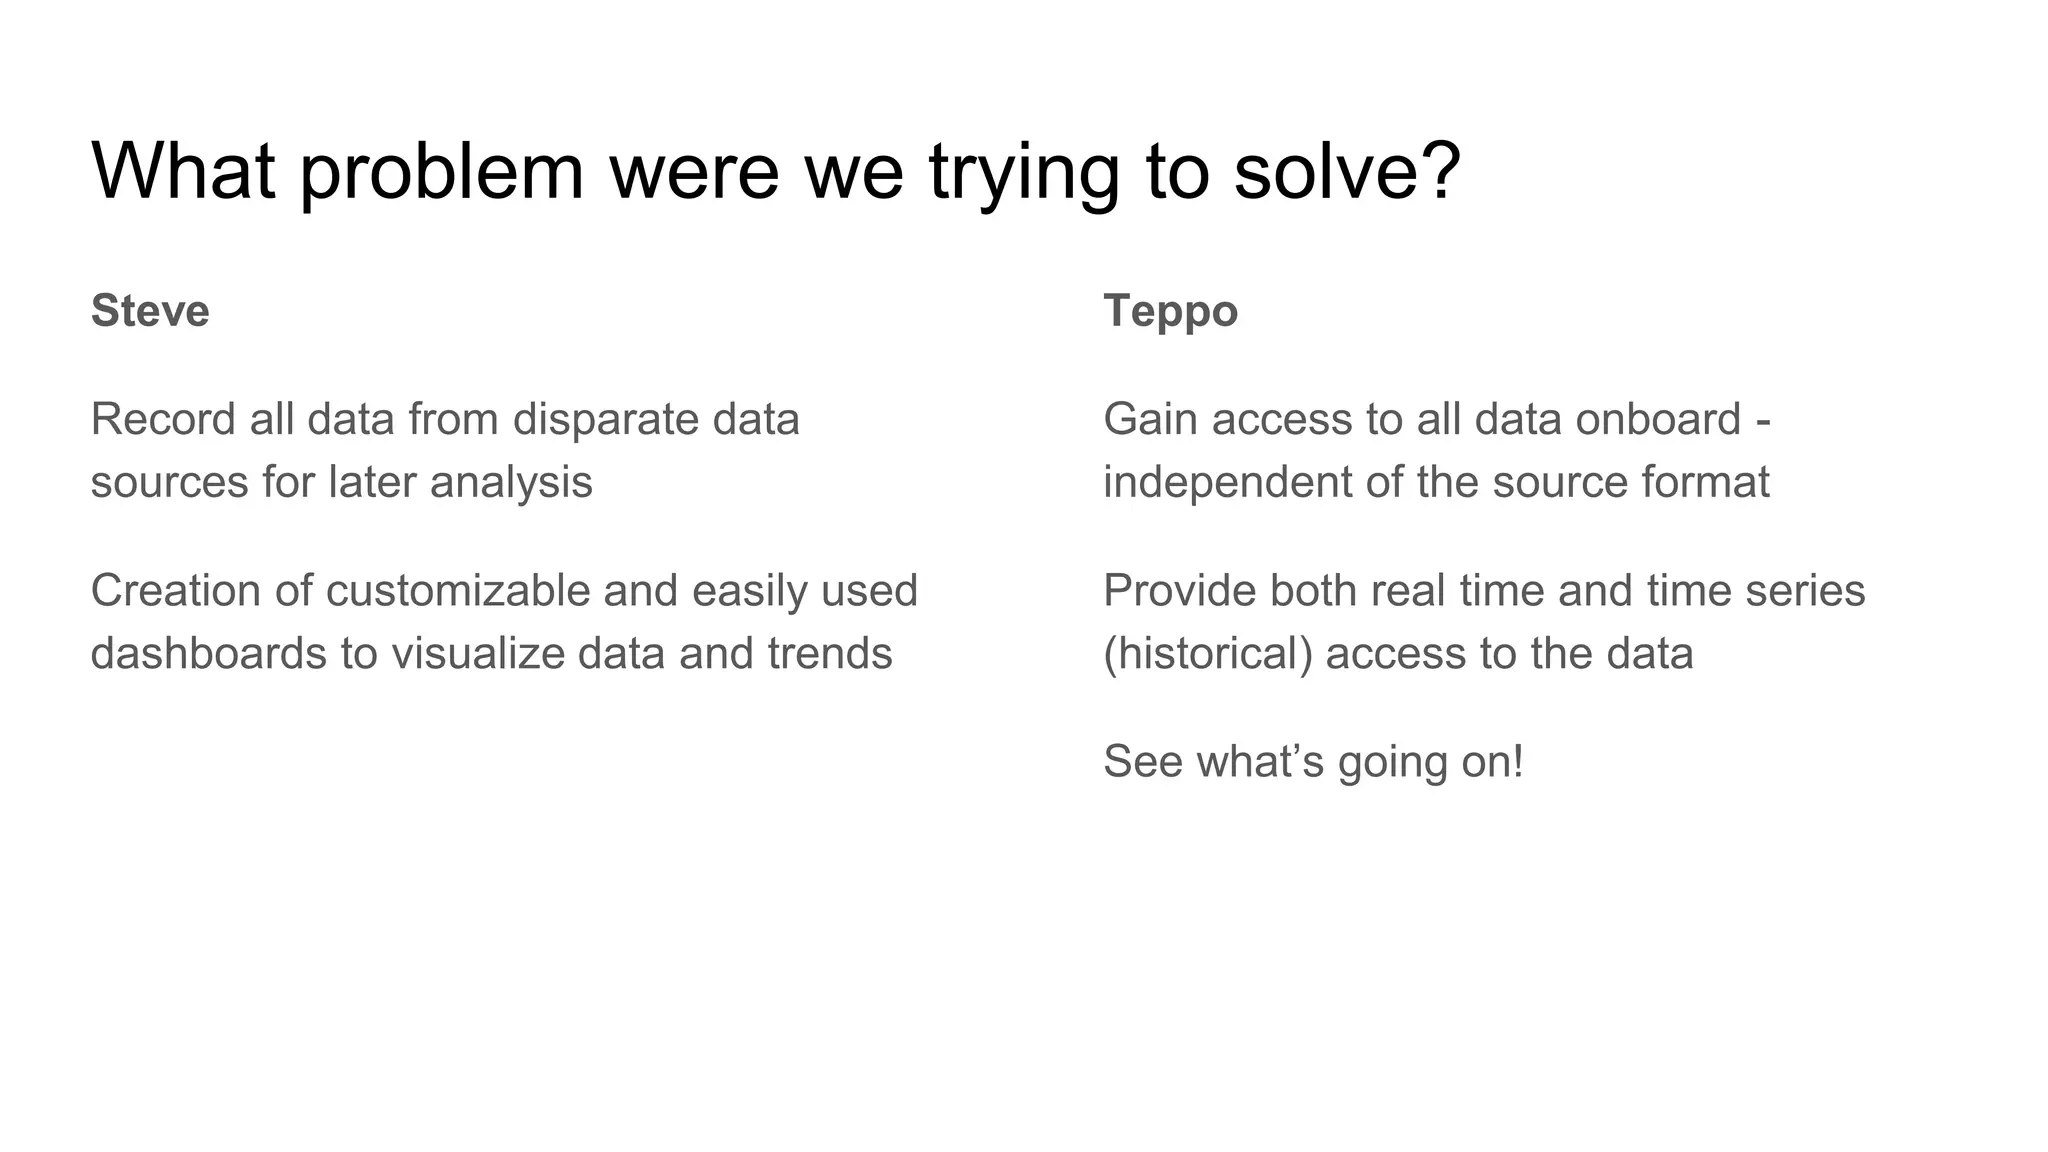

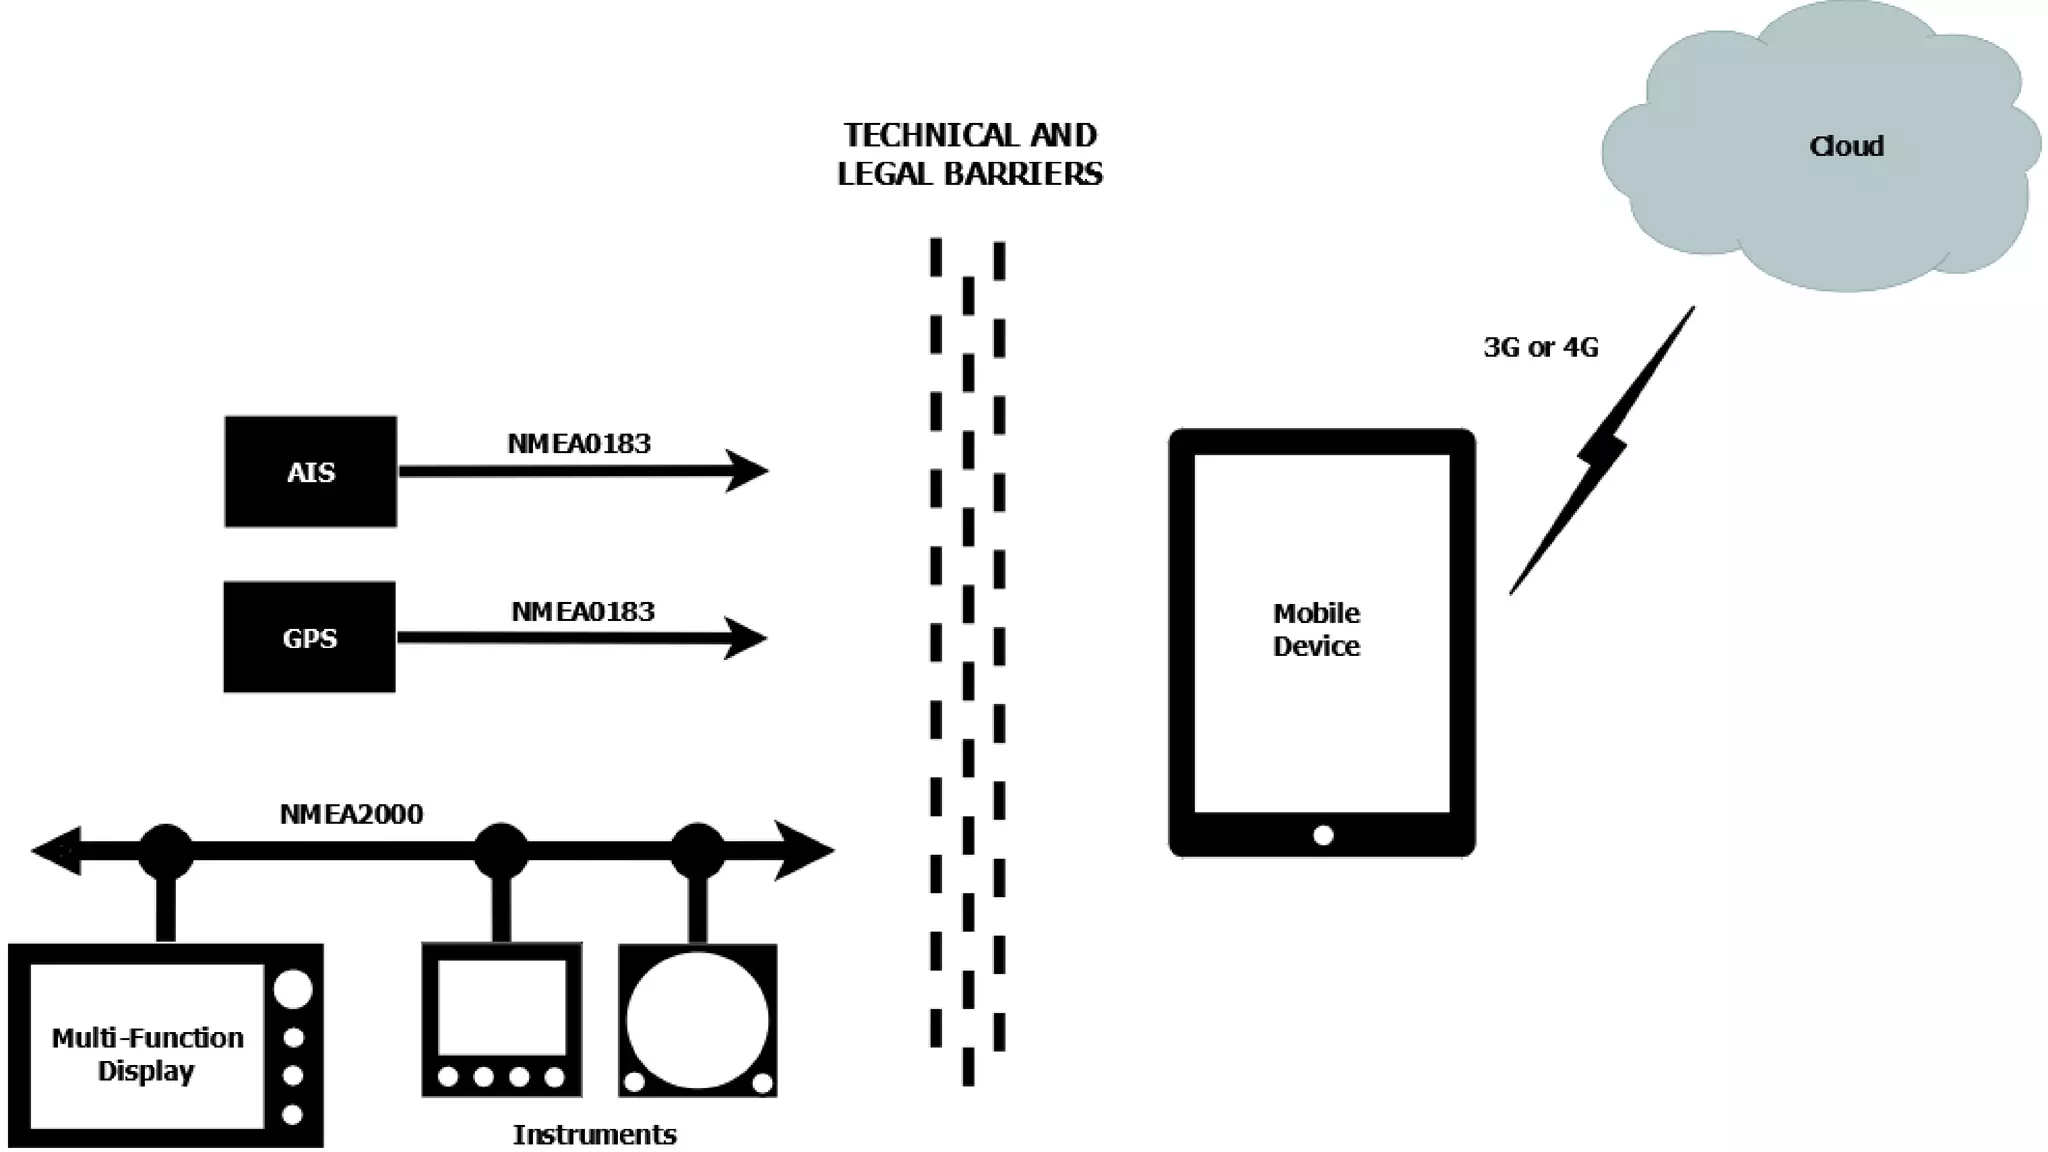
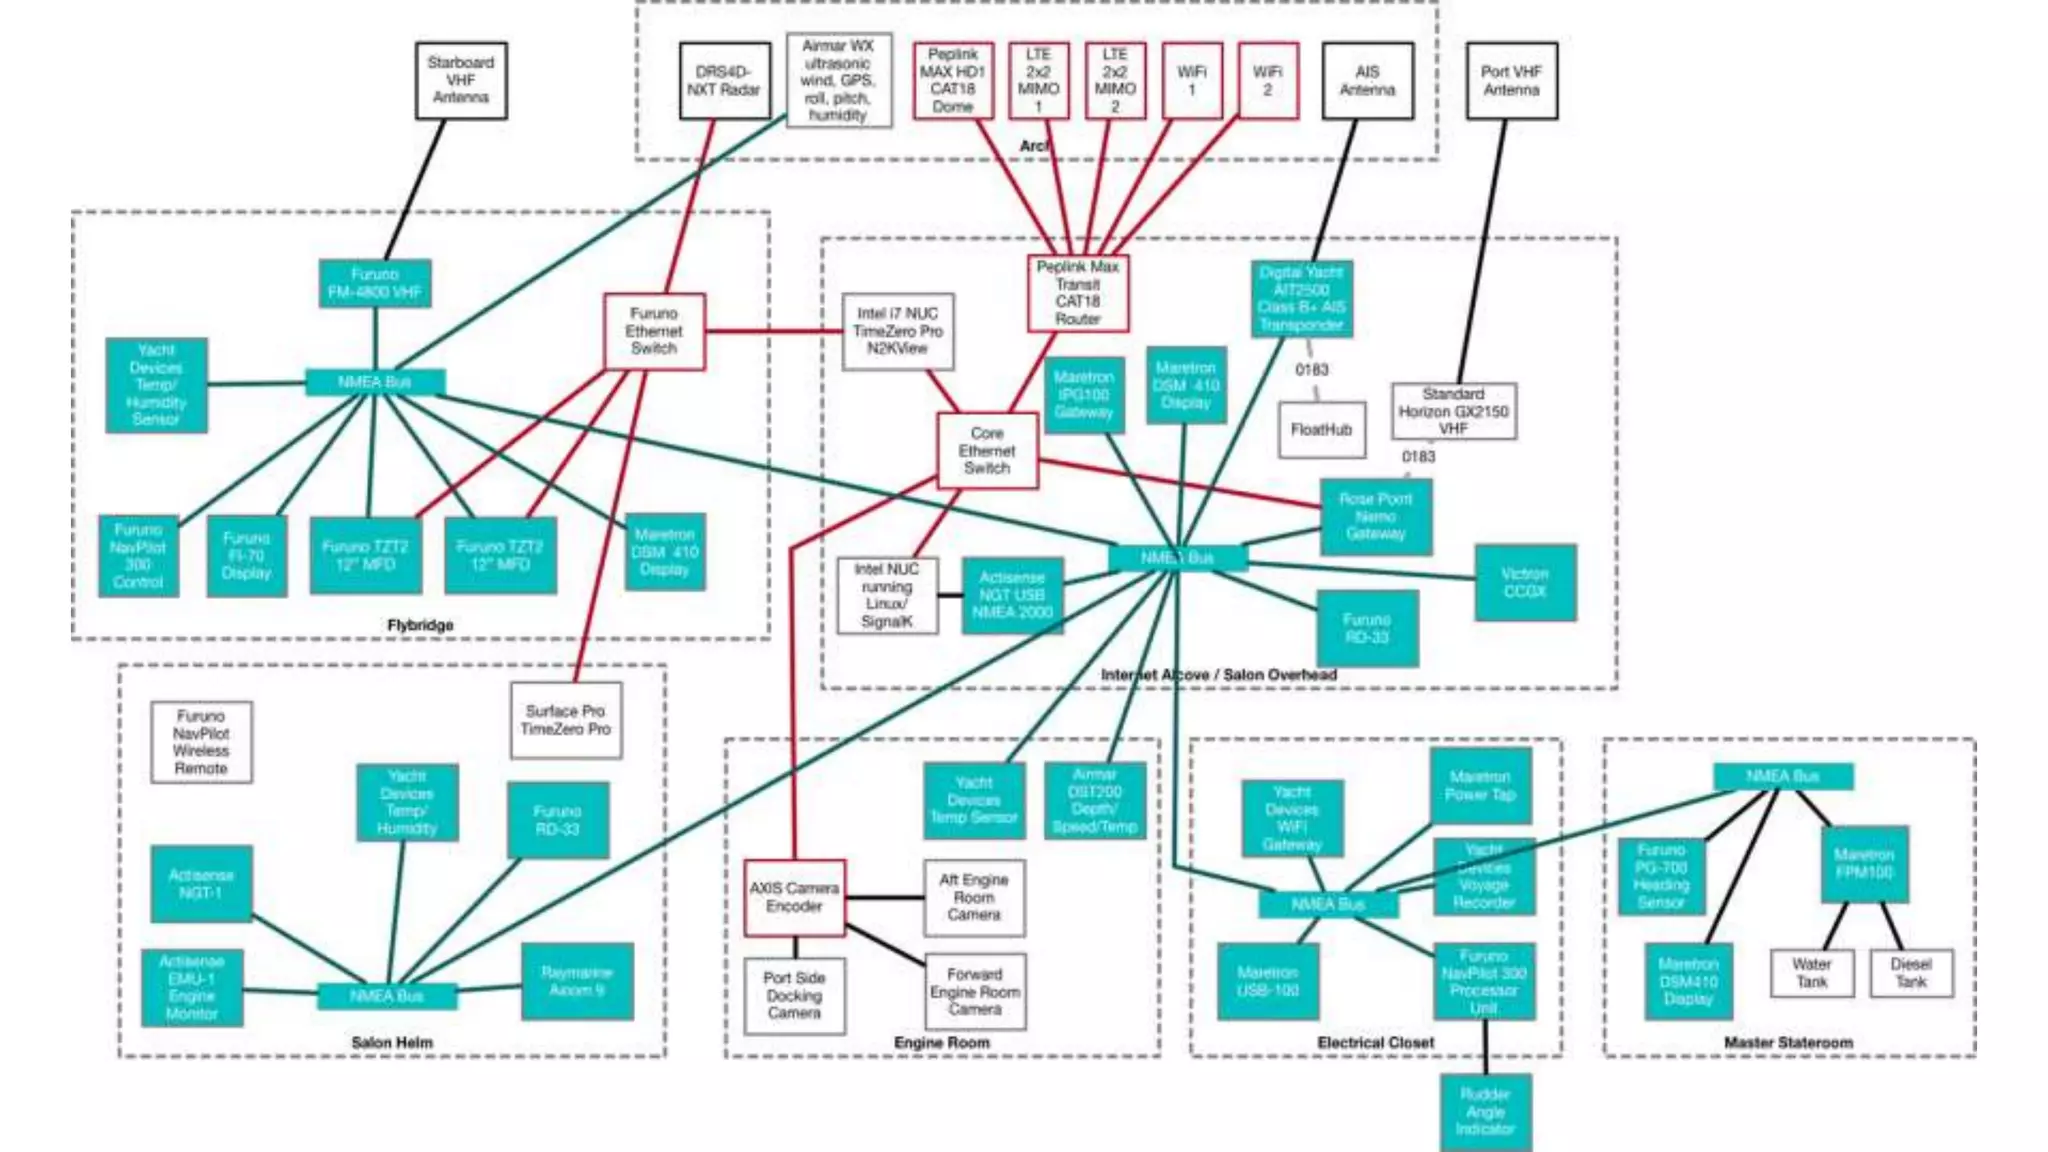
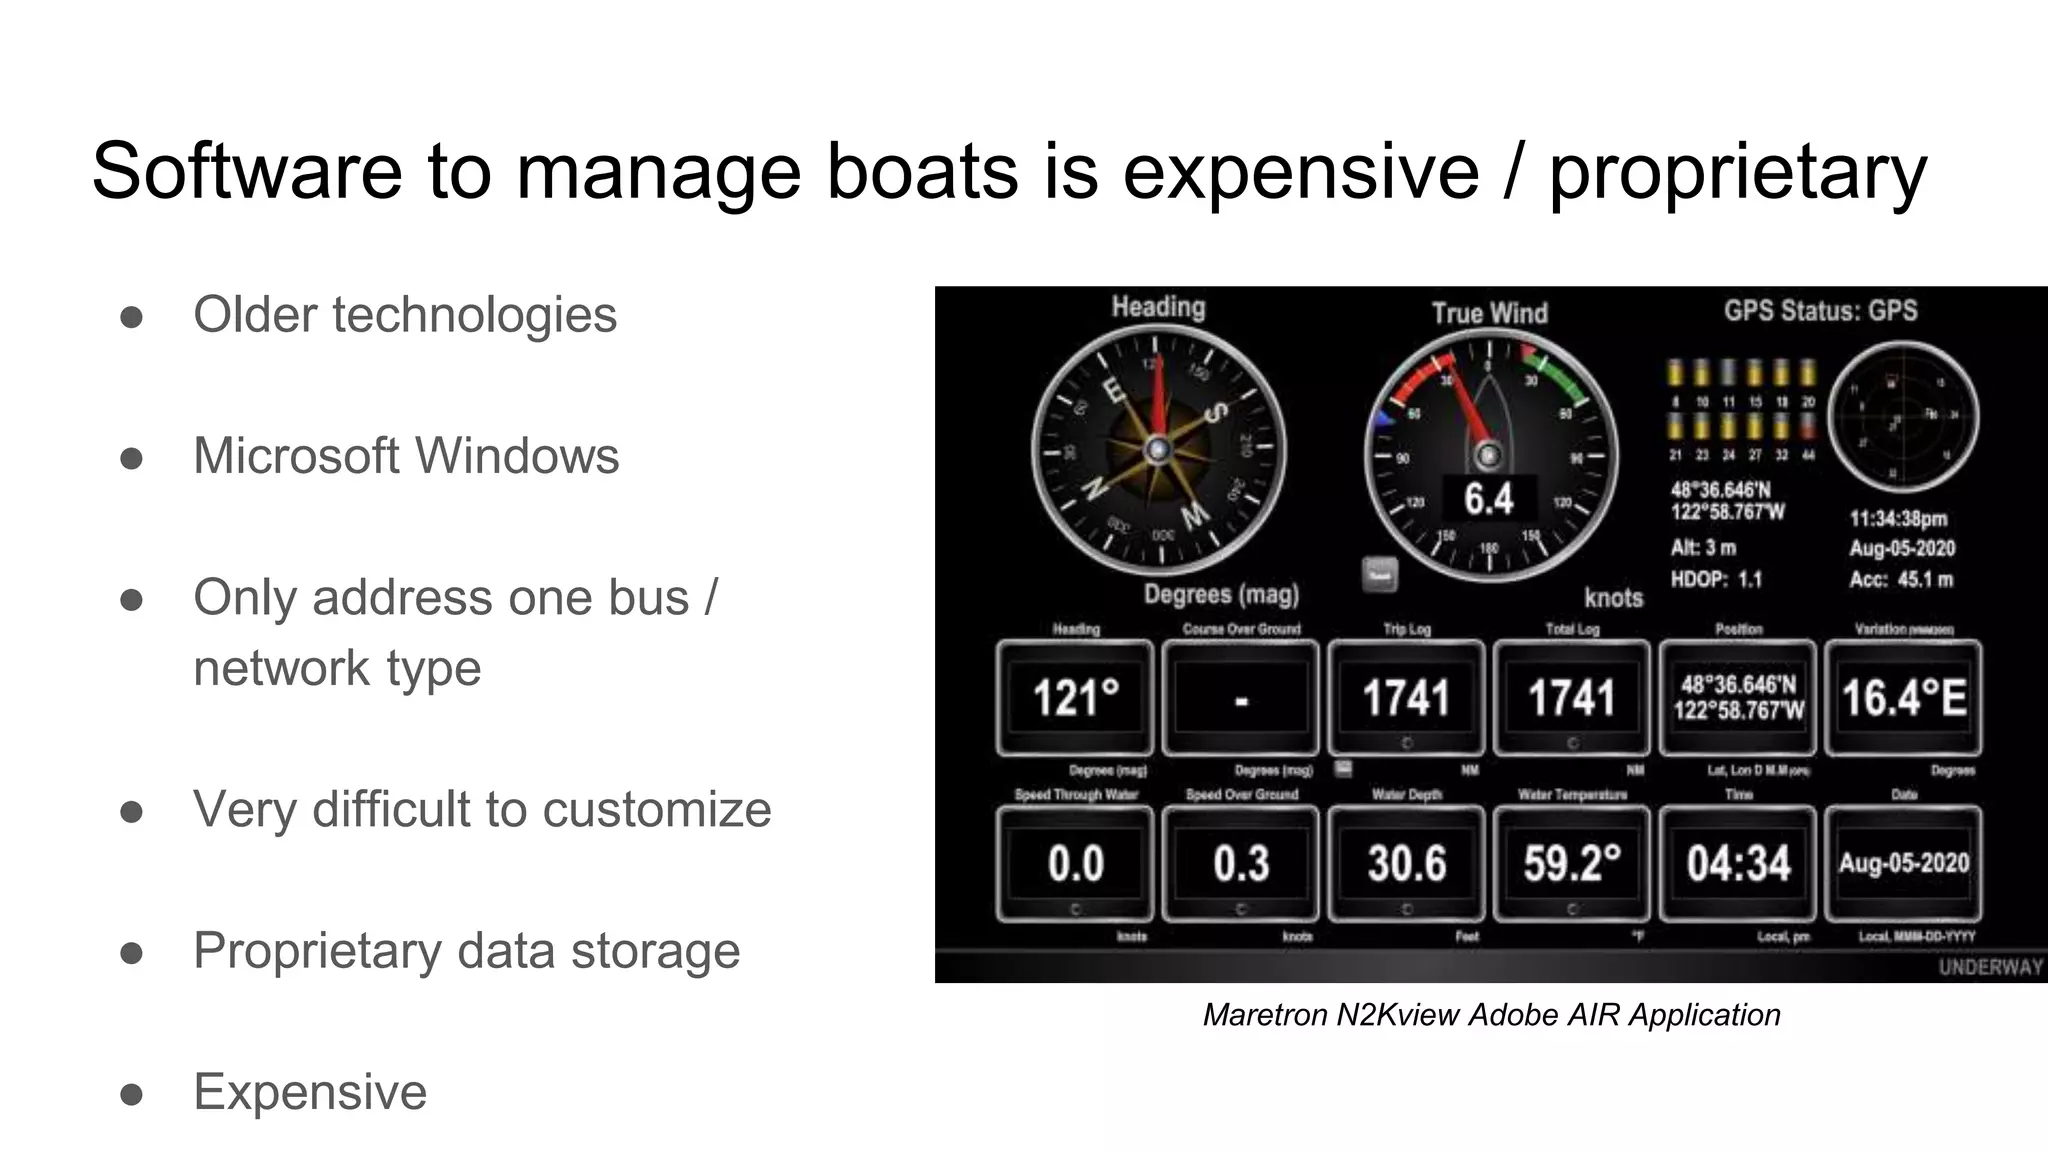
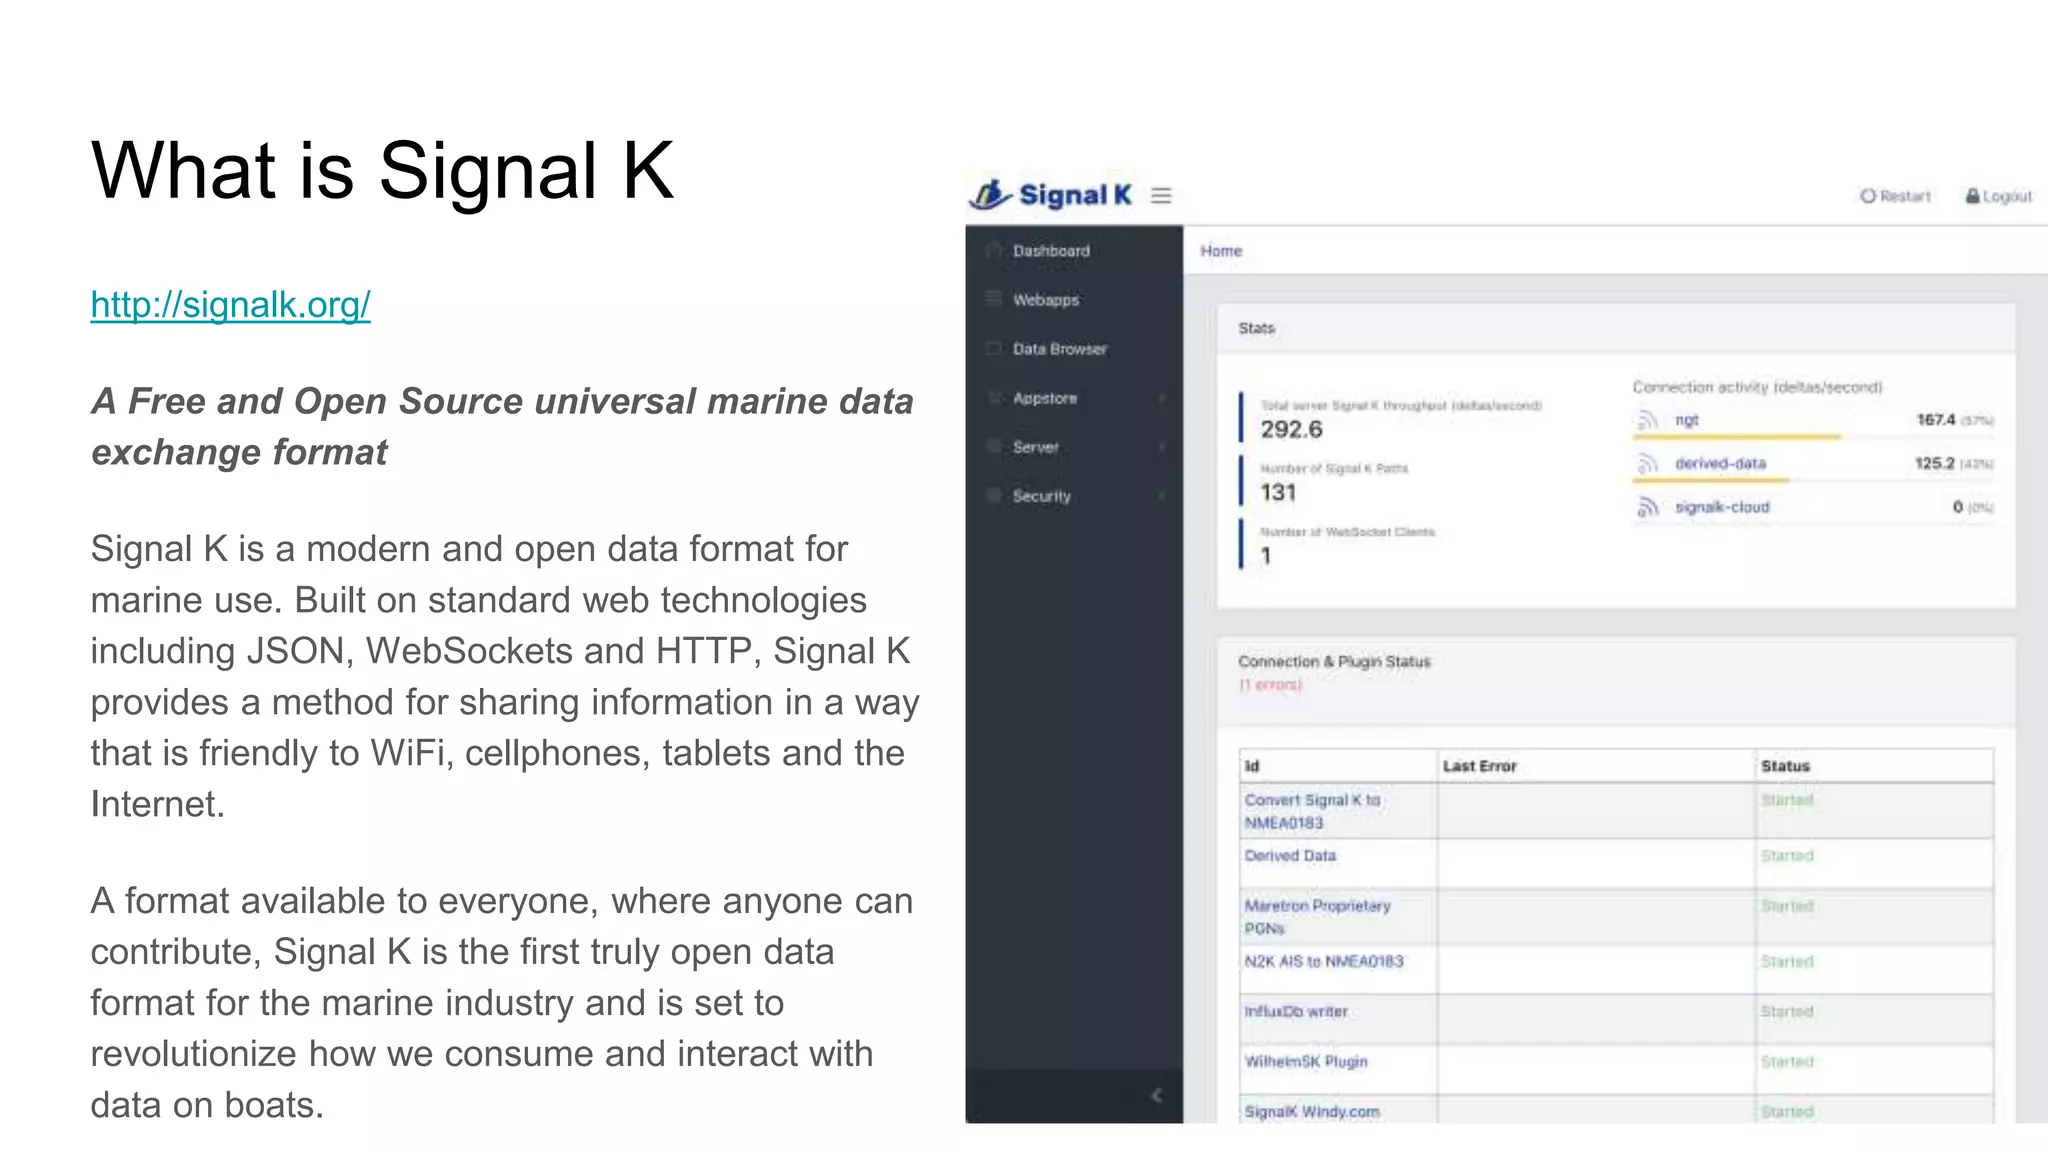
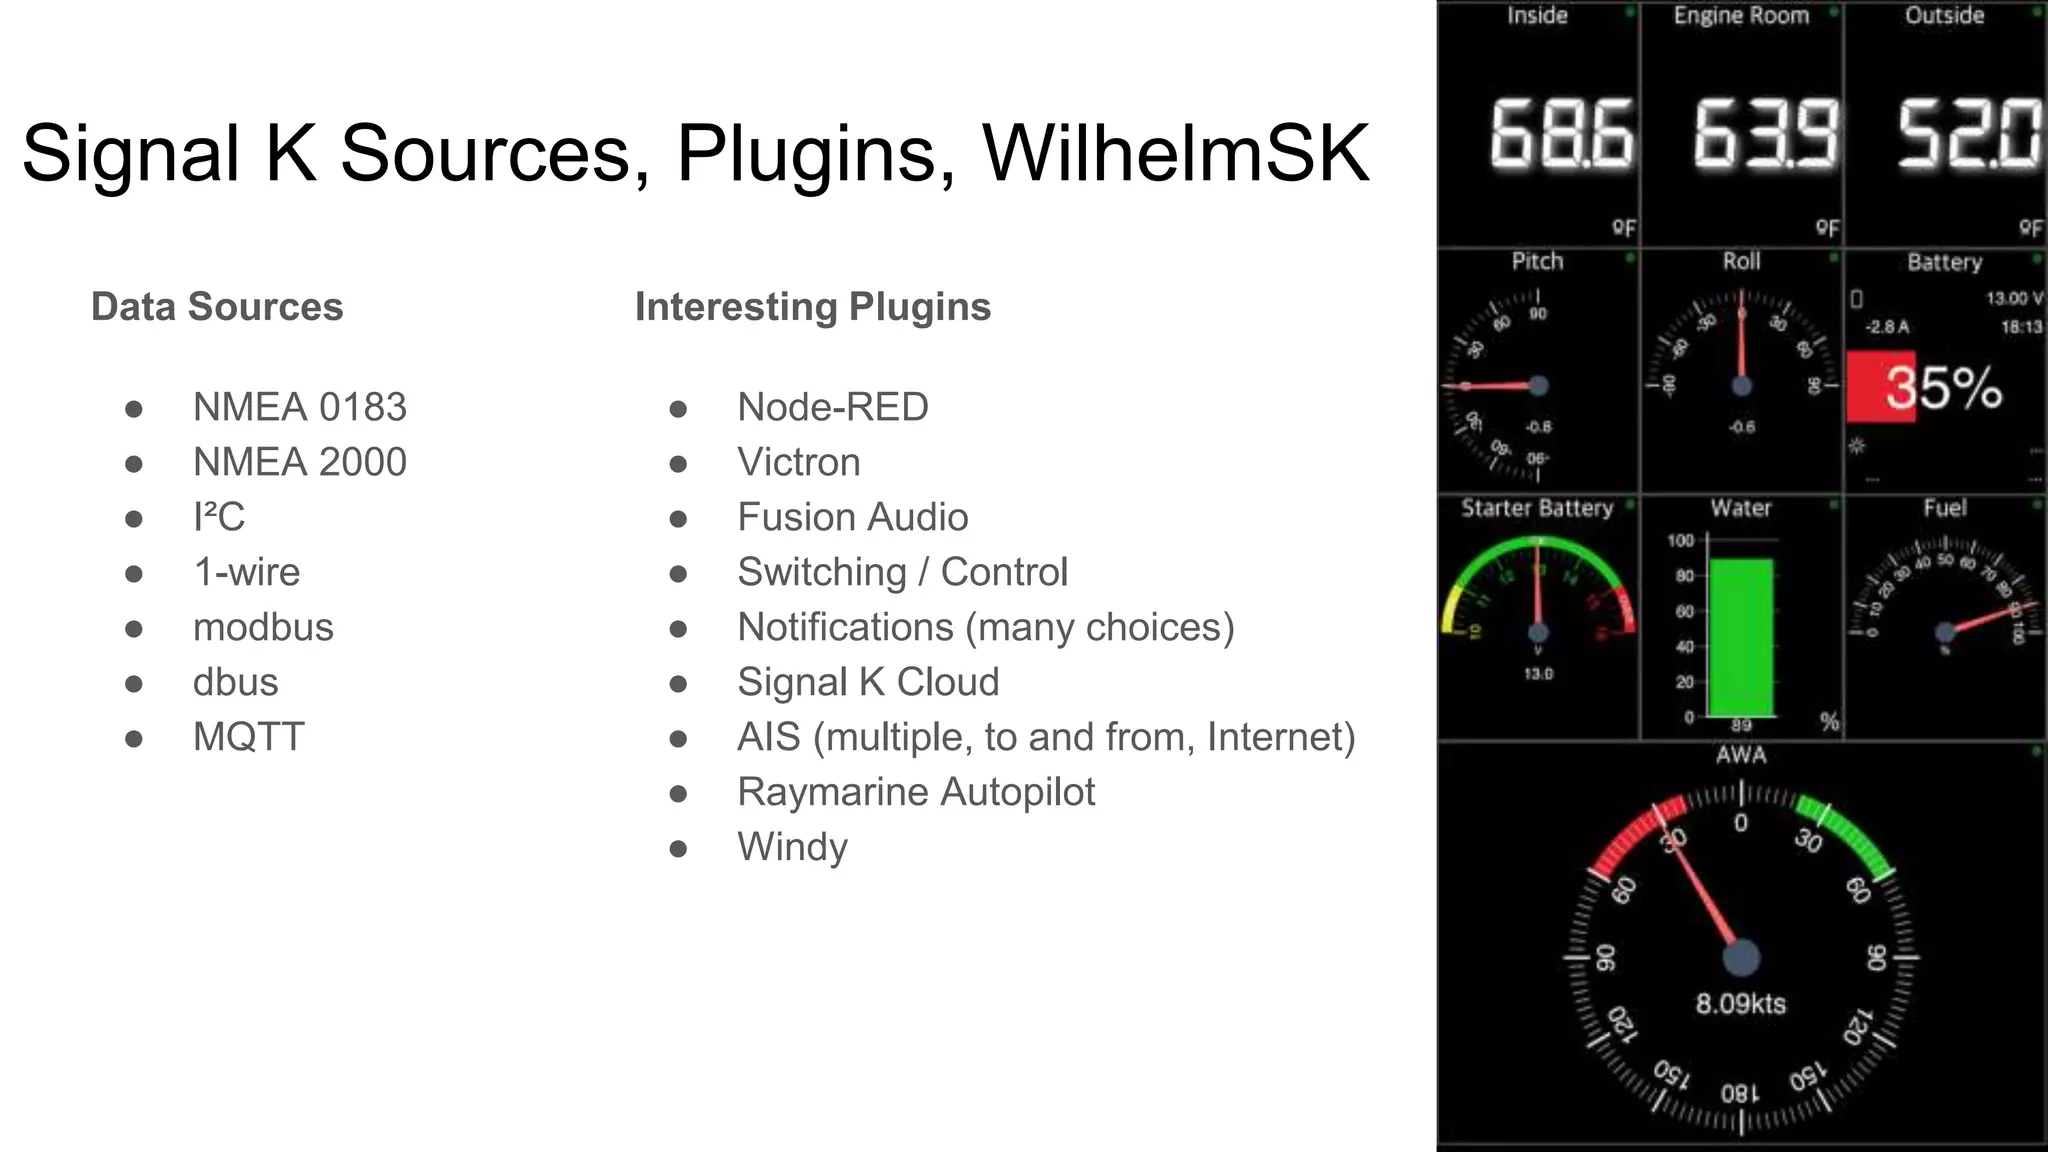
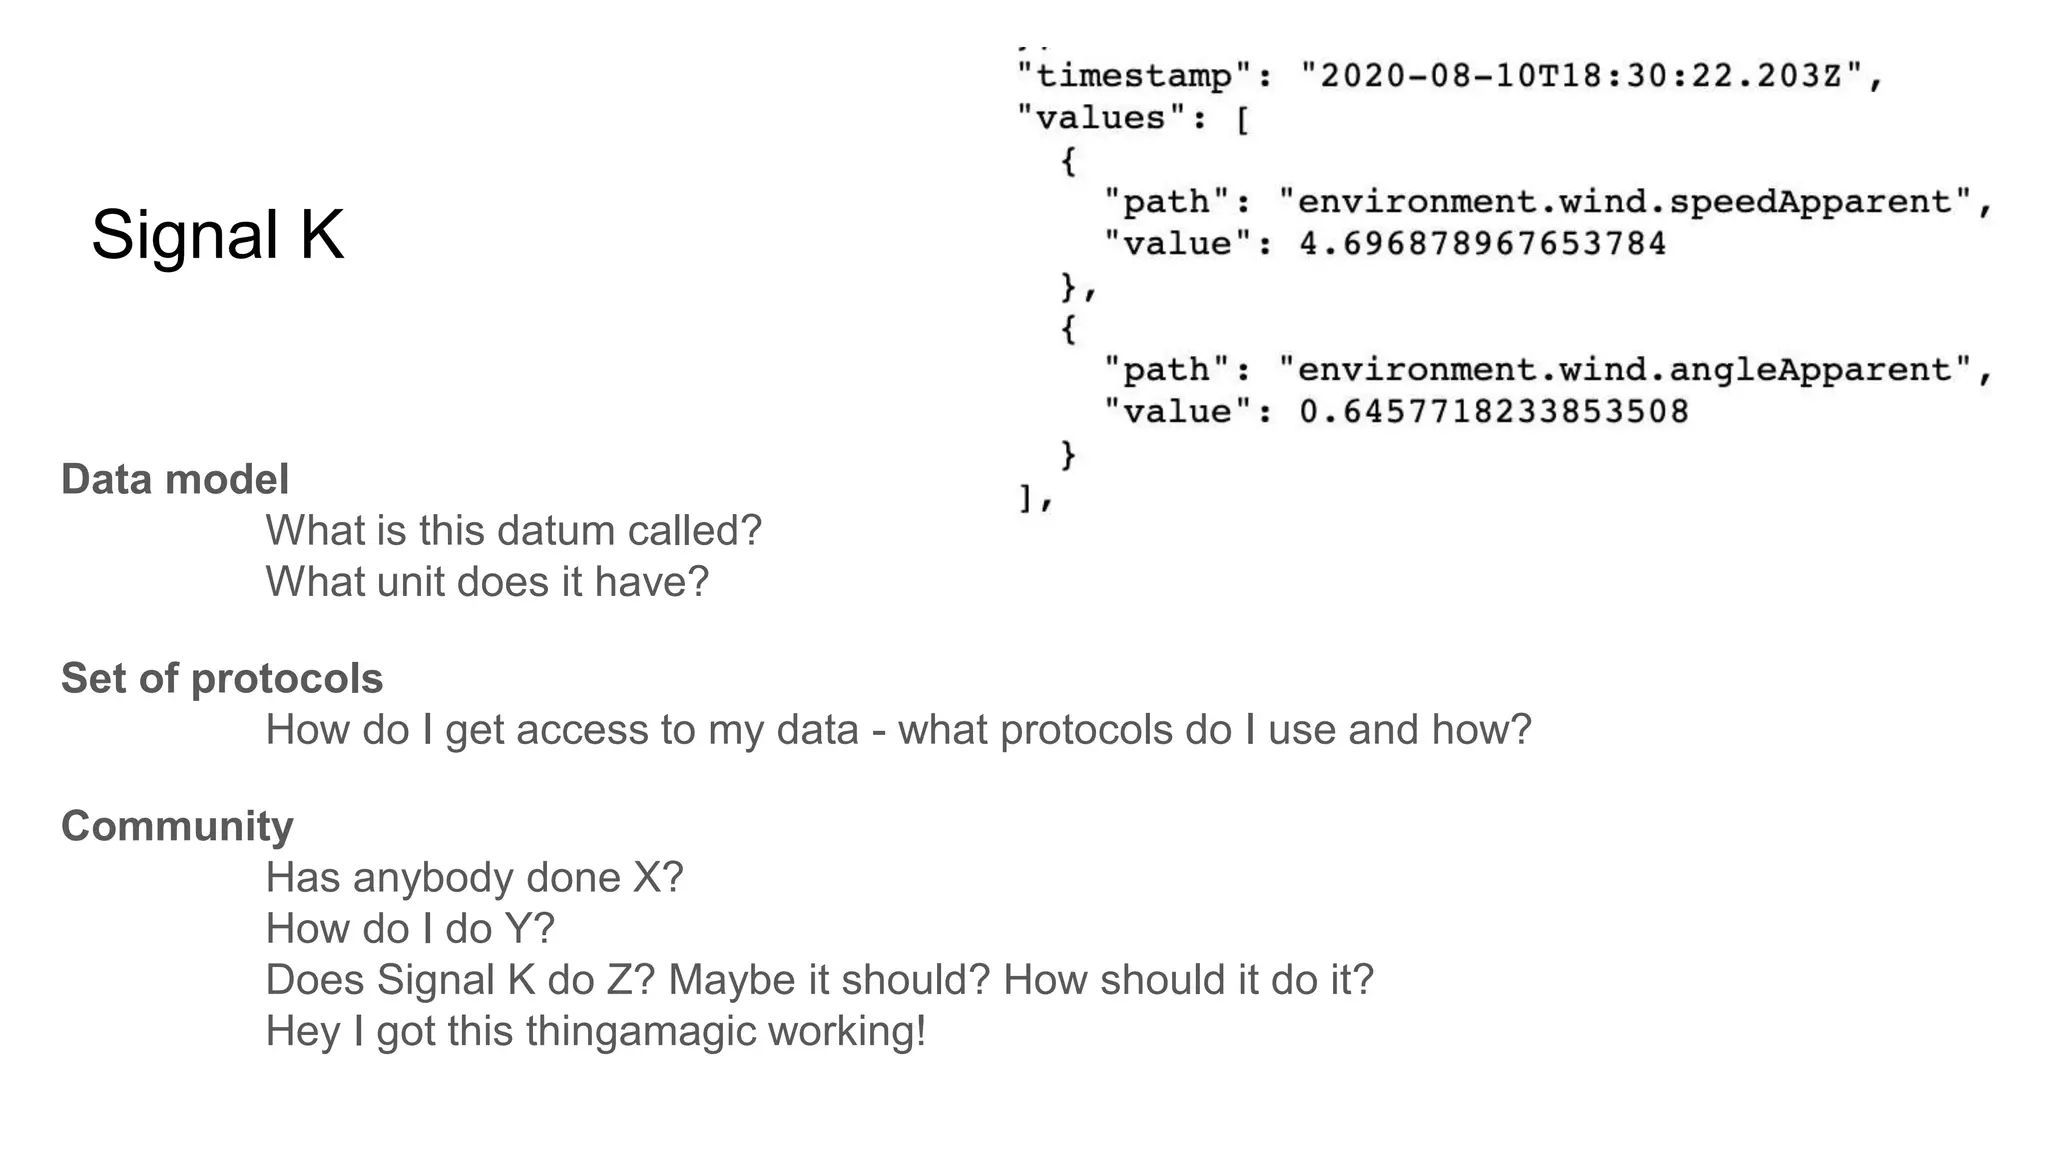
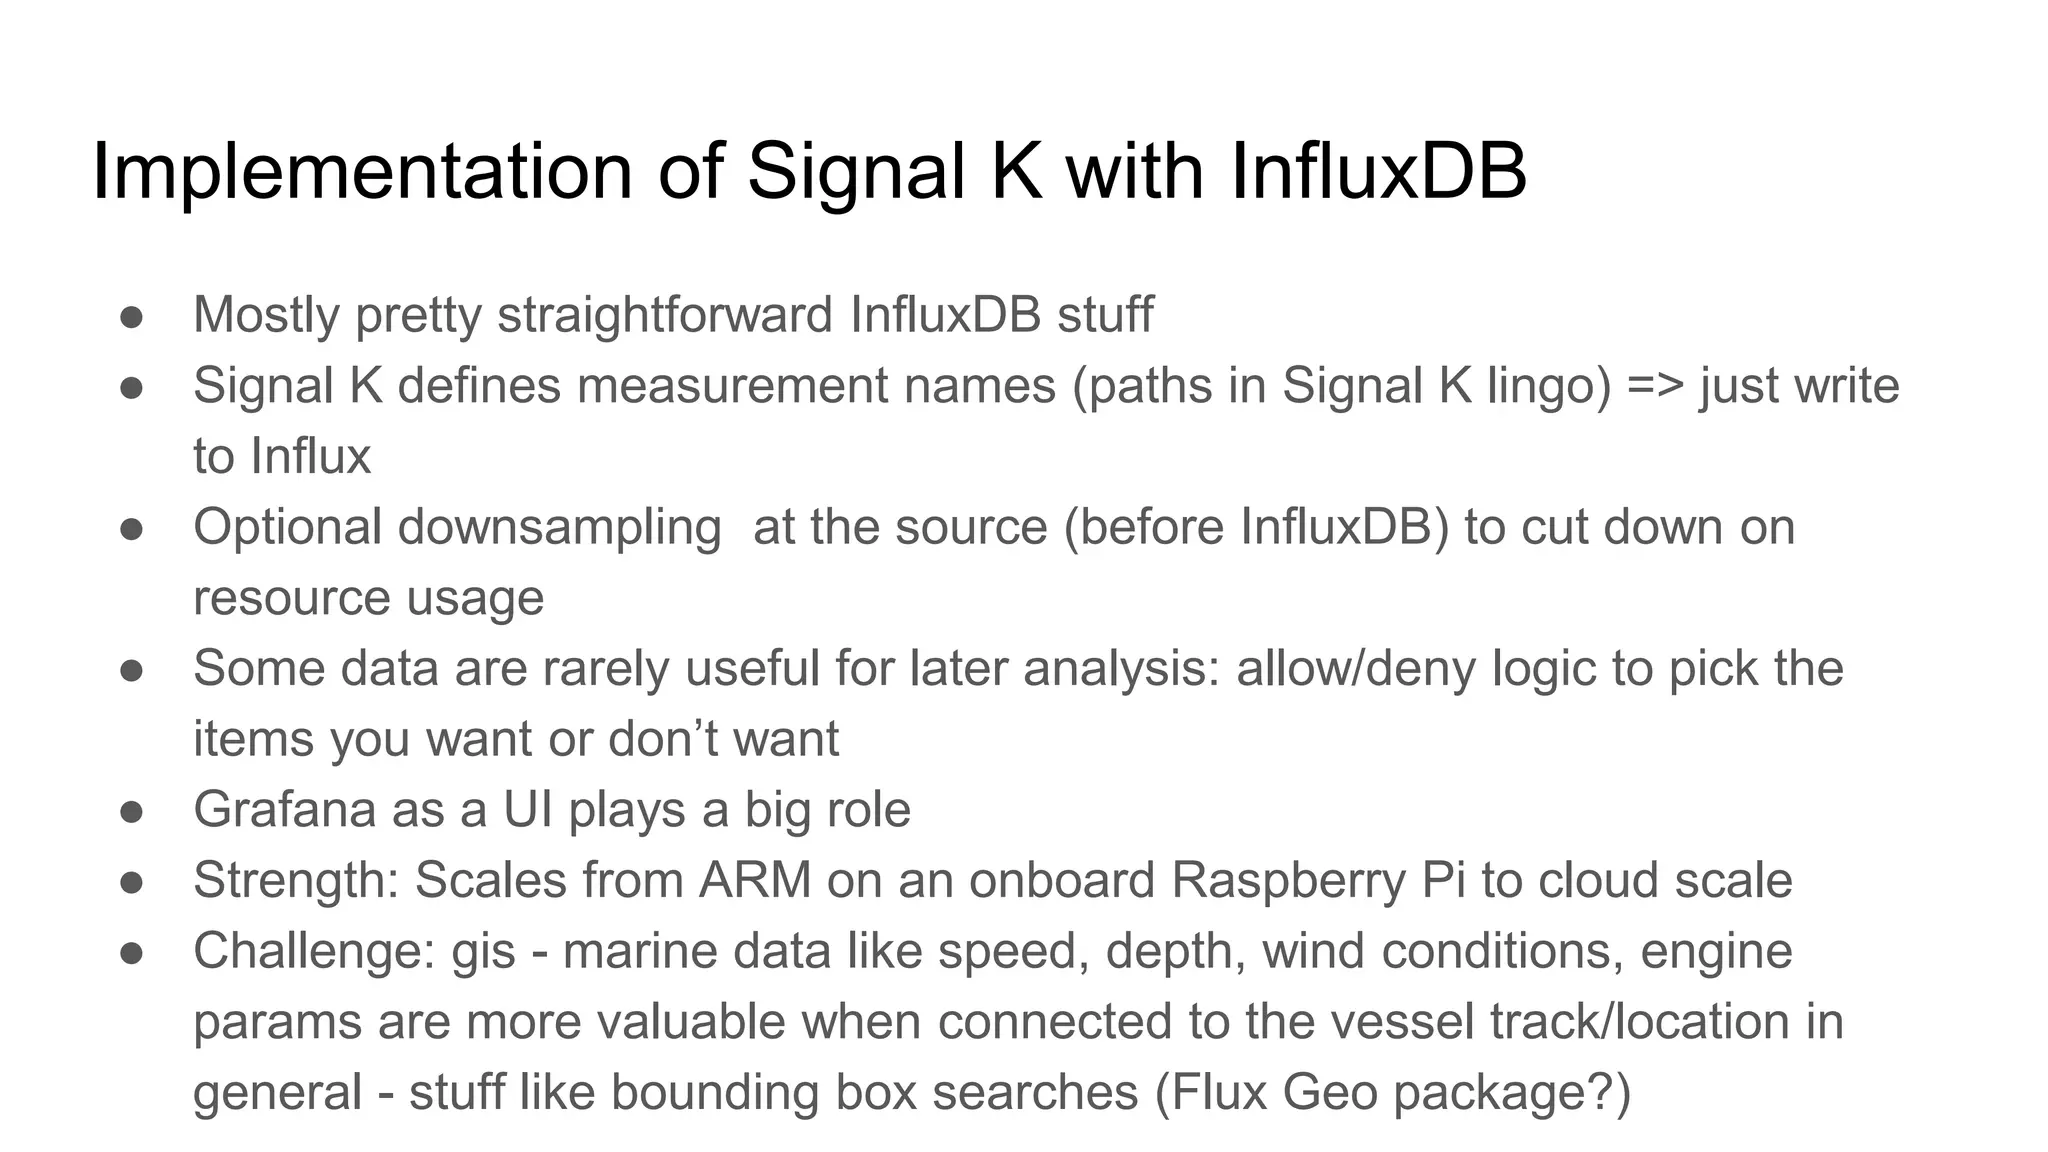
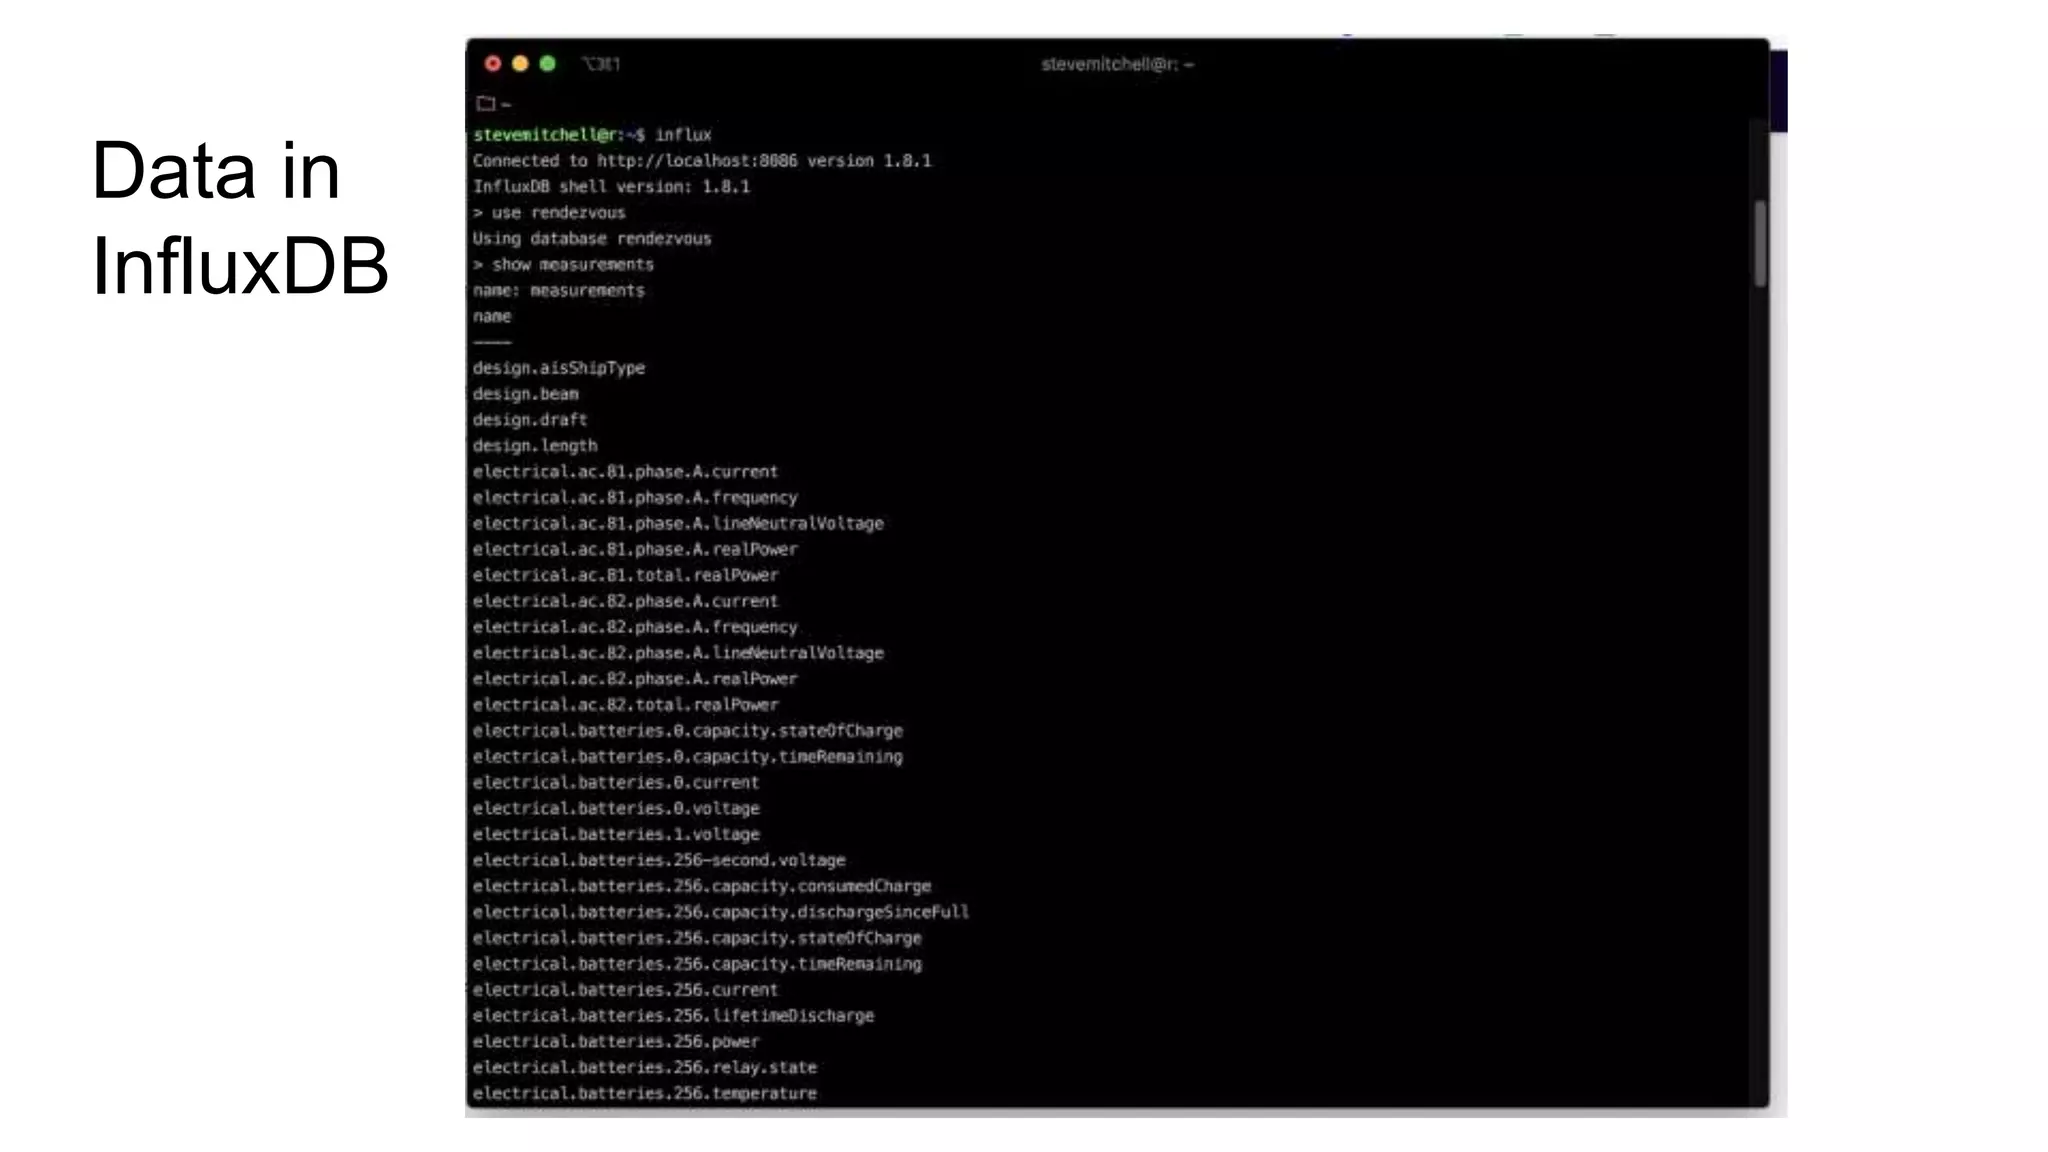
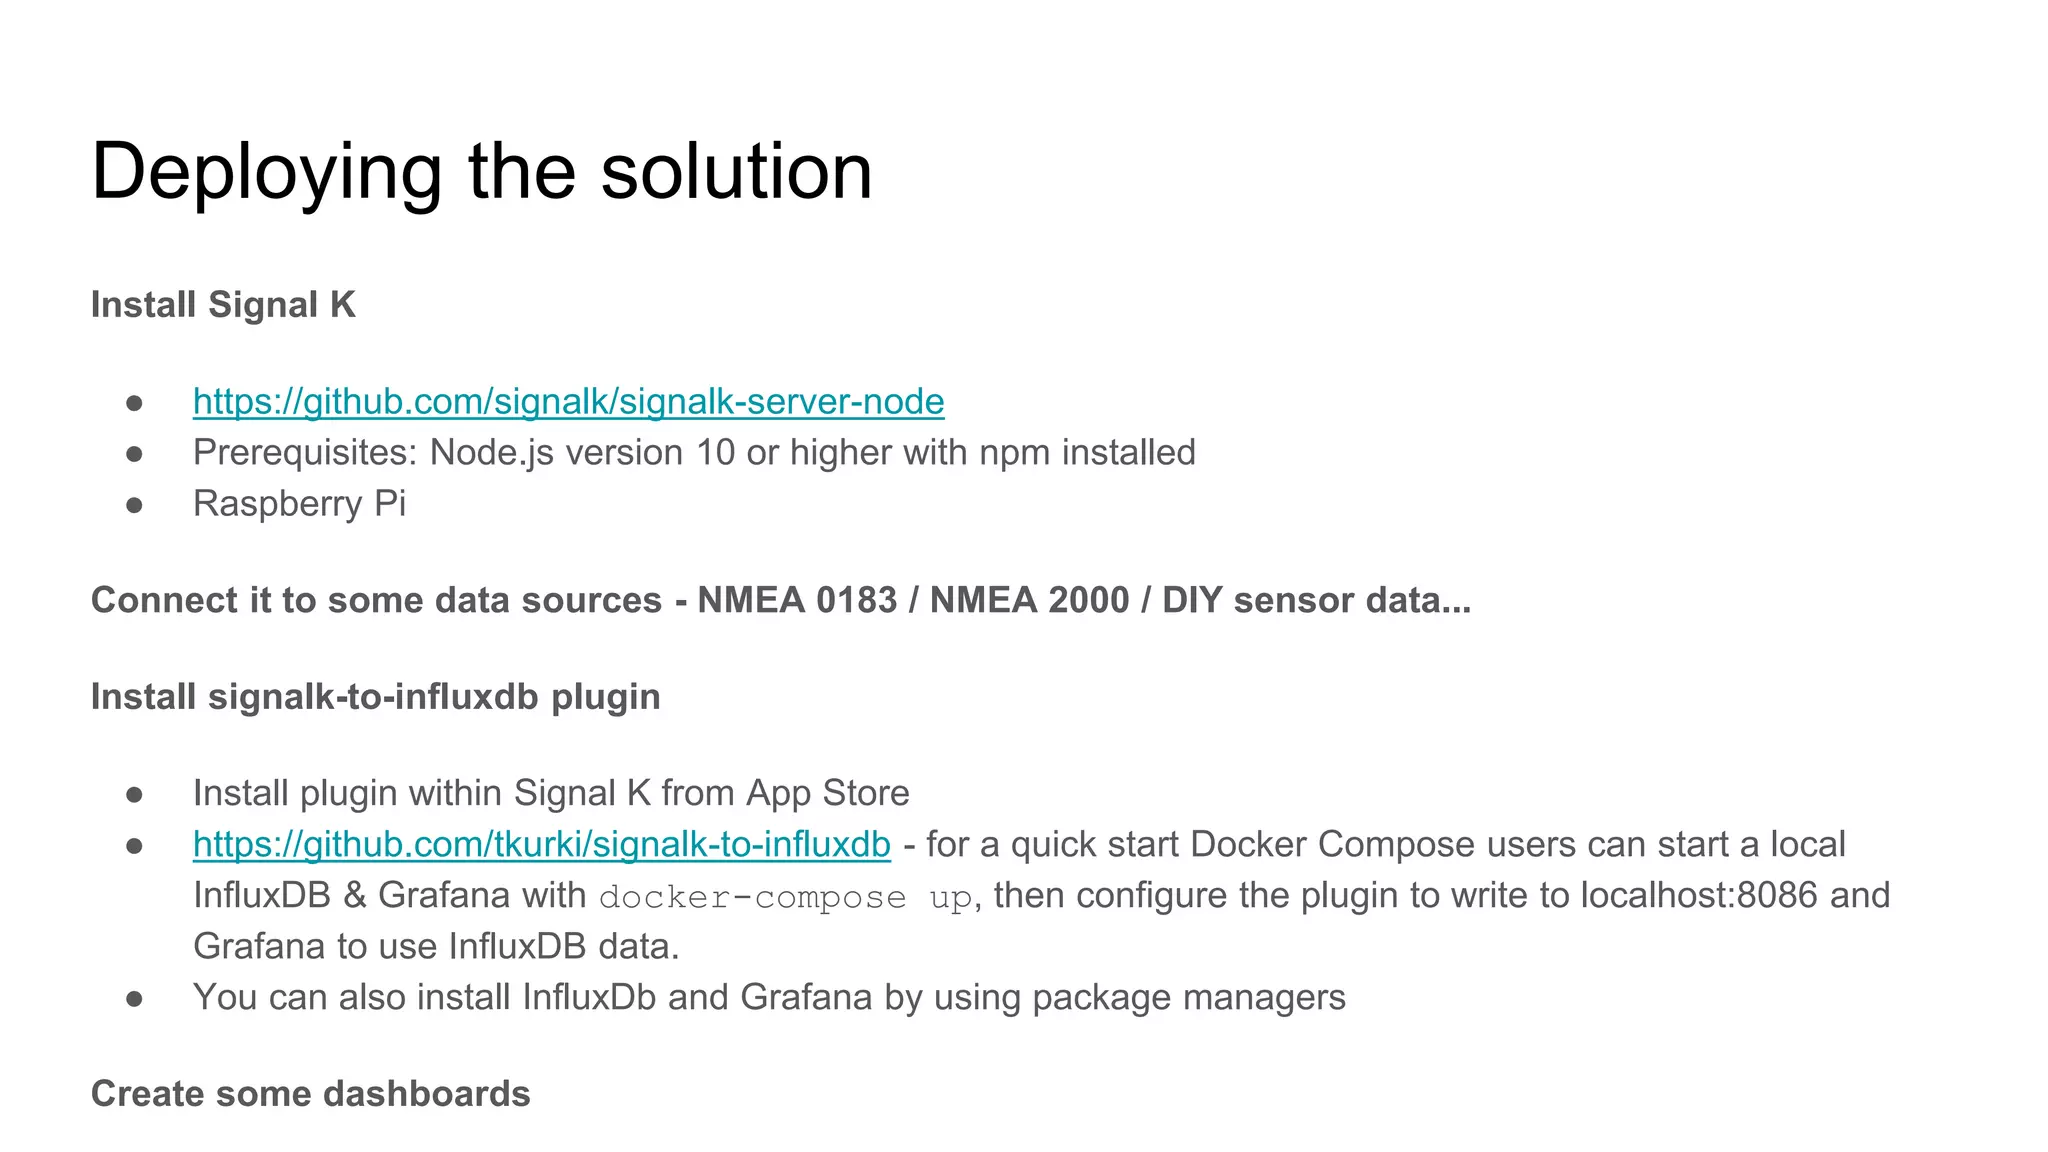

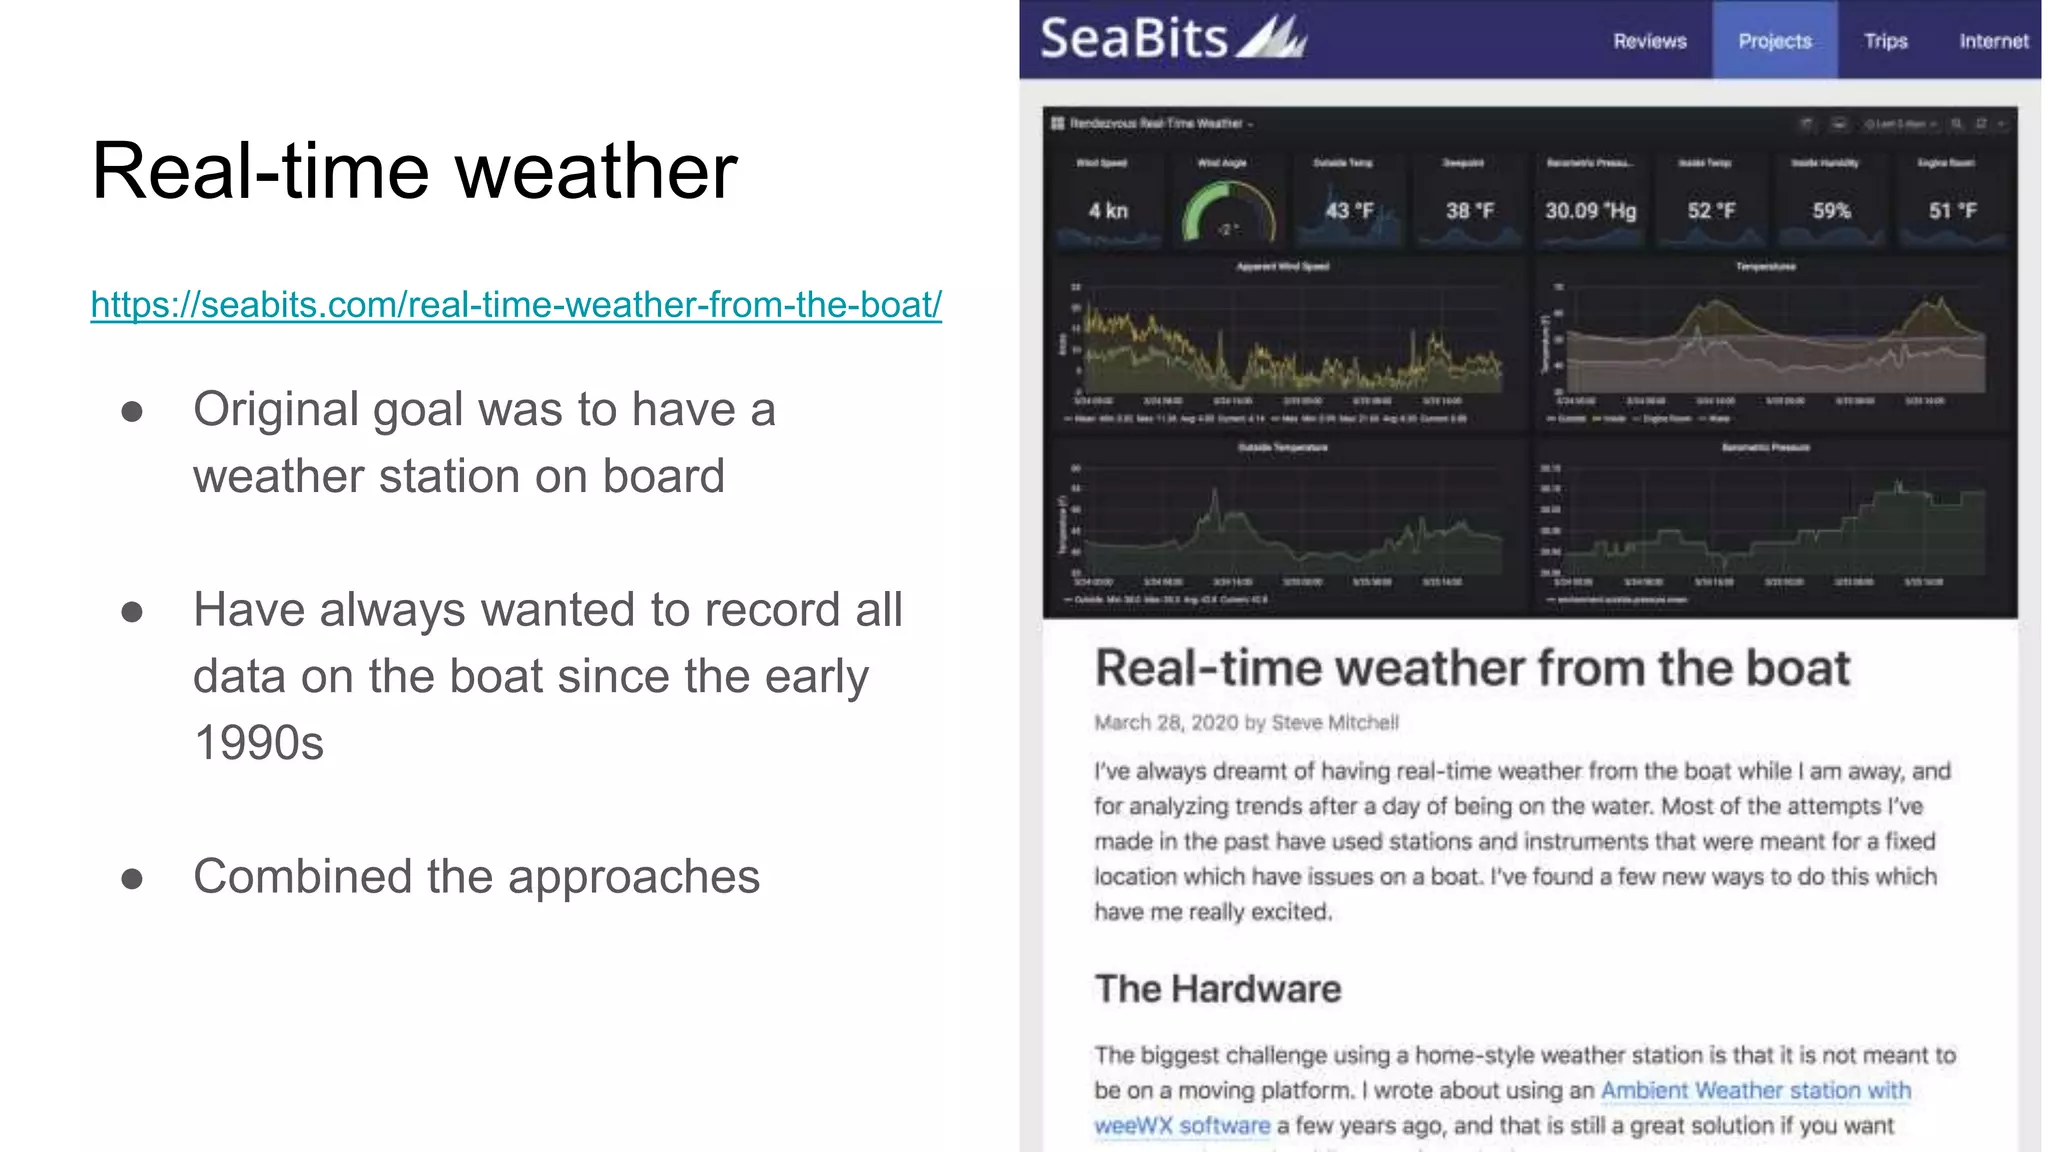
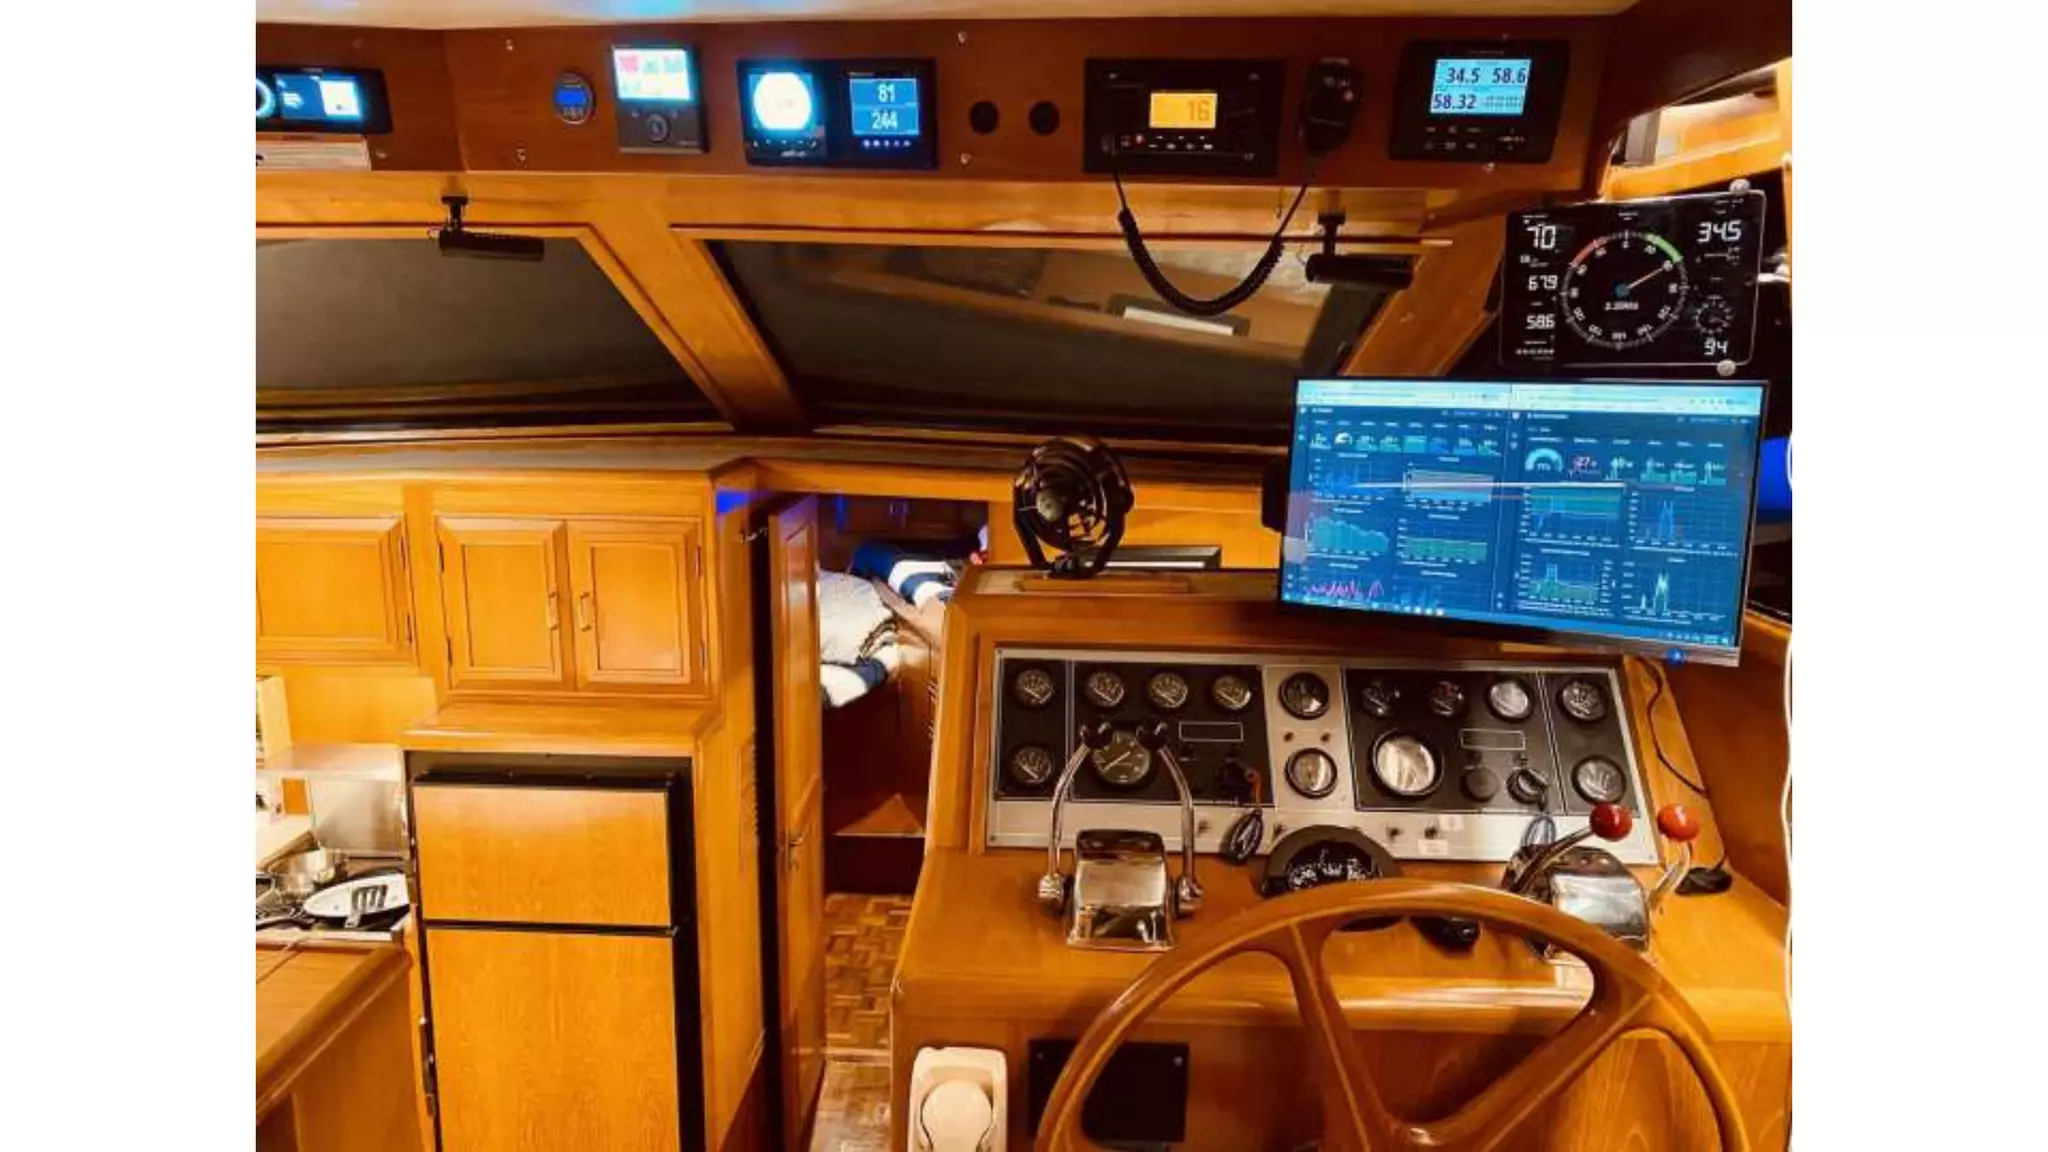
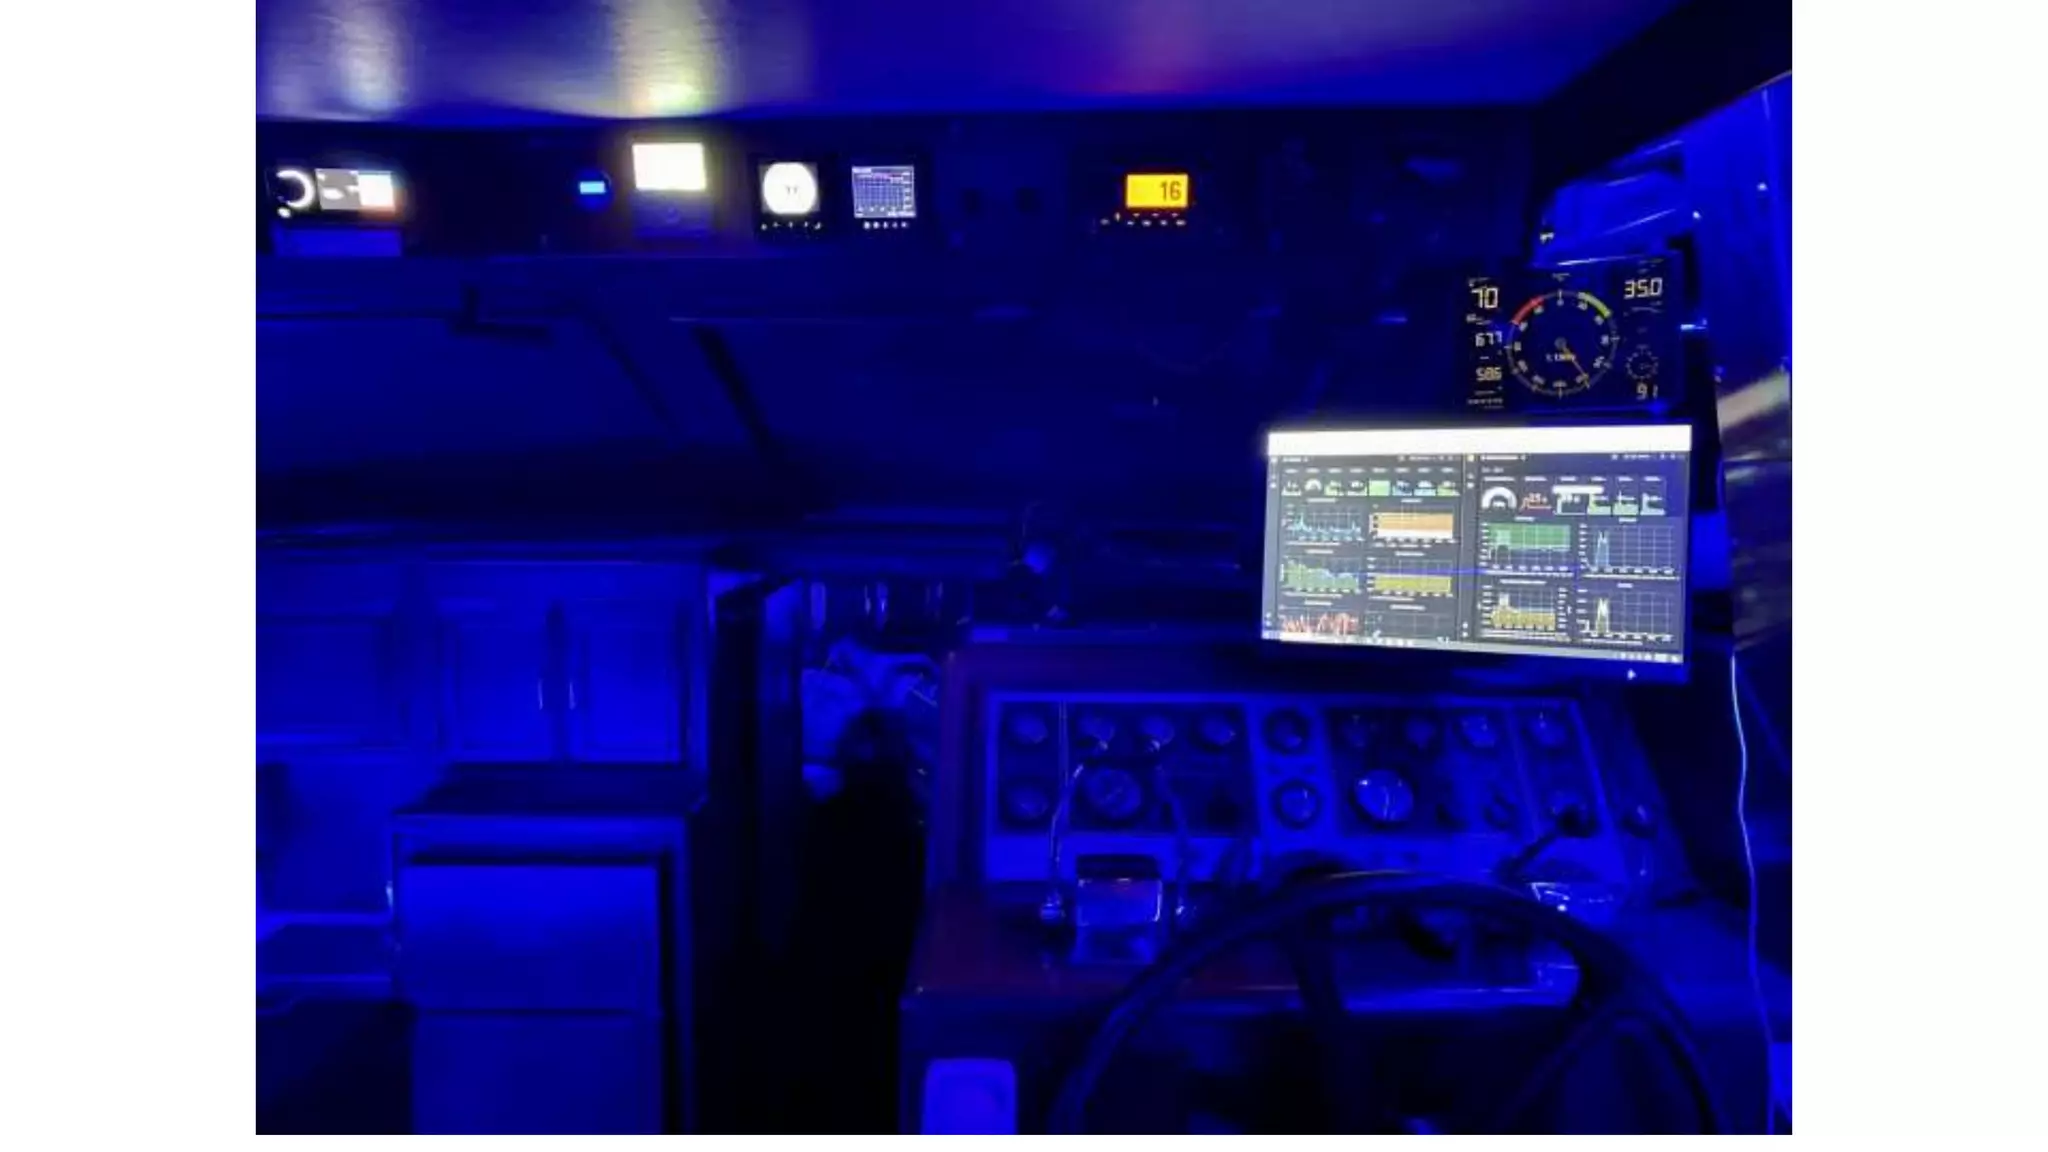
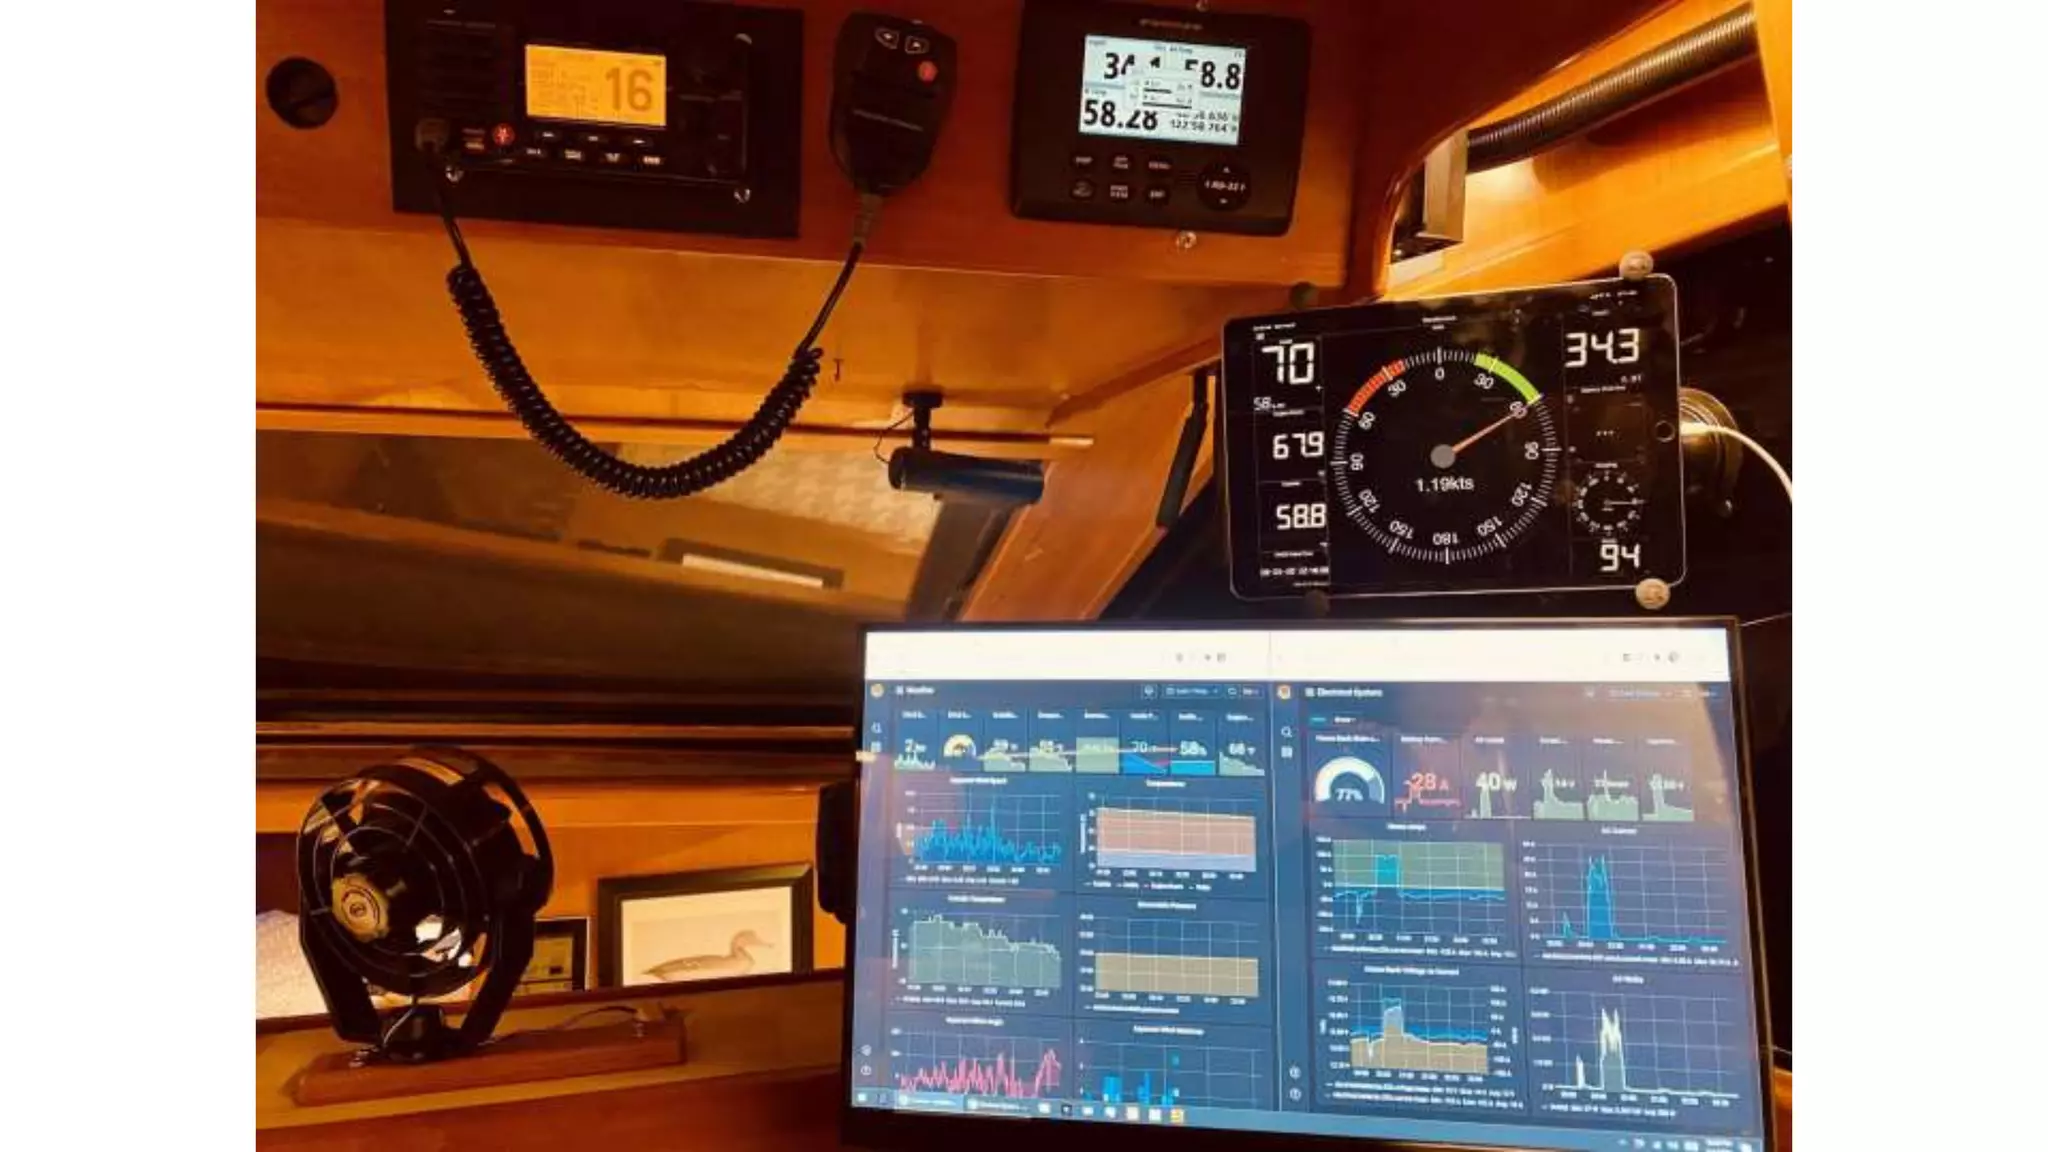
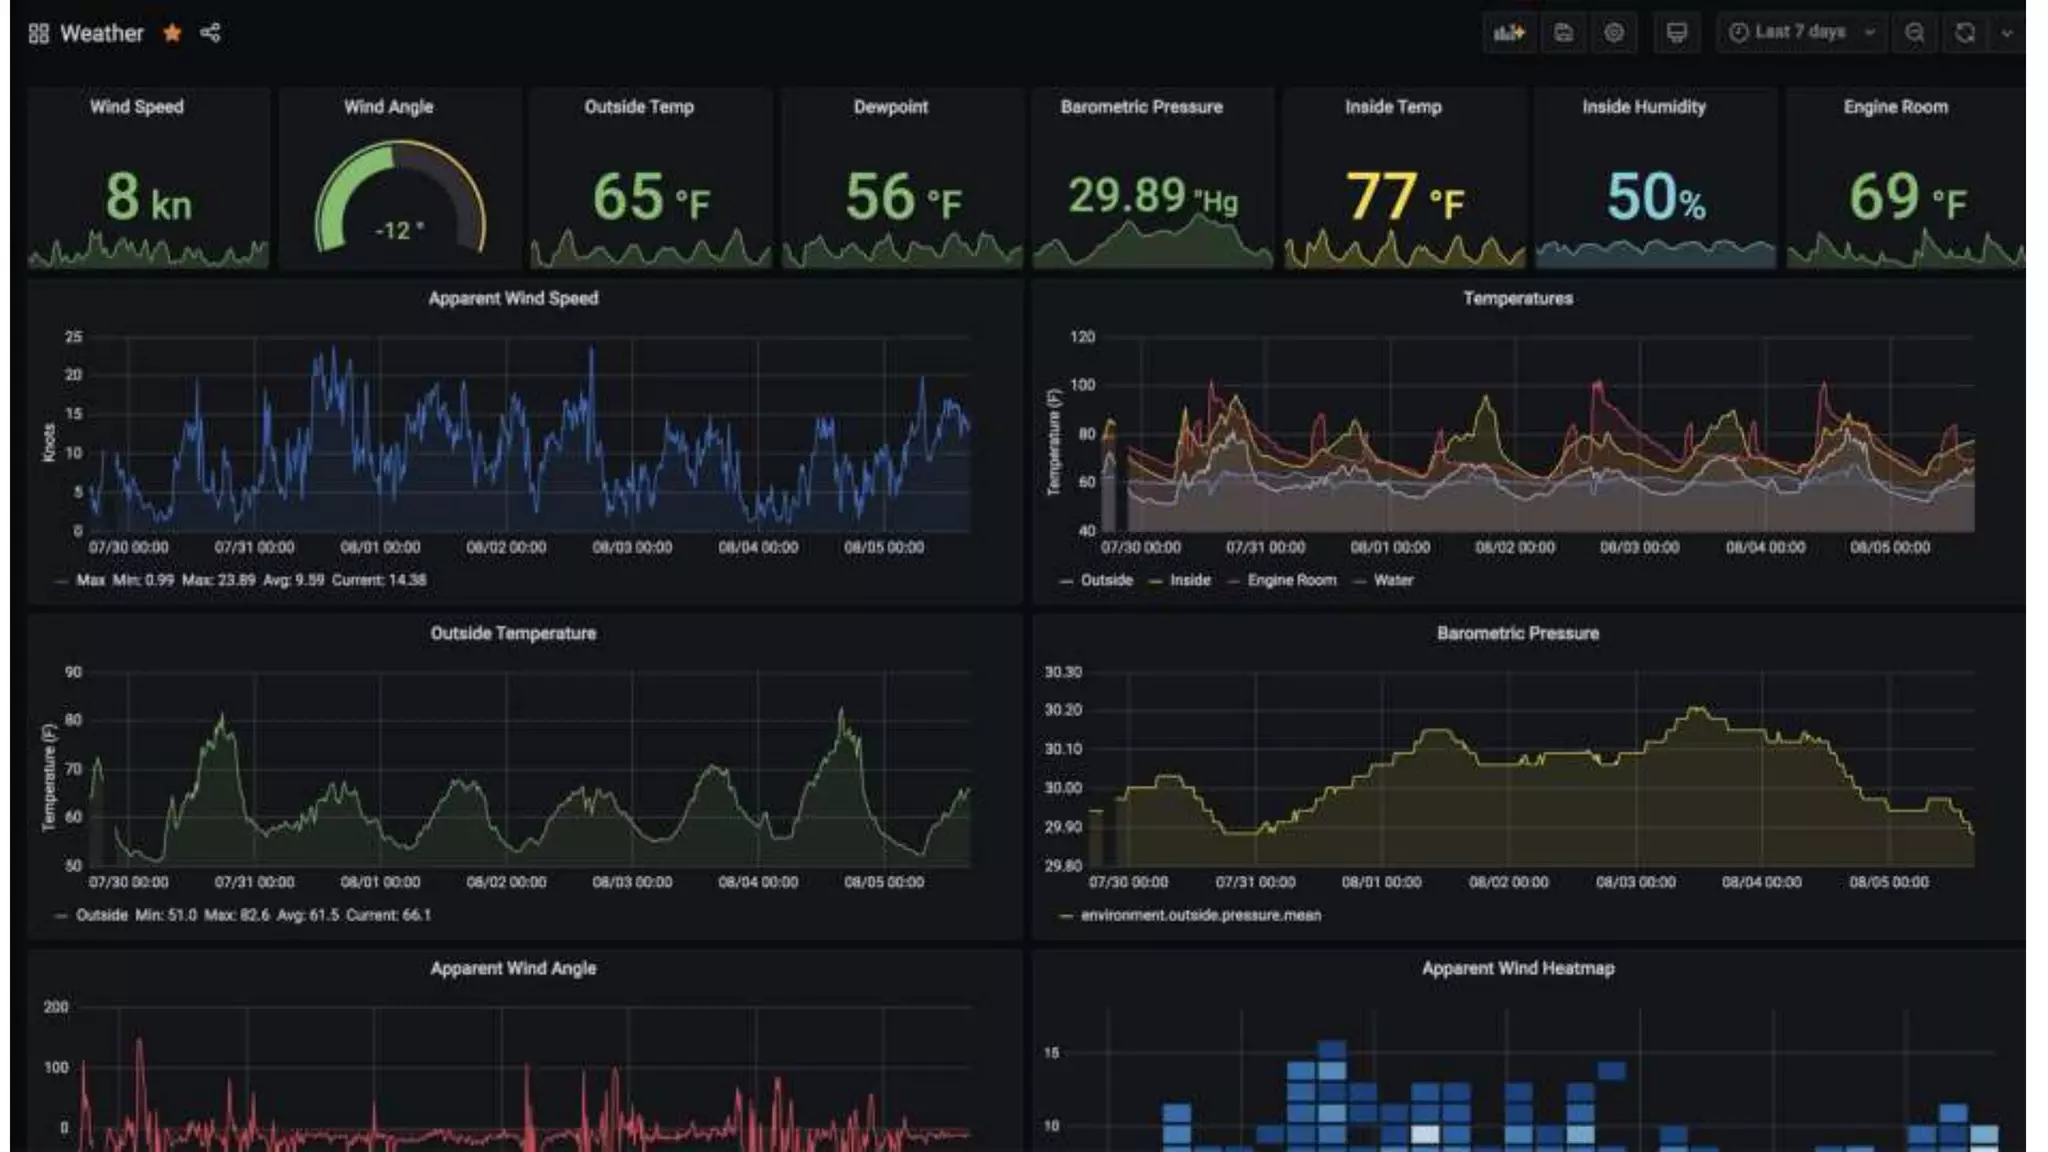
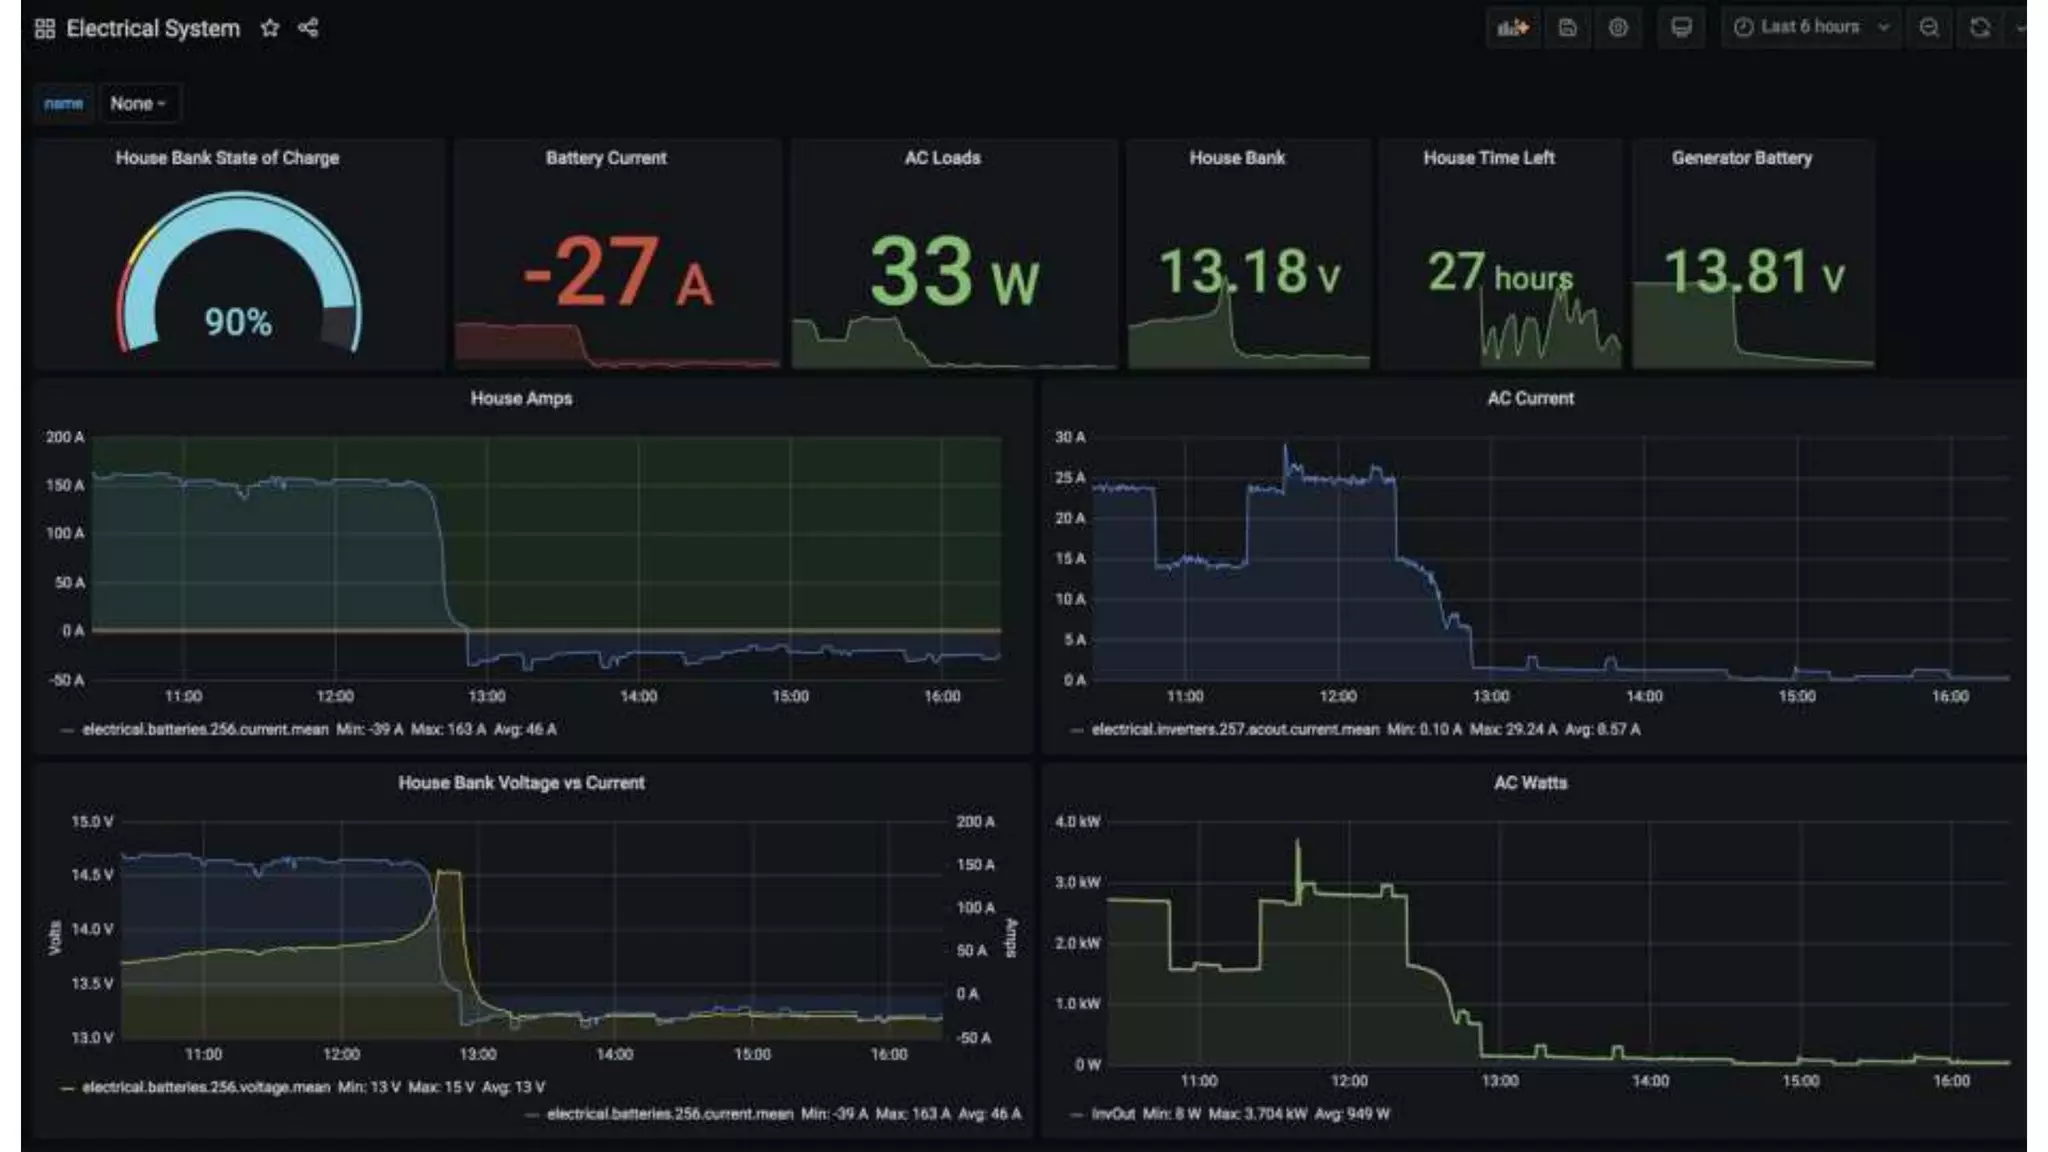
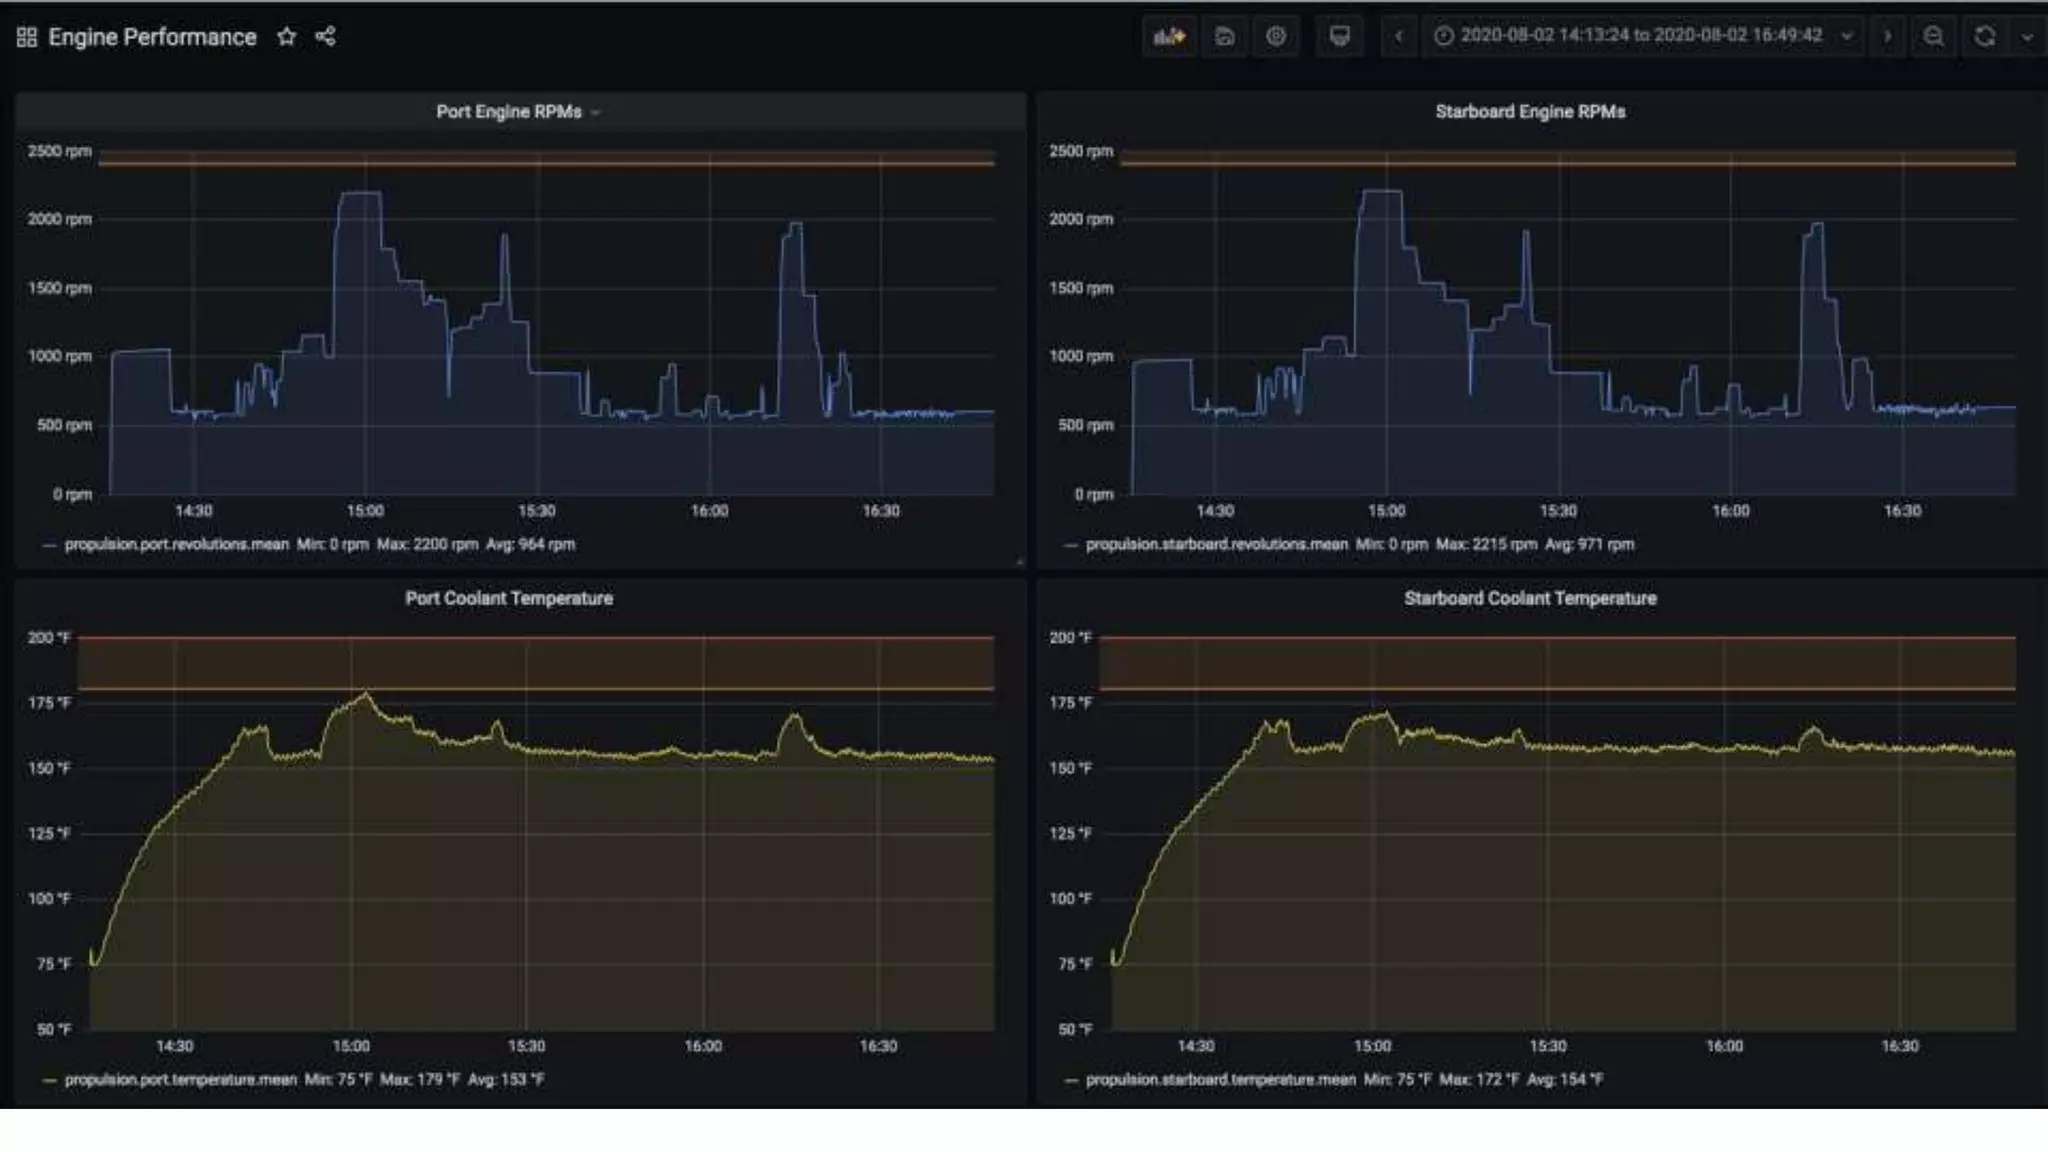
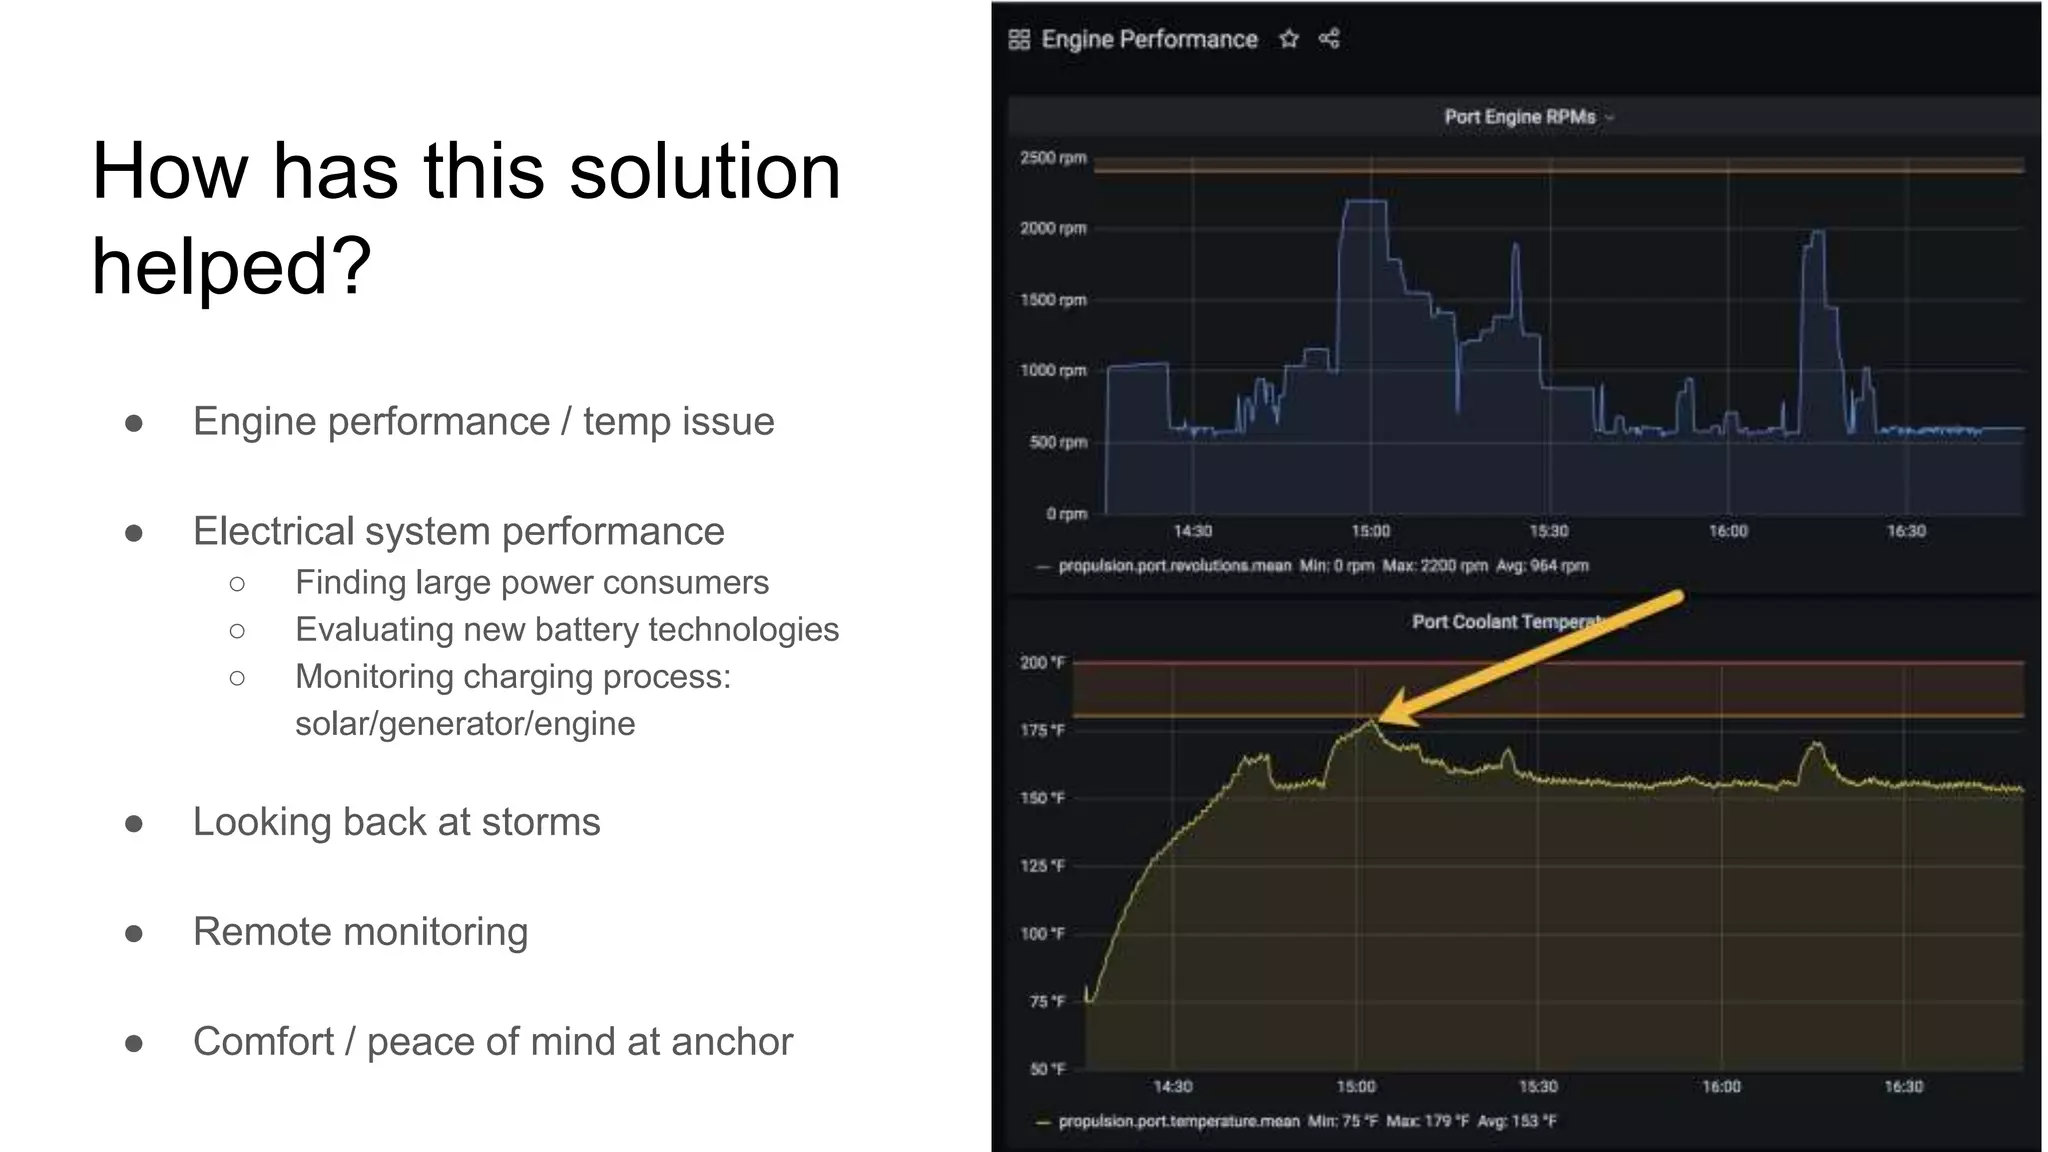

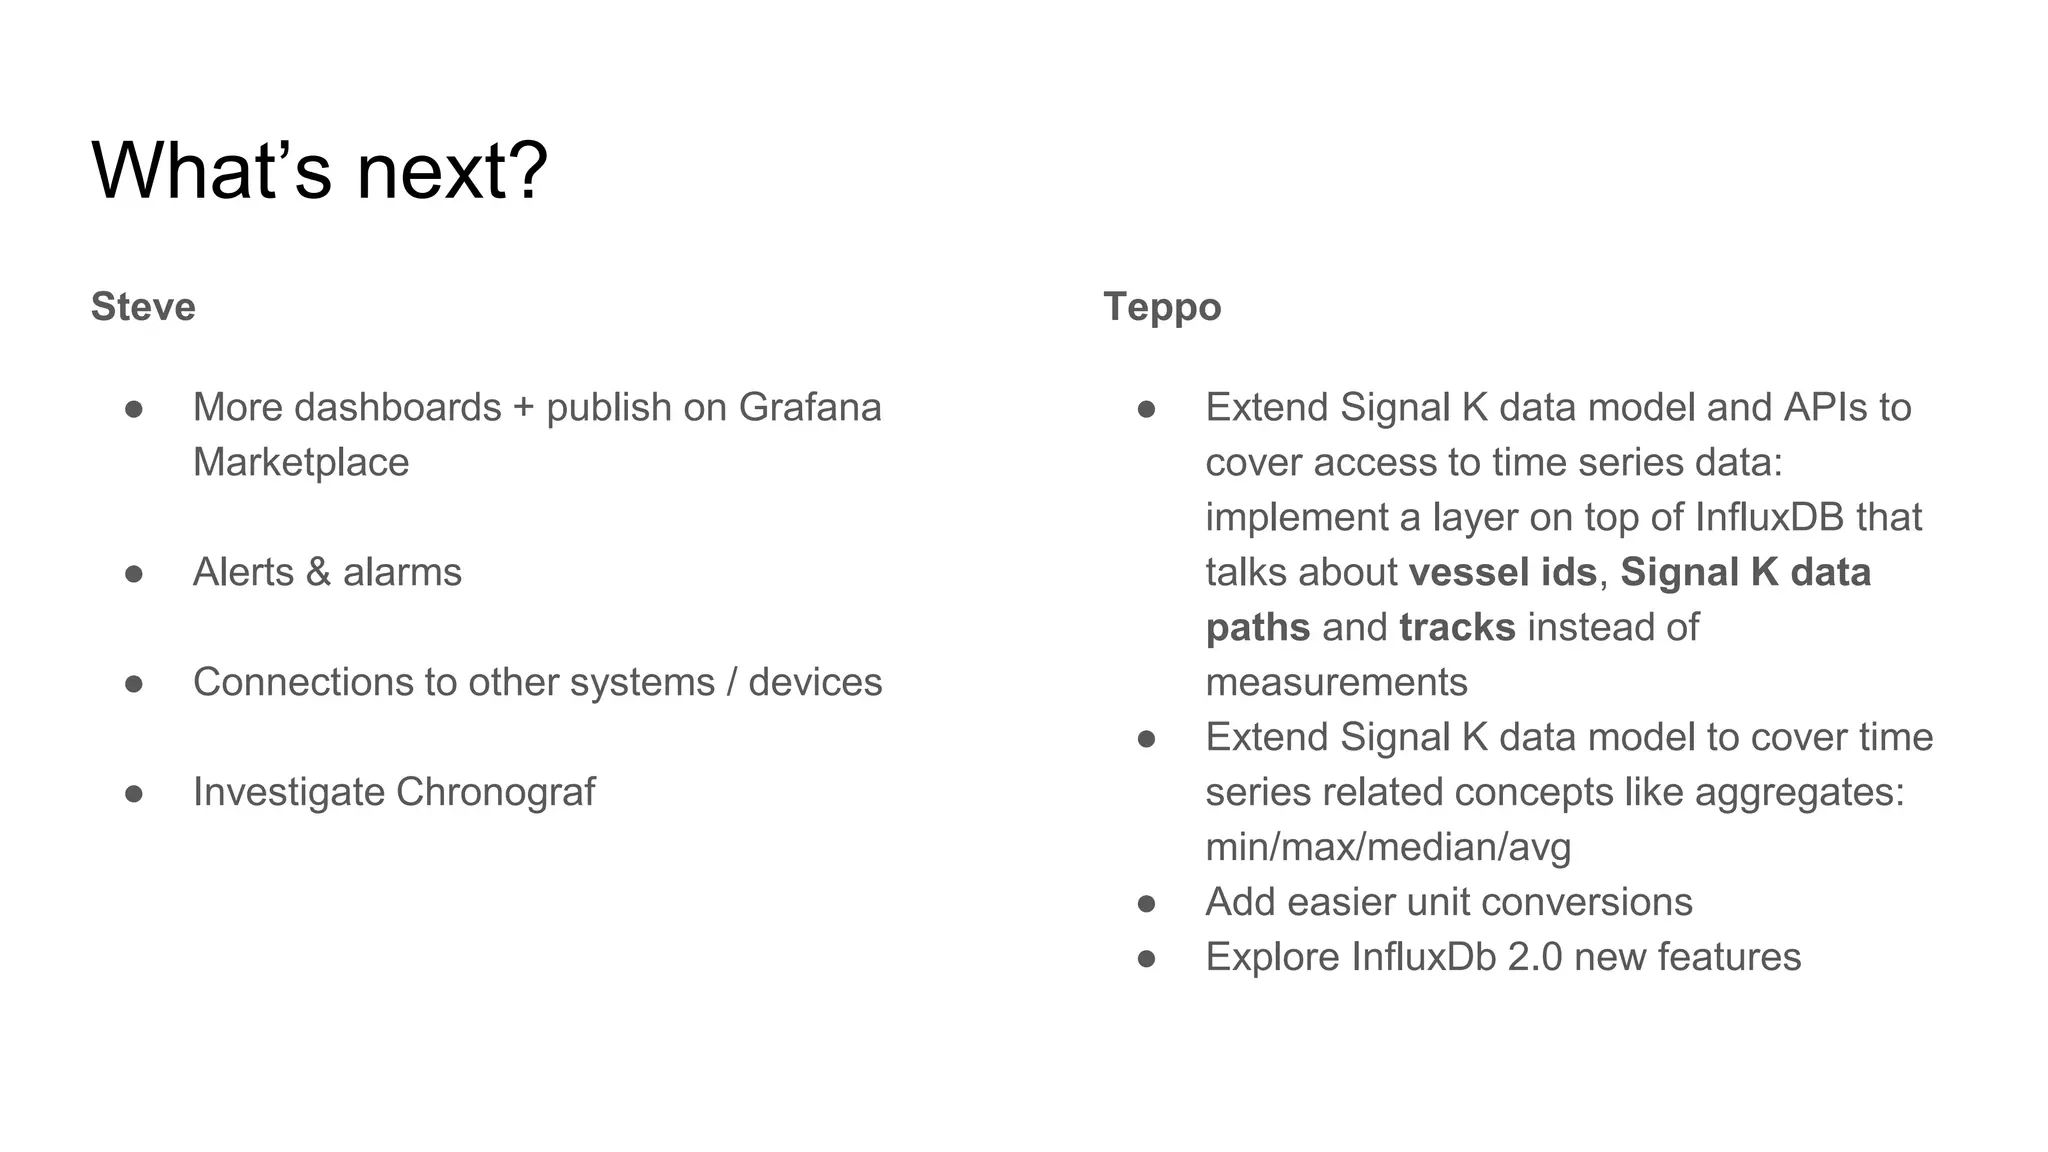


Steve and Teppo presented a solution for visualizing and analyzing boat data from disparate sources. Their goals were to record all boat data for later analysis, create customizable dashboards to visualize data and trends, and gain access to data from any source. Their solution uses Signal K to connect data sources, writes the data to InfluxDB for storage, and uses Grafana dashboards to visualize trends over time. This has helped users monitor engine performance, electrical systems, storms, and troubleshoot issues remotely. Future work includes more dashboards, alerts, device integrations, and extending the Signal K data model.


![Ward Bowman [PTC] | ThingWorx Long-Term Data Storage with InfluxDB | InfluxDa...](https://cdn.slidesharecdn.com/ss_thumbnails/influxdays-221027185325-5d2f430b-thumbnail.jpg?width=640&height=640&fit=bounds)


![Steinkamp, Clifford [InfluxData] | Welcome to InfluxDays 2022 - Day 2 | Influ...](https://cdn.slidesharecdn.com/ss_thumbnails/influxdays2022welcometoday2-221020215815-c8463942-thumbnail.jpg?width=640&height=640&fit=bounds)
![Steinkamp, Clifford [InfluxData] | Closing Thoughts | InfluxDays 2022](https://cdn.slidesharecdn.com/ss_thumbnails/influxdays2022closingthoughtsday2-221020220104-abde55ea-thumbnail.jpg?width=640&height=640&fit=bounds)
![Steinkamp, Clifford [InfluxData] | Closing Thoughts Day 1 | InfluxDays 2022](https://cdn.slidesharecdn.com/ss_thumbnails/influxdays2022closingthoughtsday1-221020215301-f8040e1f-thumbnail.jpg?width=640&height=640&fit=bounds)

![Scott Anderson [InfluxData] | New & Upcoming Flux Features | InfluxDays 2022](https://cdn.slidesharecdn.com/ss_thumbnails/influxdays2022-fluxupdates-scott-221021210238-9d323cba-thumbnail.jpg?width=640&height=640&fit=bounds)


