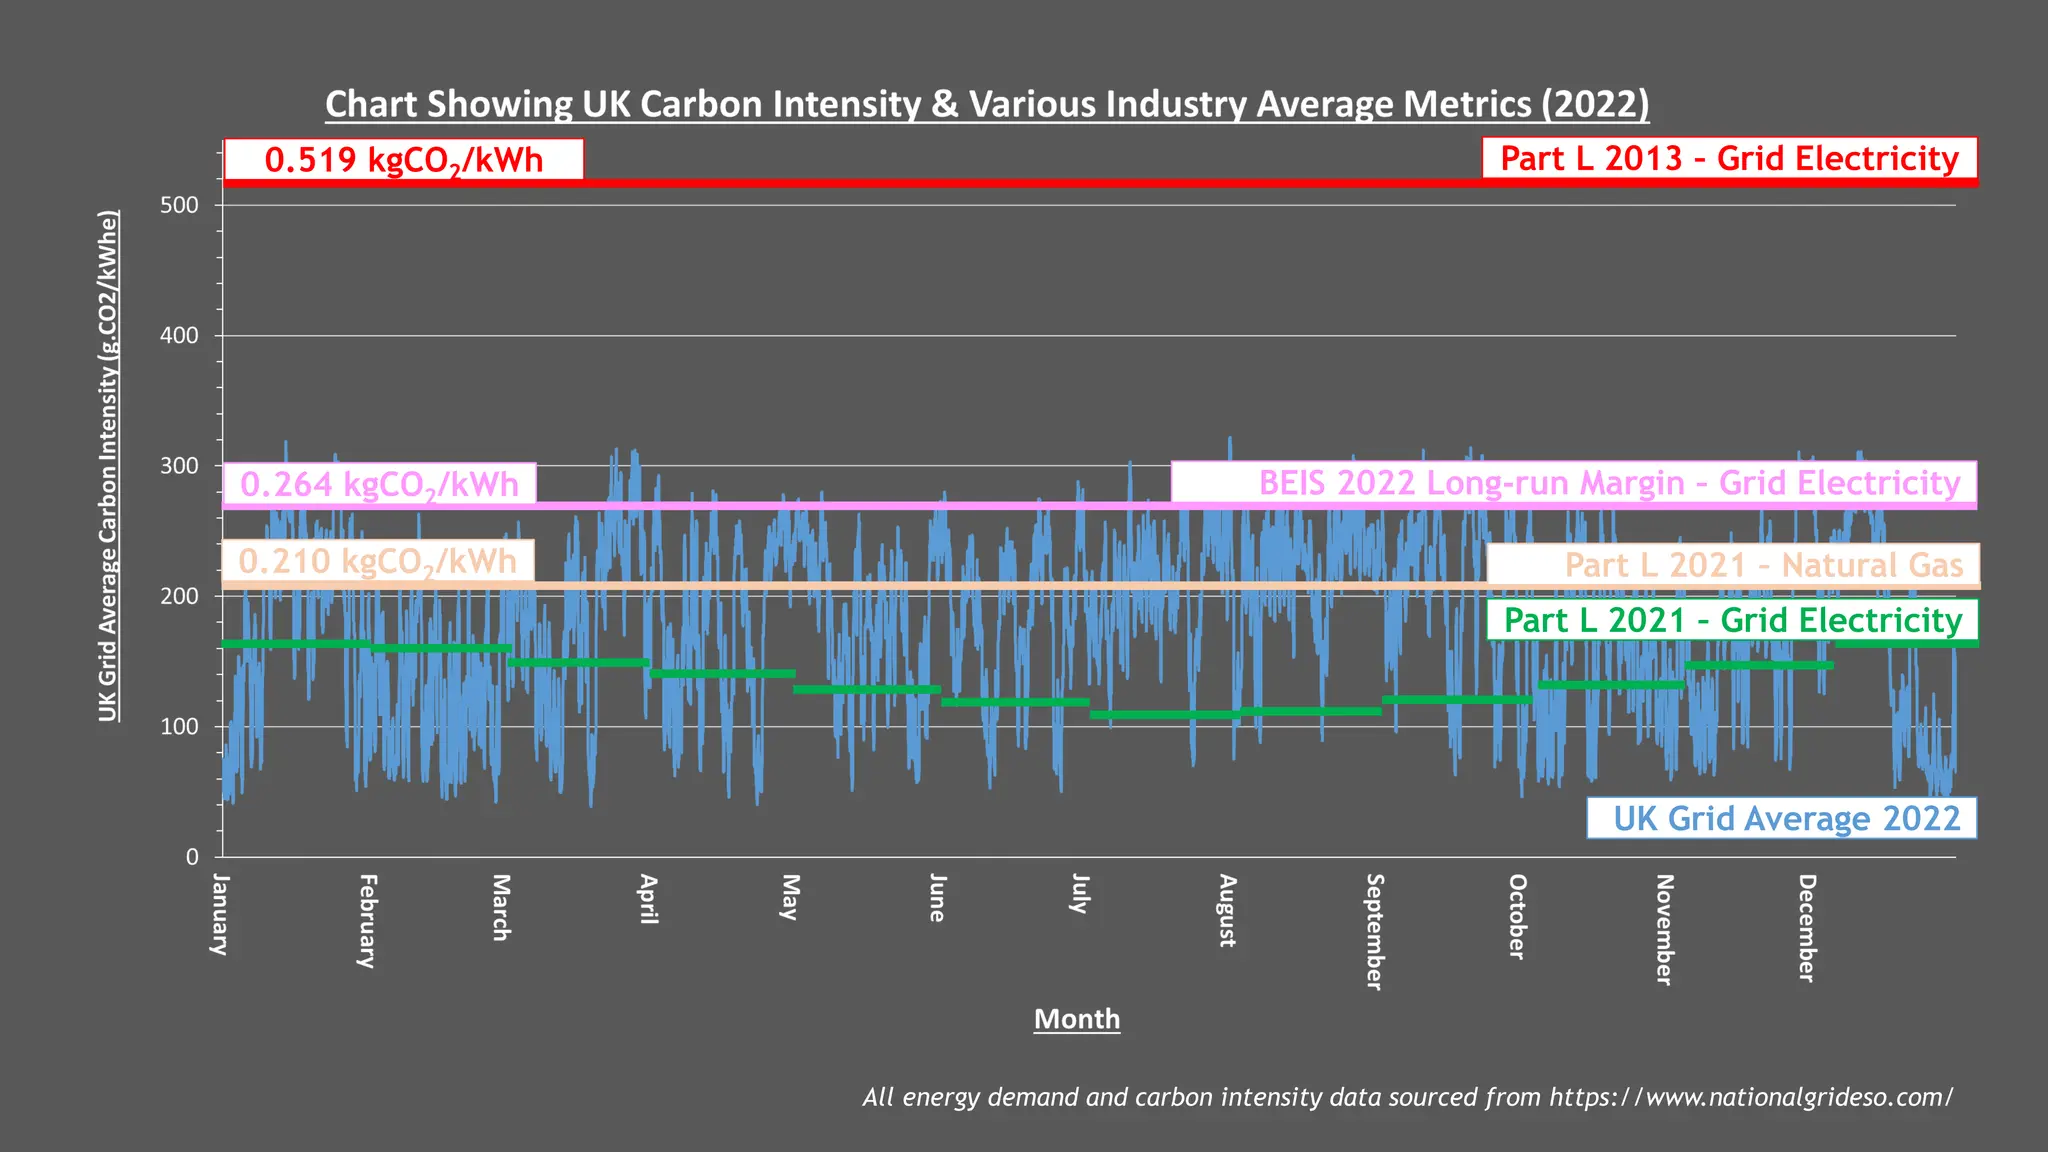
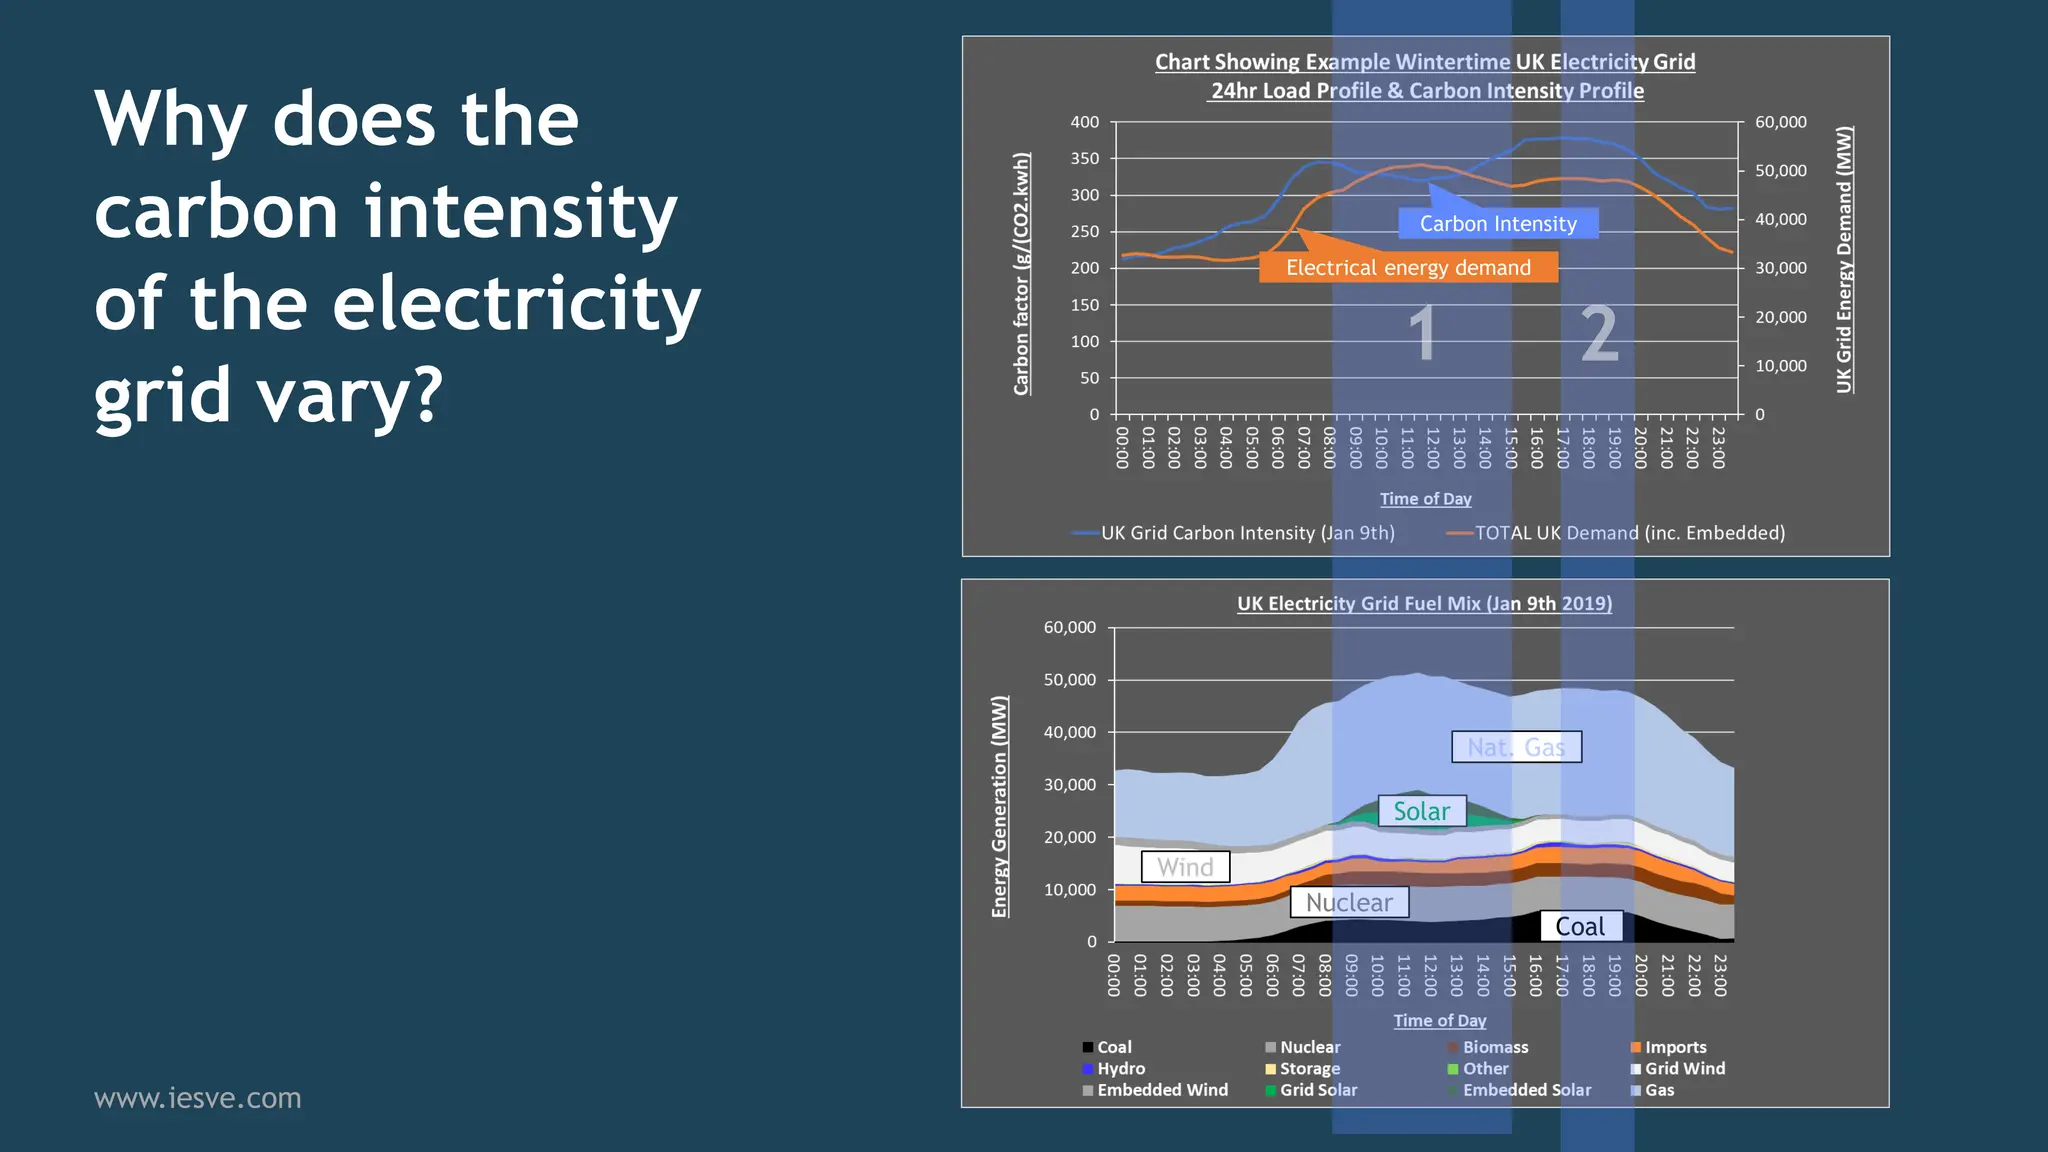
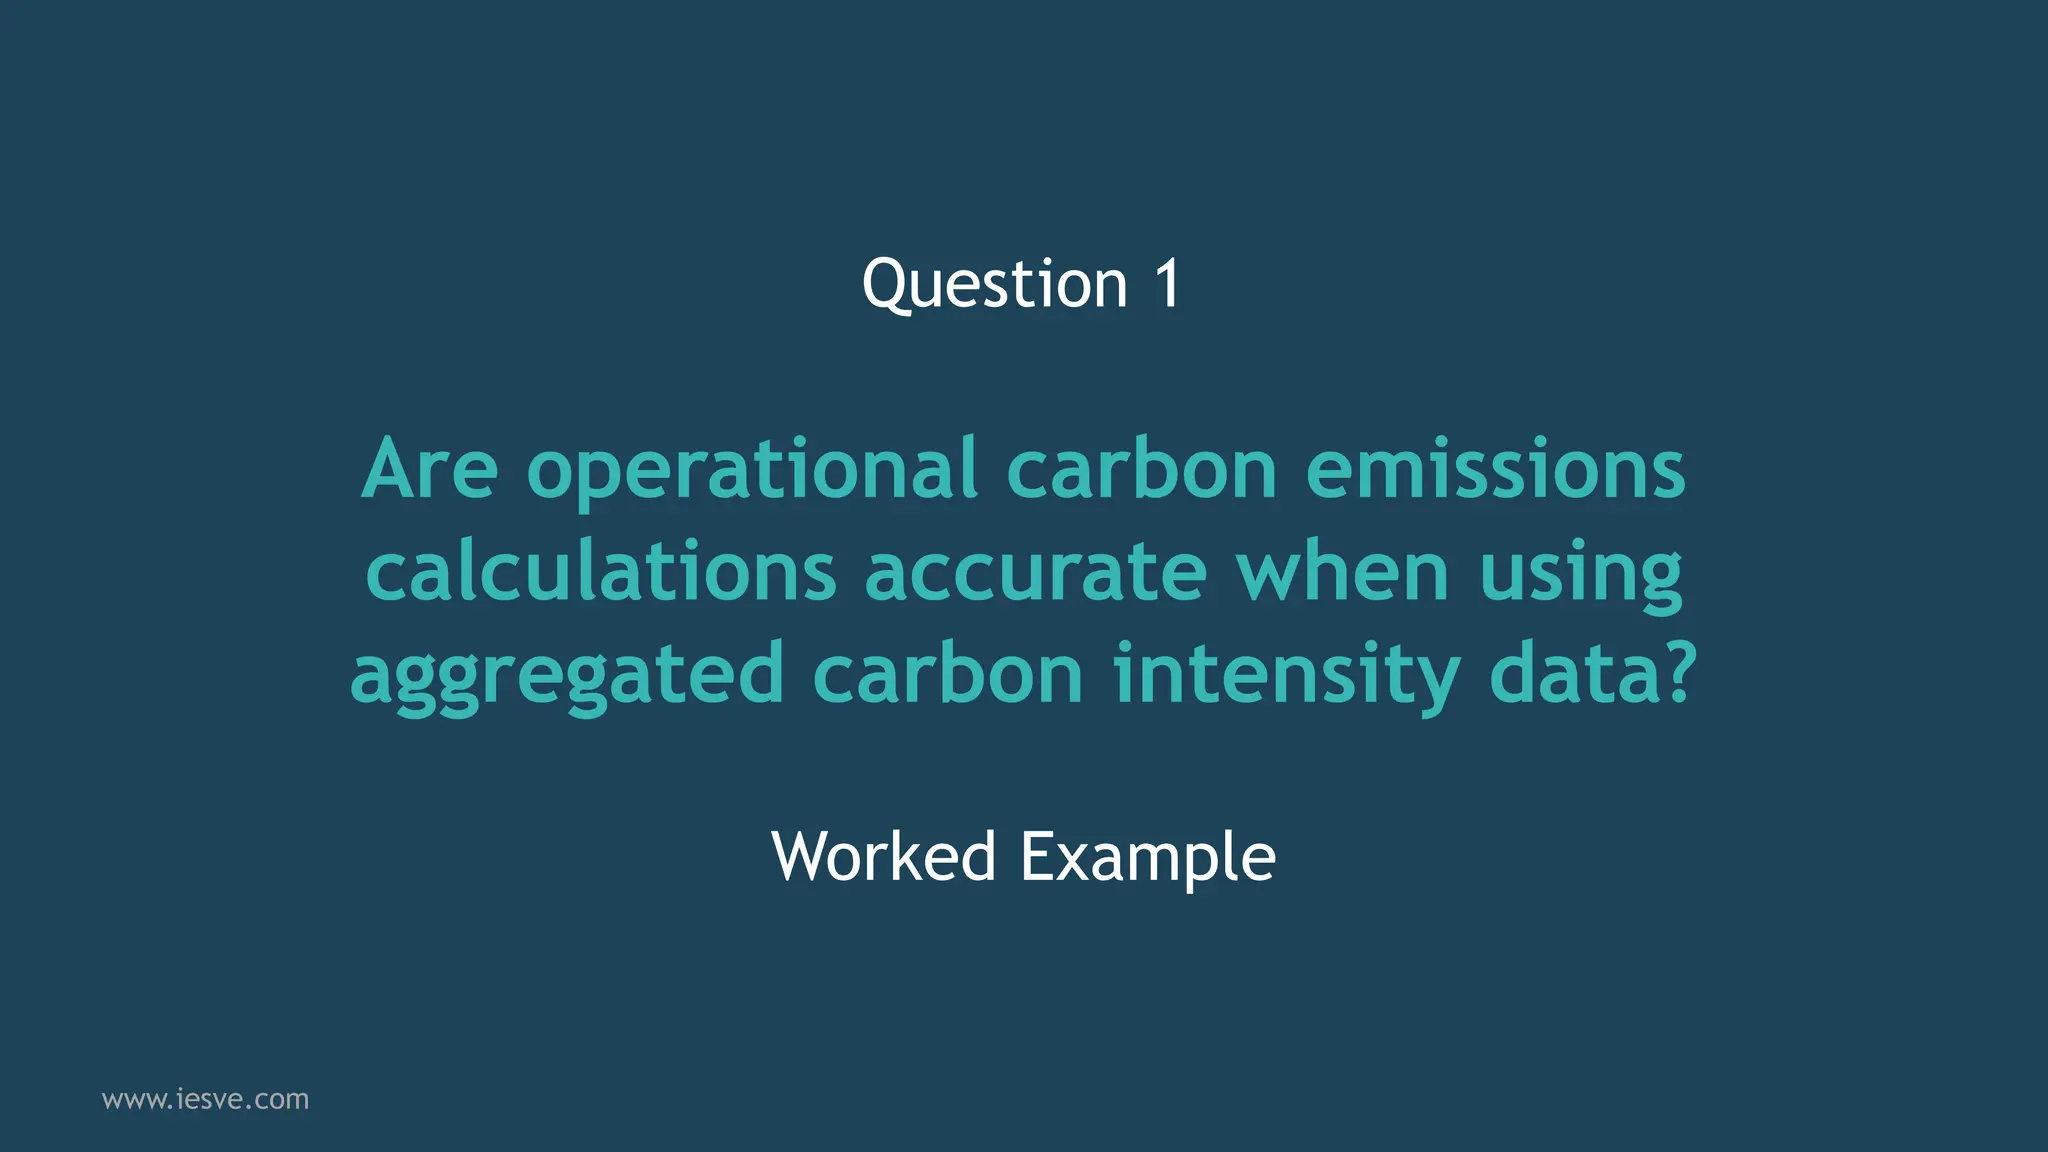
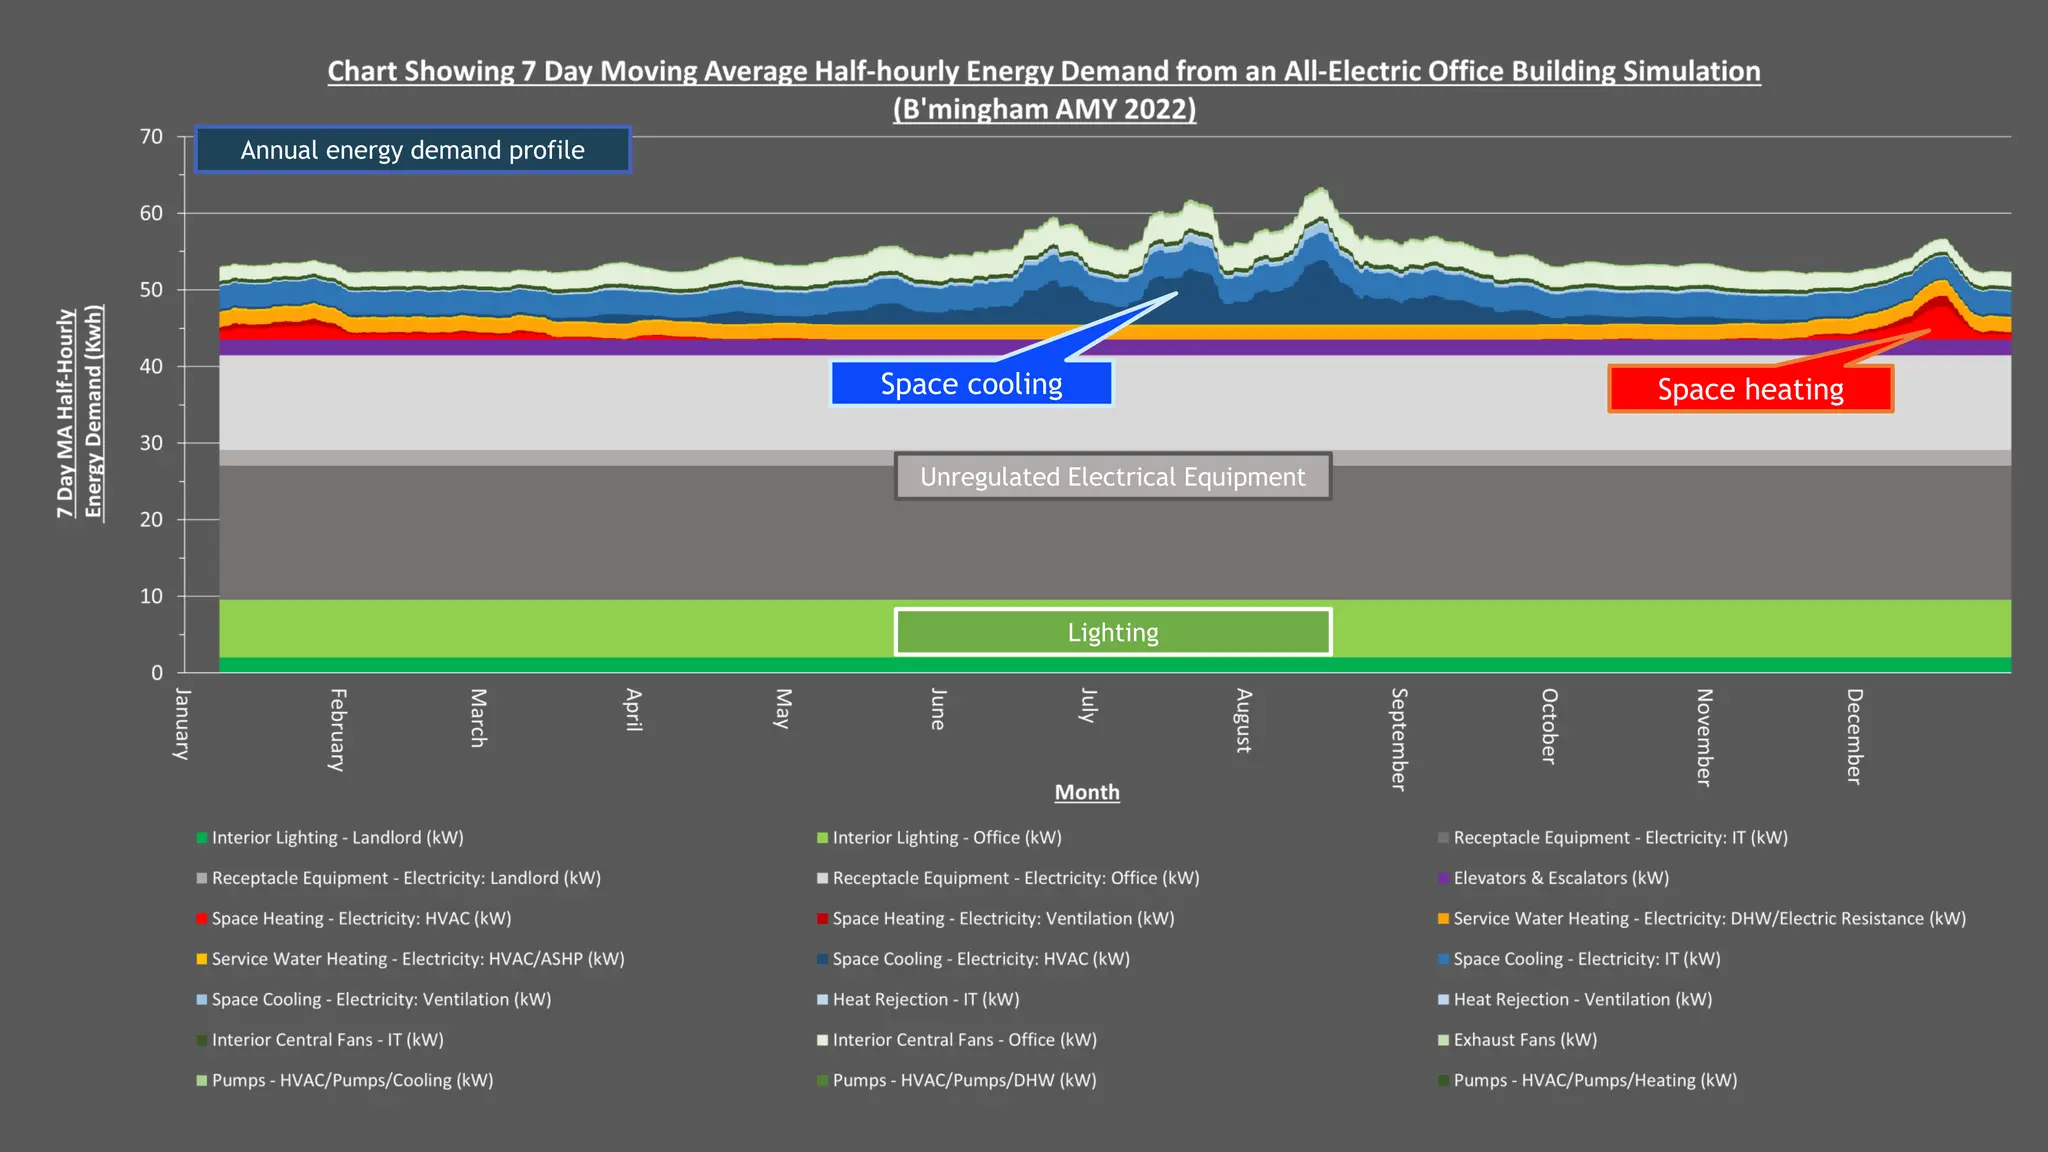
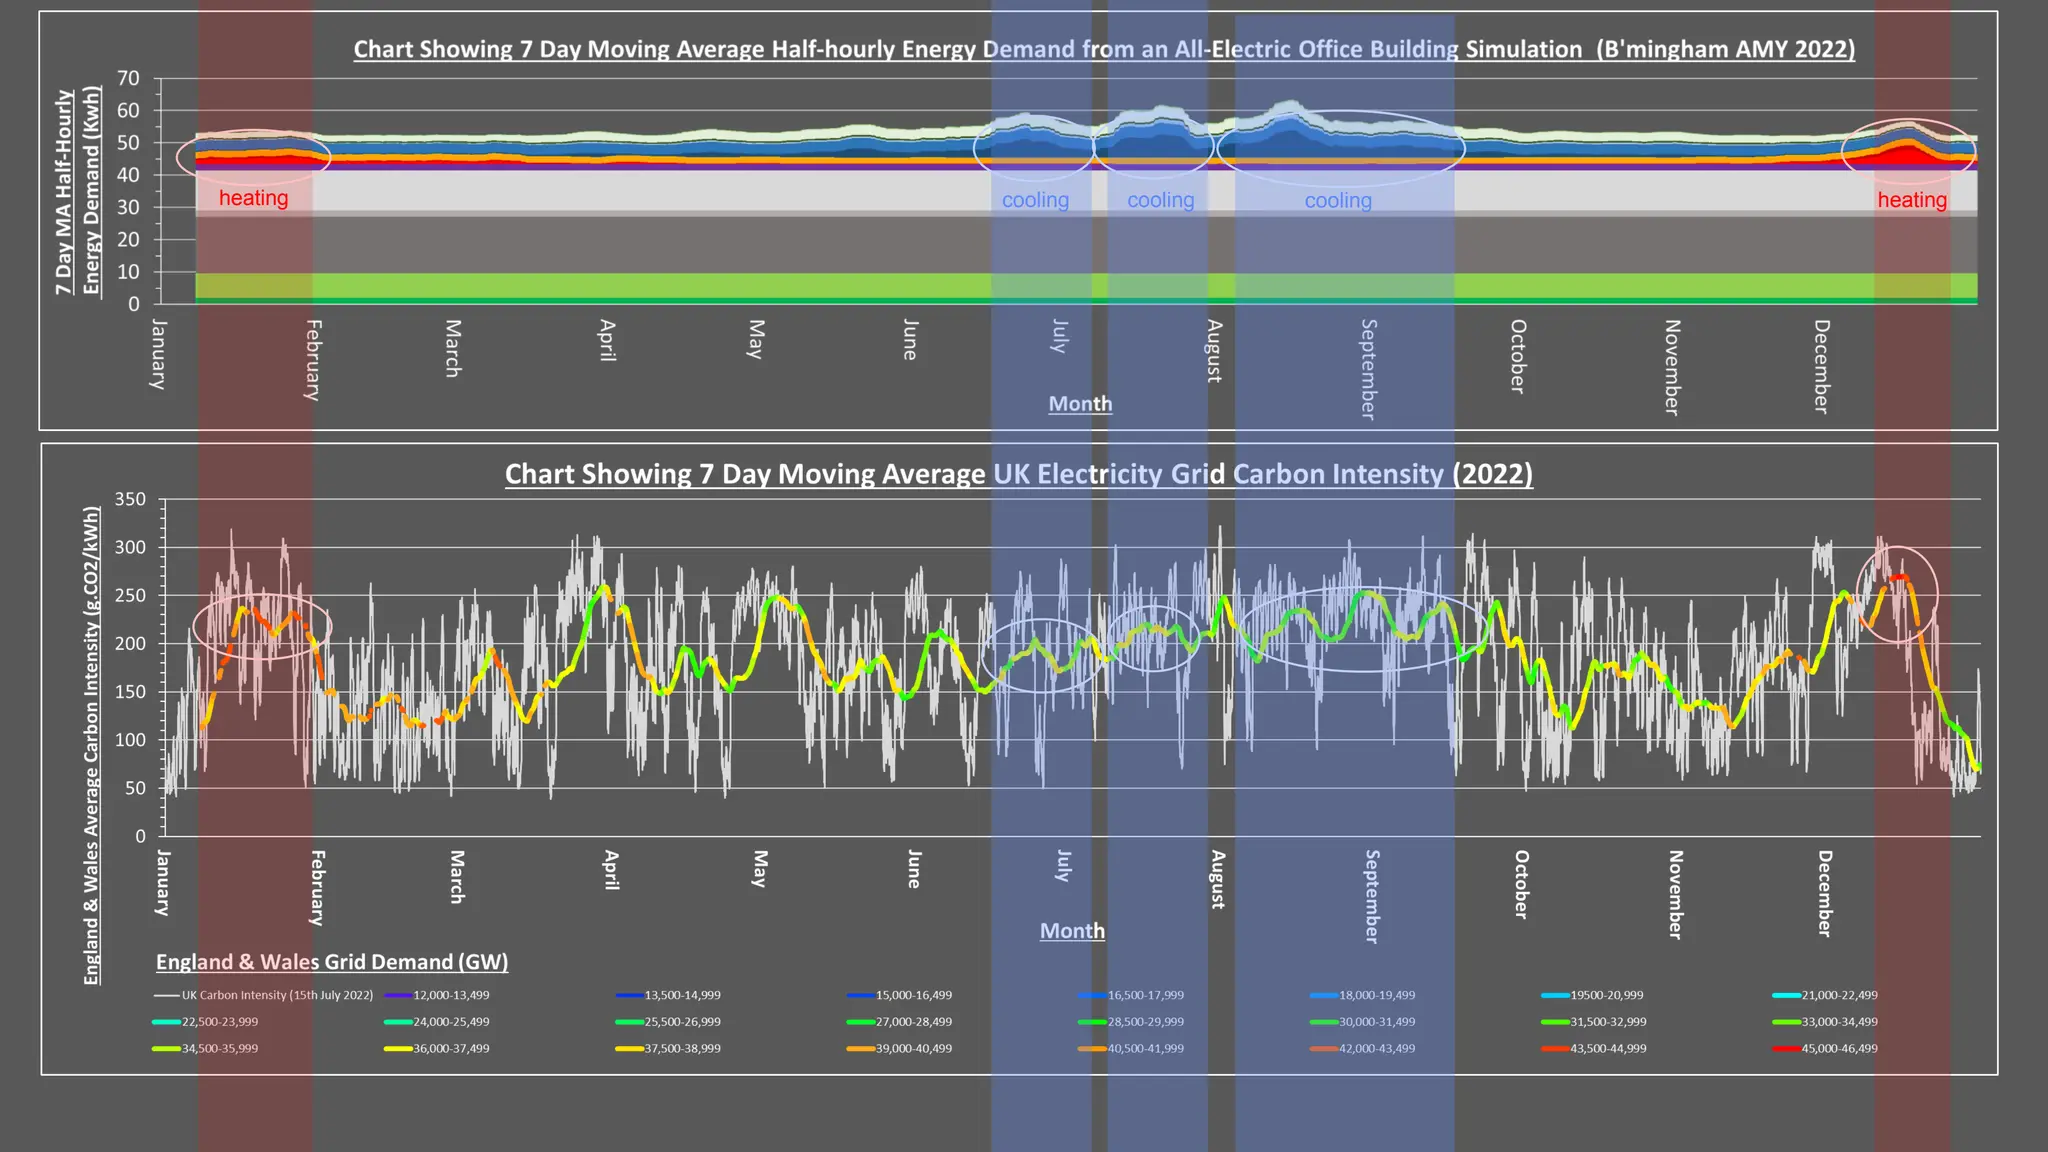
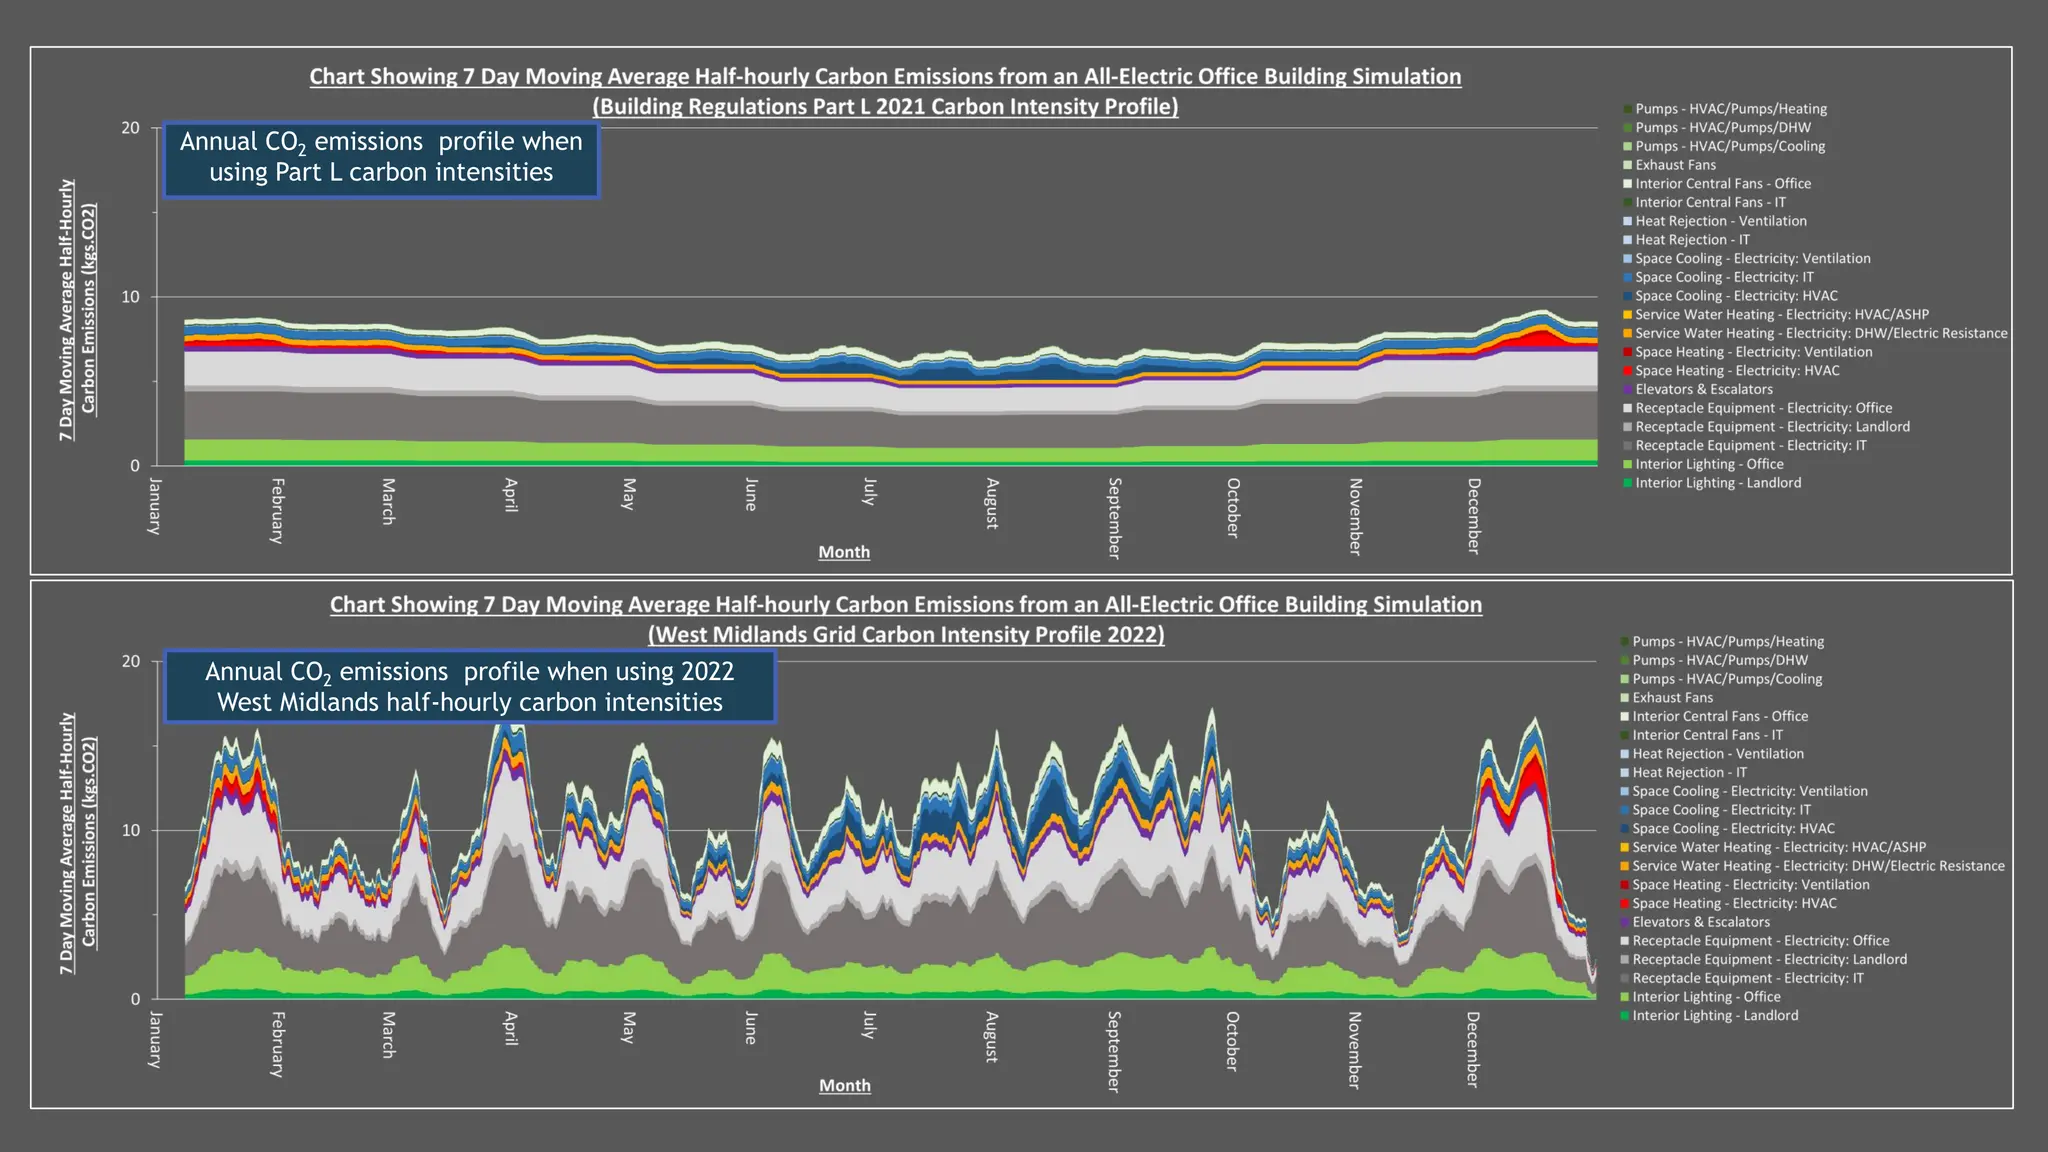
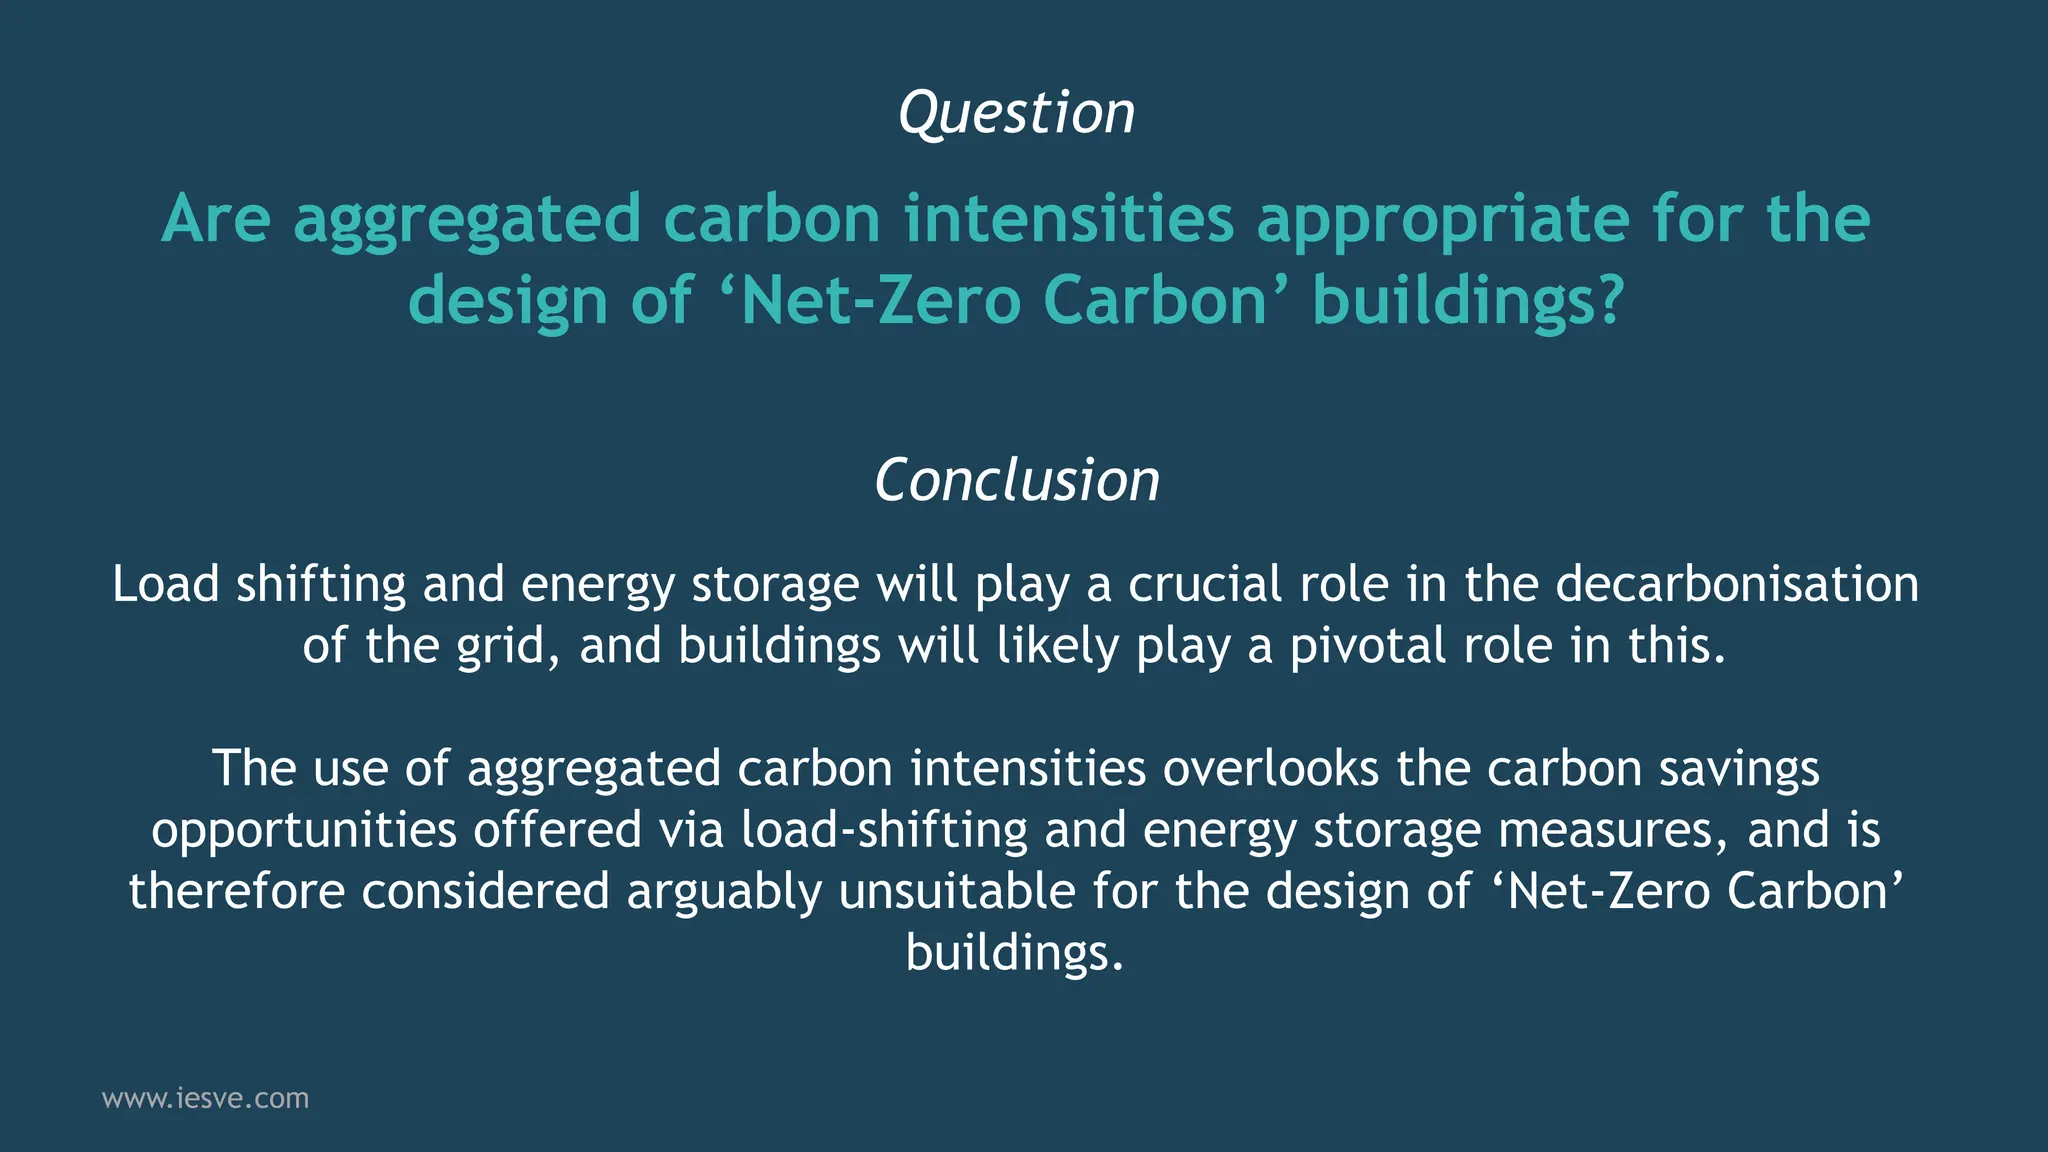
Richard Tibenham, Business Development Manager for IES Consulting explores how variable carbon intensity modelling can help improve modelling accuracy, energy grid resilience, cost, & carbon savings.
Unraveling Multimodality with Large Language Models.pdf
How Accurate are Carbon Emissions Projections?
1. How Accurate are Operational
Carbon Emissions Projections?
www.iesve.com
How variable carbon intensity modelling can help
improve modelling accuracy, energy grid resilience,
cost, & carbon savings.
Richard Tibenham – IES Consultancy
Business Development Manager
3. Agenda
▪ Overview of industry-standard carbon emissions calculation
methods.
▪ Questions;
▪ Are operational carbon emissions calculations accurate when using
aggregated carbon intensity data?
▪ Are aggregated carbon intensities appropriate for the design of ‘Net-
Zero Carbon’ buildings?
▪ Review of UK electrical grid decarbonisation and consideration as
to how this influences the design of buildings.
▪ Modelling approaches using IES software.
▪ Conclusions
www.iesve.com
5. Current Industry Standard Methodology for the
Calculation of Carbon Emissions from Buildings:
=
=
Carbon Intensity of
Fuel Source
(kgCO2/kWh)
x
Calculated Operational
Energy Demand by Fuel Type
(kWh/yr)
Total CO2 Emissions
(kgCO2/yr)
Floor Area (m2)
(kgCO2/m2.yr)
www.iesve.com
▪ Building Regulations Part L & Section 6
▪ CIBSE TM54
▪ GLA London Plan
▪ EPC’s
▪ ESOS Carbon Reporting
▪ Many Local Authority planning requirements
Used for:
6. The performance gap can
be closed using Design for
Performance (DfP)
modelling routes, such as;
- CIBSE TM54
- NABERS
- ASHRAE 90.1
Calculating Operational Energy Demand
Part L compliance assessments & EPC’s
are known to produce a ‘performance gap’.
www.iesve.com
EPC’s = ‘Performance Gaps’
DfP modelling reduces
‘Performance Gaps’
Accurate input data is critical
for accurate DfP modelling
With accurate input data, DfP energy models
can be incredibly accurate.
7. Part L 2013 – Grid Electricity
BEIS 2022 Long-run Margin – Grid Electricity
Part L 2021 – Grid Electricity
0.519 kgCO2/kWh
0.264 kgCO2/kWh
UK Grid Average 2022
Part L 2021 – Natural Gas
0.210 kgCO2/kWh
All energy demand and carbon intensity data sourced from https://www.nationalgrideso.com/
8. Part L 2021 carbon intensity profile
Average UK Grid Intensity Annual Average Average UK Grid Intensity Monthly Average
Average UK Grid Half-hourly Intensity
10. Key Questions
www.iesve.com
Question 1:
Are operational carbon emissions calculations accurate
when using aggregated carbon intensity data?
Are aggregated carbon intensities appropriate for the
design of ‘Net-Zero Carbon’ buildings?
Question 2:
11. Question 1
Are operational carbon emissions
calculations accurate when using
aggregated carbon intensity data?
Worked Example
www.iesve.com
12. ▪ Existing city-centre office building.
▪ Based on a real-world building.
▪ Subject to deep-refurbishment under
NABERS rating system.
▪ All-electric HVAC strategy.
▪ No onsite renewable energy generation.
▪ Simulated using Birmingham 2022 Actual
metrological Year (AMY) weather file.
Outline
Specification:
www.iesve.com
Example Building:
13. Annual energy demand profile
Lighting
Unregulated Electrical Equipment
Space heating
Space cooling
17. Annual CO2 emissions profile when
using Part L carbon intensities
Annual CO2 emissions profile when using 2022
West Midlands half-hourly carbon intensities
18. Are operational carbon emissions calculations accurate
when using aggregated carbon intensity data?
Question
Operational carbon emissions calculations using aggregated carbon intensity
data do not provide an accurate assessment of carbon emissions under current
grid conditions. Results from such assessments provide approximate guidance
of possible future behaviour only.
Conclusion
www.iesve.com
19. Question 2
Are aggregated carbon intensities
appropriate for the design of ‘Net-
Zero Carbon’ buildings?
Worked Example
www.iesve.com
20. To achieve ‘Net Zero’ carbon emissions when using
Part L 2021 carbon intensity assumptions,
2,719m2* of solar PV cells are required.
*Assumed to be orientated due south at an inclination of 35degs with a panel efficiency of 22%.
www.iesve.com
21. >800kW max. export to grid
240kW max import from grid
Net energy importer Jan-Mar
Net energy exporter Mar-Oct
Net energy importer Oct-Dec
This strategy effectively assumes that the grid
can behave like a battery;
• Assumes that there will be demand on the
grid to absorb surplus energy generation at
any time.
• Assumes that there will be energy supply
when needed.
• Assumes the grid has the capacity to
manage these import & export dynamics.
22. To limit energy export to <250kW a battery capacity of
10.66MWh is required.
Viable scenario: Distribution Network Operator
(DNO) request that energy export
is limited to <250kW.
www.iesve.com
24. Solar PV energy offsetting
Building Energy demand
Energy import/export
Battery Charge Status
25. The addition of the battery
marginally increases annual
carbon emissions when
calculated using Part L 2021
carbon intensity profile.
Incurs net positive carbon
emissions during Jan-May
Incurs net negative carbon
emissions during May-Dec
Theoretically ‘net-zero’ over the
full year
When assessing carbon emission using the West
Midlands Grid carbon intensity profile, the
building is shown to be carbon negative by
~10tonnes per year without a battery
specified.
-9 tonnes CO2
-3 tonnes CO2
When the battery is included, a further 33%
reduction in annual CO2 emissions is
demonstrated
26. Are aggregated carbon intensities appropriate for the
design of ‘Net-Zero Carbon’ buildings?
Question
Load shifting and energy storage will play a crucial role in the decarbonisation
of the grid, and buildings will likely play a pivotal role in this.
The use of aggregated carbon intensities overlooks the carbon savings
opportunities offered via load-shifting and energy storage measures, and is
therefore considered arguably unsuitable for the design of ‘Net-Zero Carbon’
buildings.
Conclusion
www.iesve.com
28. www.iesve.com
In the news this week:
“What consumers are being asked to buy is
energy security”.
“According to official estimates published on Tuesday, gas
plants are only expected to be used for around 700 hours in
2030 – the equivalent of about 29 days (8% of the year)”.
“The new plants will be capable of operating efficiently for just
an hour or two at a time to fill in the gaps from other power
sources, the government said”.
29. 24hr Maximum UK fuel
oil and natural gas
demand
Electrical grid 24hr
maximum demand
Additional electrical generation
capacity required if transitioning from
oil & gas boilers to heat pumps
30. UK fuel oil and natural
gas demand profile
Additional electrical energy capacity
required if transitioning from oil & gas
boilers to heat pumps
31. 2050 Grid Scenario based on CCC guidance:
- Nat gas power generation retained with
CCS.
- 6.5 x wind generation.
- Coal generation removed.
72hr mean average
electrical demand
profile
Generation insufficient to meet demand
34. NZC Building Design using Variable Carbon Intensity
Modelling :
Step 1:
www.iesve.com
Model an accurate dynamic operational energy demand profile (eg. CIBSE TM54, NABERS, ASHRAE 90.1).
Step 2:
Simulate the model using relevant half-hourly carbon intensity scenarios.
Step 3:
Evaluate carbon emissions performance against NZC design requirements.
Step 4:
Monitor real-world carbon emissions performance using live carbon-intensity data .
35. 2. VE-integrated profiles
3. User-imported profiles
Variable Carbon Intensity Modelling using IES software:
1. VE – Dynamic Simulation outputs
www.iesve.com
The VE provides output data in time steps as low as 1-minute.
The VE includes historic hourly UK carbon emission factors for a
selection of years. These can be set within Energy Source and
Meters
Users can import their own CO2 intensity profiles using APpro, before
assigning within Energy Source and Meters. The following guidance
describes the process.
36. 4. Model with real profiles Actual and forecasted data from Carbon Intensity API
Measured CO2 emissions before and after interventions
5. Monitor & Improve
www.iesve.com
Third-party data can be brought into IES’ data analysis
platform, iSCAN, through APIs. The example shows the
carbon intensity of the UK National Grid data in iSCAN.
This can be brought into the VE as a free-form profile.
This example shows a VE simulated CO2 emissions
profile required to maintain the assets decarbonisation
target compared to a measured CO2 emissions profile
(created in IES iSCAN using metered data.
iSCAN has been used to monitor CO2 performance and
alert the building operator when the measured data
deviates.
Variable Carbon Intensity Modelling using IES software:
37. Conclusions:
1. Aggregated carbon intensity data not representative of current ‘real-world’ conditions.
2. Designers cannot evaluate the carbon-savings performance of load-shifting strategies using conventional
calculation methods.
3. Load-shifting, time-of-use energy demand, and energy import & export intensity and are likely to
become more dominant factors in building design as we tend towards a NZC grid.
4. Dynamic simulations can be used to evaluate performance to a high degree of accuracy using half-hourly
carbon intensity data.
5. ‘Digital Twin’ software can be used to monitor and optimise real-time, thereby reducing the ‘compliance
gap’ with respect to carbon emissions.
www.iesve.com
38. Consultancy Support
www.iesve.com
• Geometric modelling
• UK Building Regulations modelling for Part L/Section
6/EPC/MEES compliance & strategic support
• Enhanced Building Energy Models (CIBSE TM54, NABERS,
BREEAM GN32 & ASHRAE 90.1)
• Detailed HVAC modelling adopting IES ApacheHVAC
• Net-Zero and Decarbonisation modelling for strategic
solutions and compliance (e.g. SFT NZPSB Standard)
• Part O strategy support & compliance modelling
• Daylight modelling for Planning Assessments
• CFD for Data Centres/External Comfort/Pollutant Dispersal