Downloaded 161 times


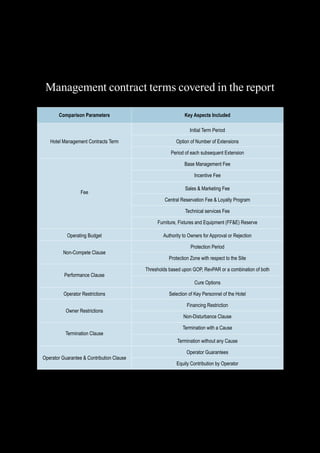
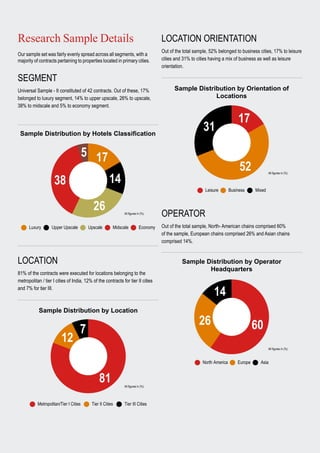
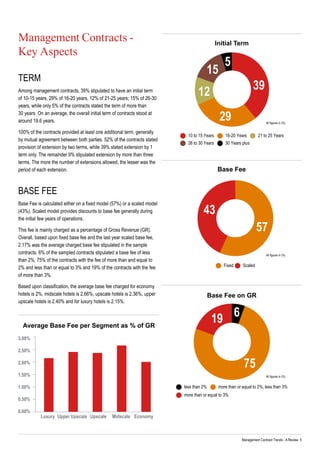
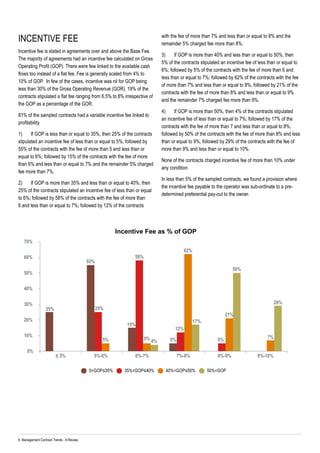


The report analyzes key trends in hotel management contracts (HMCs) in India, based on a review of 42 contracts across various hotel segments. It highlights trends in fee structures, important clauses, and discusses factors such as contract duration, base and incentive fees, and operational clauses. The findings indicate a shift in negotiation power toward hotel owners due to increased competition among operators.


![Dusit Succession Planning Presentation [Compatibility Mode]](https://cdn.slidesharecdn.com/ss_thumbnails/dusitsuccessionplanningpresentationcompatibilitymode-13377437868594-phpapp02-120522223103-phpapp02-thumbnail.jpg?width=640&height=640&fit=bounds)


