Boutique Hotel Property Investment - Opportunity Analysis
Data Visualisation Data visualisation providing key metrics for analysis, for an example boutique investment opportunity
Pricing Your Crops with Considerations from FamilyFarms GroupFamilyFarms Group
Diane Hanekamp, Strategic Marketing Manager for FamilyFarms Group, discusses practical considerations when pricing your crops as well as why having a private Resource in the grain sales arena is just a tiny part of the assets that FamilyFarms Group shares with its members.
As you begin to finalize your planting intentions for the 2014 crop year, there are some practical considerations on the subject of crop sales, over and above how you feel about price direction. These considerations are not complete and may not be appropriate for every producer, however, they come up time and time again as considerations that should be made, and are sometimes forgotten.
Rigcount Report: US (756,+02), CAN (335,-06), INT (929,+04)
US Rigcount continues to increase, while Canada rigcount shows slight drop of 6 #rigcount last week.
Major State Gain: Texas (392, +06), N. Dakota (37, +03)
Major Basin Gain: Eagle Ford (69,+05), Williston (38,+02)
IOC BINARIO DXN PLAN DE PAGOS SIN CANDADOS RUMBO A LA LIBERTADLeo Pacheco
WHATSAPP +57 3007570227
EL PLAN DE PAGOS DXN ES EL MAS CONFIABLE Y RENTABLE ADEMAS DE ESTABLE, PUEDES HACERLO DE LA FORMA QUE QUIERAS ESTE ES UN EJEMPLO BINARIO, PERO REALMENTE EL PLAN DE PAGOS IOC DE DXN ES SIN CANDADOS, FRONTALIDAD Y PROFUNDIDAD ILIMITADA, GANAS AUNQUE NO HAGAS RECOMPRAS Y SOLO POR CAMBIAR TU MARCA DE CAFÉ POR UN CAFÉ SALUDABLE CON GANODERMA.
Dashboard displaying key metrics related to management of academic poor performance within a cohort - assigning a single quantitative risk value (i.e. a 'Risk Index') derived from the assimilation and consideration of many known early warning signals.
An immersive workshop at General Assembly, SF. I typically teach this workshop at General Assembly, San Francisco. To see a list of my upcoming classes, visit https://generalassemb.ly/instructors/seth-familian/4813
I also teach this workshop as a private lunch-and-learn or half-day immersive session for corporate clients. To learn more about pricing and availability, please contact me at http://familian1.com
3 Things Every Sales Team Needs to Be Thinking About in 2017Drift
Thinking about your sales team's goals for 2017? Drift's VP of Sales shares 3 things you can do to improve conversion rates and drive more revenue.
Read the full story on the Drift blog here: http://blog.drift.com/sales-team-tips
5YR Equity ValuationNOTE Rule of thumb - 20 growth in forecast o.docxevonnehoggarth79783
5YR Equity ValuationNOTE: Rule of thumb - 20% growth in forecast of 5 years; 80% residualSelect Market Prices and Other InformationForecast Period Information (Years 1-5)Last Year's Revenue$ 3,392,000,000.00Shares Outstanding100,291,843Revenue Growth Rate 3% then 2%Debt Outstanding (assume book value = market value)$ 685,003,000.00Operating Margin (including depreciation expense)18%Cash and Marketable Securities$ 2,066,000,000.00Incremental Investment in Operating Capital10%WACC6.1%Tax Rate6%Instructions: Calculate the Stock Price based on the given assumptions and under 3 long term growth scenariosNO GROWTHFORCAST YEARSYear 1Year 2Year 3Year 4Year 5Year 6Revenue3,493,760,0003,598,572,8003,706,529,9843,780,660,5843,856,273,7953,933,399,271 Costs2,864,883,2002,950,829,6963,039,354,5873,100,141,6793,162,144,5123,225,387,402EBIT628,876,800647,743,104667,175,397680,518,905694,129,283708,011,869 Taxes35,594,42736,662,26037,762,12738,517,37039,287,71740,073,472NOPAT593,282,373611,080,844629,413,270642,001,535654,841,566667,938,397 Incremental Investment in Operating Capital59,328,23761,108,08462,941,32764,200,15465,484,1570%Perpetuity Cash Flow (forever and ever cash flows)FCF533,954,136549,972,760566,471,943577,801,382589,357,409667,938,39710,956,897,959.88PV FCF503,274,266488,587,912474,330,129456,017,650438,412,162496,867,117No Growth Strategy (Year 6 expected growth rate = 0% and WACC = ROIC)PV of Forecast2,360,622,118PV of Residual or Terminal Value8,150,635,3301) fcf yr 6 (given) 2) perp formula 3) /1+I (wacc)Perp= (fcf YR 6/wacc-g)10,956,897,959.88PV of All Future Cash Flows10,511,257,448add fcf all 6 yearsCash and Marketable Securies2,066,000,000Corporate Valuation12,577,257,448Value of Debt685,003,000Value of Equity Holders11,892,254,448Value per Equity Share118.58GROWTHFORCAST YEARSYear 1Year 2Year 3Year 4Year 5Year 6Revenue3,493,760,0003,598,572,8003,706,529,9843,780,660,5843,856,273,7953,933,399,271 Costs2,864,883,2002,950,829,6963,039,354,5873,100,141,6793,162,144,5123,225,387,402EBIT628,876,800647,743,104667,175,397680,518,905694,129,283708,011,869 Taxes35,594,42736,662,26037,762,12738,517,37039,287,71740,073,472NOPAT593,282,373611,080,844629,413,270642,001,535654,841,566667,938,397 Incremental Investment in Operating Capital59,328,23761,108,08462,941,32764,200,15465,484,157136,313,958.588%FCF166,860,000171,865,800177,021,774180,562,209184,173,454531,624,438PV FCF155,218,605148,721,082142,495,548135,205,078128,287,609145,392,624Growth Strategy (Year 6 expected growth rate = 2% and ROIC = 9.8%)PV of Forecast709,927,921PV of Residual or Terminal Value9,654,796,5761) fcf yr 6 (given) 2) perp formula 3) /1+I (wacc)Perp= (fcf YR 6/wacc-g)12,978,941,717PV of All Future Cash Flows10,364,724,497add fcf all 6 yearsCash and Marketable Securies2,066,000,000Corporate Value12,430,724,497Value of Debt685,003,000Value of Equity Holders11,745,721,497Value per Equity Share 117.12
10YR Equity Valuation NOTE: Rule of thumb - 20% growth in.
Opendatabay - Open Data Marketplace.pptxOpendatabay
Opendatabay.com unlocks the power of data for everyone. Open Data Marketplace fosters a collaborative hub for data enthusiasts to explore, share, and contribute to a vast collection of datasets.
First ever open hub for data enthusiasts to collaborate and innovate. A platform to explore, share, and contribute to a vast collection of datasets. Through robust quality control and innovative technologies like blockchain verification, opendatabay ensures the authenticity and reliability of datasets, empowering users to make data-driven decisions with confidence. Leverage cutting-edge AI technologies to enhance the data exploration, analysis, and discovery experience.
From intelligent search and recommendations to automated data productisation and quotation, Opendatabay AI-driven features streamline the data workflow. Finding the data you need shouldn't be a complex. Opendatabay simplifies the data acquisition process with an intuitive interface and robust search tools. Effortlessly explore, discover, and access the data you need, allowing you to focus on extracting valuable insights. Opendatabay breaks new ground with a dedicated, AI-generated, synthetic datasets.
Leverage these privacy-preserving datasets for training and testing AI models without compromising sensitive information. Opendatabay prioritizes transparency by providing detailed metadata, provenance information, and usage guidelines for each dataset, ensuring users have a comprehensive understanding of the data they're working with. By leveraging a powerful combination of distributed ledger technology and rigorous third-party audits Opendatabay ensures the authenticity and reliability of every dataset. Security is at the core of Opendatabay. Marketplace implements stringent security measures, including encryption, access controls, and regular vulnerability assessments, to safeguard your data and protect your privacy.
Levelwise PageRank with Loop-Based Dead End Handling Strategy : SHORT REPORT ...Subhajit Sahu
Abstract — Levelwise PageRank is an alternative method of PageRank computation which decomposes the input graph into a directed acyclic block-graph of strongly connected components, and processes them in topological order, one level at a time. This enables calculation for ranks in a distributed fashion without per-iteration communication, unlike the standard method where all vertices are processed in each iteration. It however comes with a precondition of the absence of dead ends in the input graph. Here, the native non-distributed performance of Levelwise PageRank was compared against Monolithic PageRank on a CPU as well as a GPU. To ensure a fair comparison, Monolithic PageRank was also performed on a graph where vertices were split by components. Results indicate that Levelwise PageRank is about as fast as Monolithic PageRank on the CPU, but quite a bit slower on the GPU. Slowdown on the GPU is likely caused by a large submission of small workloads, and expected to be non-issue when the computation is performed on massive graphs.
Chatty Kathy - UNC Bootcamp Final Project Presentation - Final Version - 5.23...John Andrews
SlideShare Description for "Chatty Kathy - UNC Bootcamp Final Project Presentation"
Title: Chatty Kathy: Enhancing Physical Activity Among Older Adults
Description:
Discover how Chatty Kathy, an innovative project developed at the UNC Bootcamp, aims to tackle the challenge of low physical activity among older adults. Our AI-driven solution uses peer interaction to boost and sustain exercise levels, significantly improving health outcomes. This presentation covers our problem statement, the rationale behind Chatty Kathy, synthetic data and persona creation, model performance metrics, a visual demonstration of the project, and potential future developments. Join us for an insightful Q&A session to explore the potential of this groundbreaking project.
Project Team: Jay Requarth, Jana Avery, John Andrews, Dr. Dick Davis II, Nee Buntoum, Nam Yeongjin & Mat Nicholas
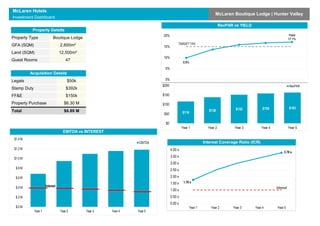
1. McLaren Hotels
Investment Dashboard
McLaren Boutique Lodge | Hunter Valley
Property Type Boutique Lodge
GFA (SQM) 2,800m²
Land (SQM) 12,500m²
Guest Rooms 47
Property Details
Legals $50k
Stamp Duty $392k
FF&E $150k
Property Purchase $6.30 M
Total $6.89 M
Acquisition Details
1.76 x
3.78 x
Interest
0.00 x
0.50 x
1.00 x
1.50 x
2.00 x
2.50 x
3.00 x
3.50 x
4.00 x
Year 1 Year 2 Year 3 Year 4 Year 5
Interest Coverage Ratio (ICR)
9.9%
Yield
17.1%
TARGET 15%
0%
5%
10%
15%
20%
$116
$138 $152 $159 $163
$0
$50
$100
$150
$200
Year 1 Year 2 Year 3 Year 4 Year 5
RevPAR
RevPAR vs YIELD
EBITDA vs INTEREST
Interest
$.0 M
$.2 M
$.4 M
$.6 M
$.8 M
$1.0 M
$1.2 M
$1.4 M
Year 1 Year 2 Year 3 Year 4 Year 5
EBITDA
2. McLaren Hotels
Investment Dashboard
McLaren Boutique Lodge | Hunter Valley
$5.5 M
$5.3 M
$5.0 M
$4.6 M
$4.2 M
$3.8 M
$.0 M
$1.0 M
$2.0 M
$3.0 M
$4.0 M
$5.0 M
$6.0 M
Year 0 Year 1 Year 2 Year 3 Year 4 Year 5
DEBT AMORTISATION
$k
$10k
$20k
$30k
$40k
$50k
$60k
$70k
$80k
$90k
$100k
Year 1 Year 2 Year 3 Year 4 Year 5
Revenue per Room Cost per Room
REVENUE per ROOM vs COST per ROOM
Investment Stats Year 1 Year 2 Year 3 Year 4 Year 5
Total Revenue $2.96 M $3.47 M $3.81 M $3.99 M $4.11 M
Revenue Growth - YoY - 17% 10% 5% 3%
EBITDA $682k $946k $1.09 M $1.15 M $1.18 M
EBITDA Growth - YoY - 39% 16% 5% 2%
Interest Expense (388k) (382k) (364k) (340k) (312k)
Net Cash Flow before Tax $294k $565k $730k $813k $868k
Interest Coverage Ratio (ICR) 1.76 x 2.48 x 3.00 x 3.39 x 3.78 x
YIELD (ROCE) 9.9% 13.7% 15.9% 16.7% 17.1%
Return on Equity Invested 21.3% 41.0% 52.9% 59.0% 63.0%
$4.4 M
Debt
$1.1 M
$1.4 M Equity
$.0 M
$1.0 M
$2.0 M
$3.0 M
$4.0 M
$5.0 M
$6.0 M
$7.0 M
$8.0 M
Equity Contribution $1.38 M
Mezzanine Debt $1.10 M
Senior Debt $4.41 M
Total Investment $6.89 M
Debt : Equity Ratio 80 : 20
Funding Breakdown