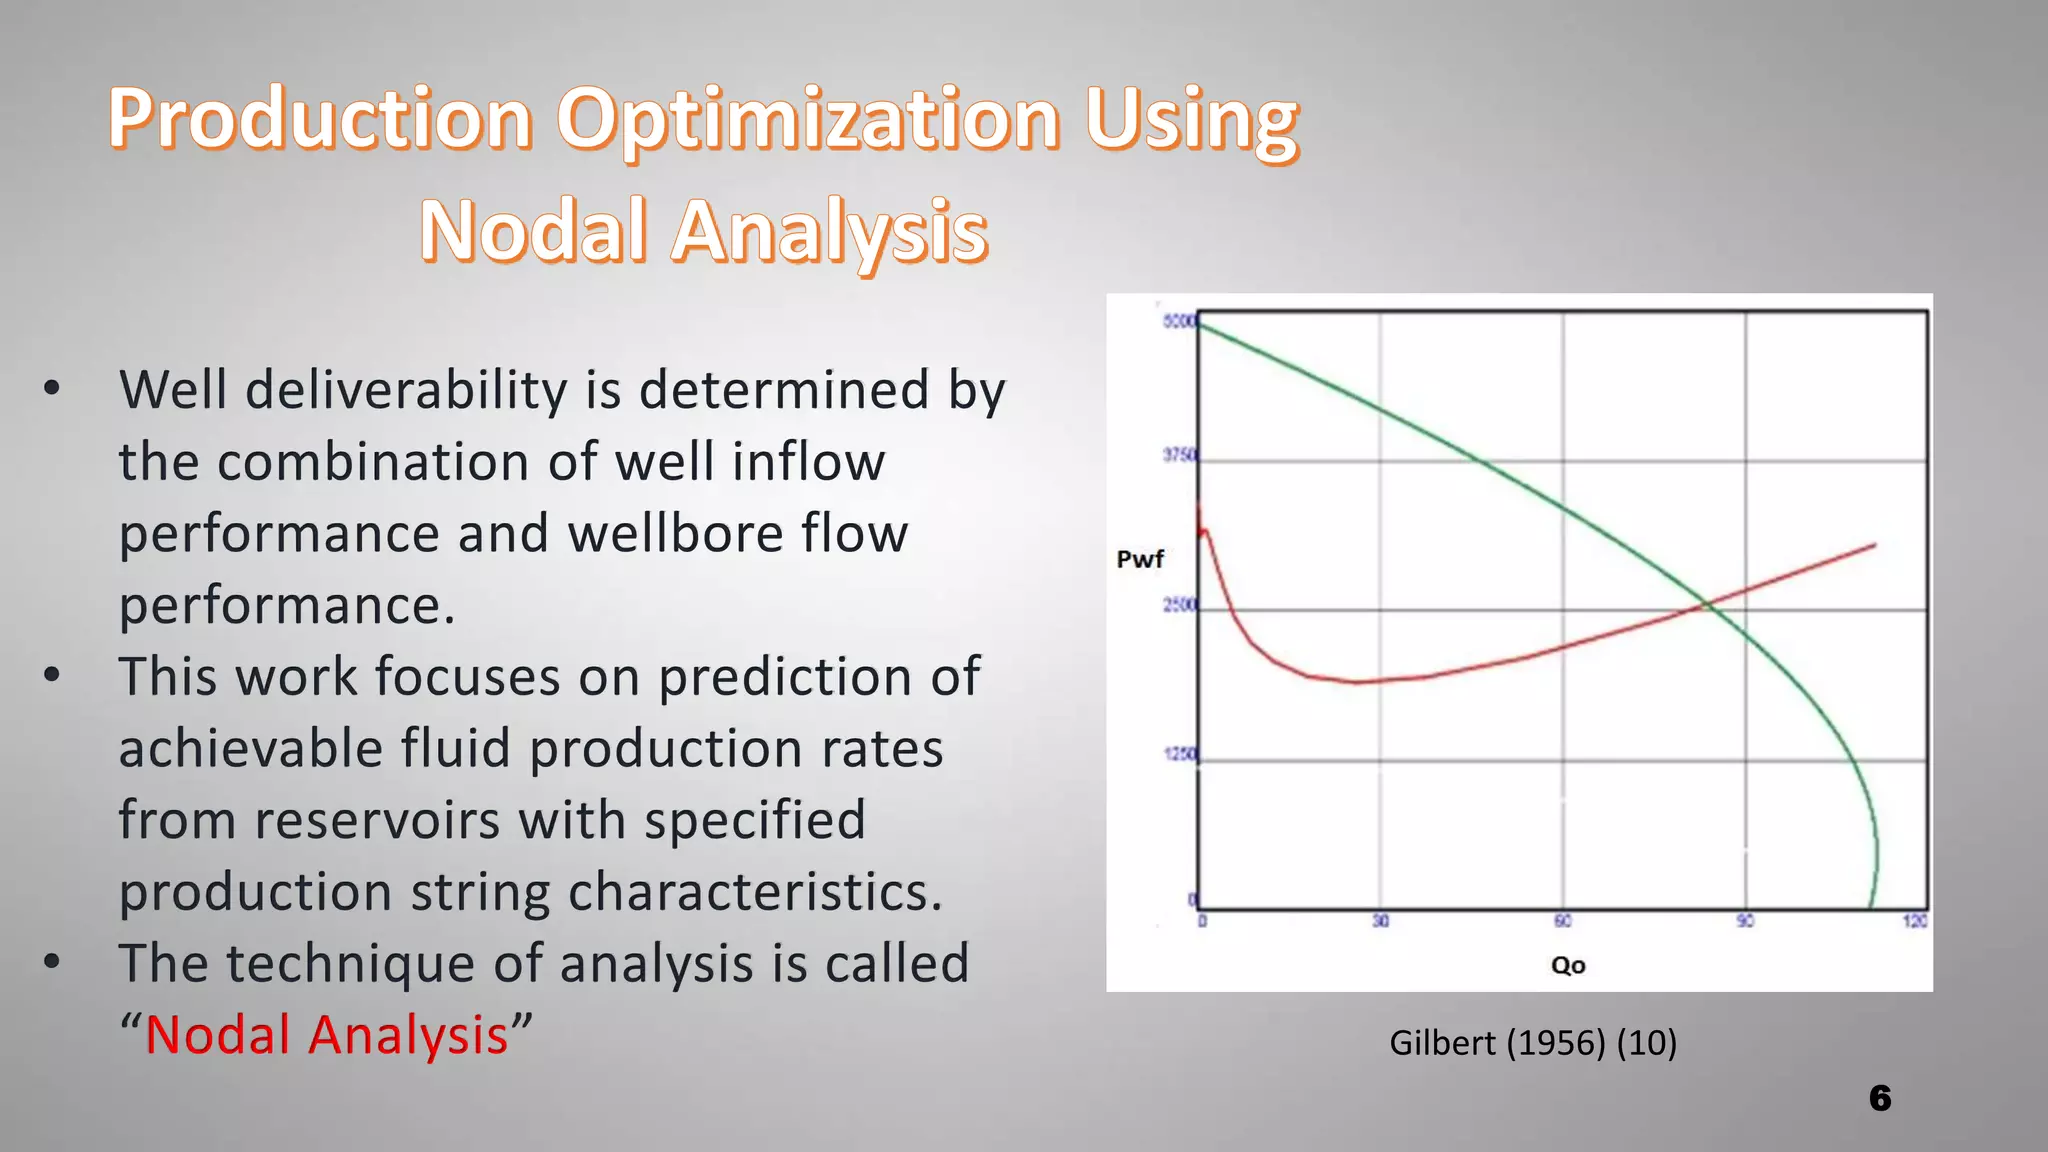
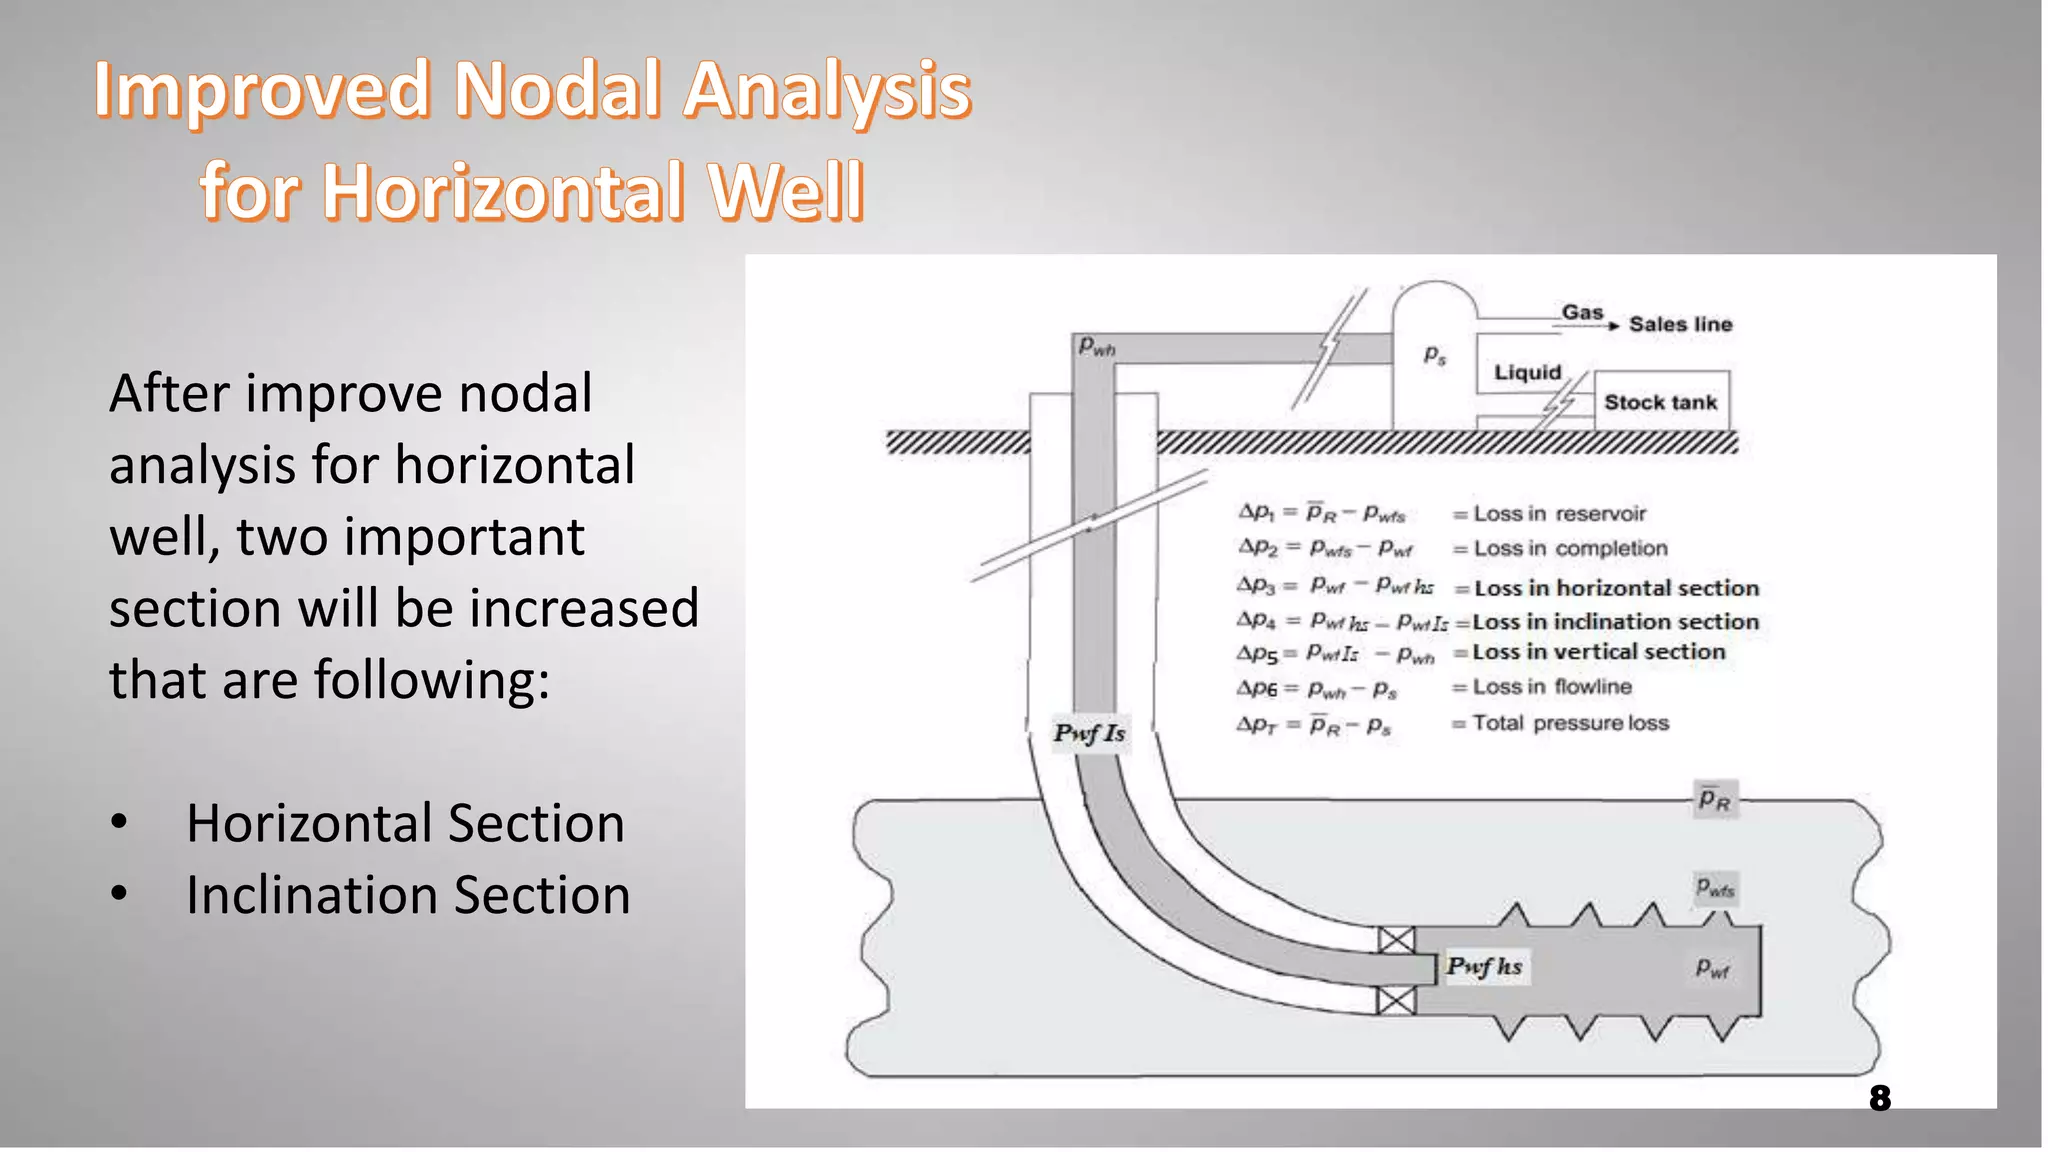
• Aim
• What is Optimization?
• What is Production Optimization?
• Production Optimization Using Nodal Analysis
• Improved Nodal Analysis for Horizontal Well
• Factors Affects Pressure Losses in Horizontal Section
• Factors Affects Pressure Losses in Inclination Section
• What is PROSPER?
• Applications of PROSPER
• Results
• Unimaginable Point!
• Conclusion
• References 2
The aim of this project is to optimize the production in horizontal
wells, there are several methods to optimize production in
horizontal wells. One of the most effective way to achieve the
gaol is increasing horizontal well section.
3
Optimization is an act, process,
or methodology of making as
fully perfect, functional, or
effective as possible, specifically
the mathematical procedures
involved in this.
4
• The term ‘‘production optimization’’
has been used to describe different
processes in the oil and gas industry.
• Production Optimization means
Balance between Production rate /
Deliverability and demand.
• Production Optimization includes a
good understanding about Production
Systems and Reservoir Fluid.
5
• Well deliverability is determined by
the combination of well inflow
performance and wellbore flow
performance.
• This work focuses on prediction of
achievable fluid production rates
from reservoirs with specified
production string characteristics.
• The technique of analysis is called
“Nodal Analysis”
6
Gilbert (1956) (10)
7production optimization using Nodal Analysis (2)
After improve nodal
analysis for horizontal
well, two important
section will be increased
that are following:
• Horizontal Section
• Inclination Section
8
1. The characteristics and physical
properties of the fluid.
2. Friction in pipes.
3. Energy losses in fitting.
4. Pressure drop through equipment.
5. The distance or length the fluid must
travel.
6. Diameter change of the pipe.
9
Factors affects pressure losses in horizontal
section same as bent section, only one factor
will be added which is Pressure Losses
whenever the flow direction changes.
The pressure loss in a bend can thus
be calculated as:
10
• PROSPER is a well performance, design and
optimization program.
• PROSPER is designed to allow the building of reliable
and consistent well models, with the ability to
address each aspect of well bore modelling PVT, VLP
correlations and IPR.
• PROSPER enables detailed surface pipeline
performance and design: Flow Regimes, pipeline
stability, Slug Size and Frequency.
11
• Design and optimize well completions including
multi-lateral, multilayer and horizontal wells.
• Design and optimize tubing and pipeline sizes.
• Design, diagnose and optimize Gas lifted, Hydraulic
pumps and ESP wells.
• Calculate pressure losses in wells, flow lines and
across chokes.
• Predict flowing temperatures in wells and pipelines.
• Calculate total skin and determine breakdown.
• Allocate production between wells.
12
D:Koya UniProd Eng II - 2015-2016projec tH.W OptPROSPE R ModelT 04_HORIZONT ALOILWE LL.Out
0 21000 42000 63000 84000
0
1000
2000
3000
4000
IPR plot Horizontal Well - No Flow Boundaries (HW 05/14/2016 - 11:58:15)
Rate (S T B/day)
Pressure(psig)
Inflow T ype Single Branch
Completion Cased Hole
Sand Control None
Gas Coning No
Reservoir Model Horizontal Well - No Flow Boundaries
M& G Skin Model Enter Skin B y Hand
Compaction Permeability Reduction Model No
Relative P ermeability No
Formation PI 41.07 (ST B /day/ps i)
Absolute Open Flow (AOF)82543.8 (ST B /day)
Reservoir Pres sure4000.00 (ps ig)
Reservoir T emperature200.00 (deg F)
Water Cut 0 (perc ent)
T otal GOR400.00 (sc f/S T B)
Reservoir Permeability150.00 (md)
Reservoir T hic knes s 100.0 (feet)
Wellbore Radius 0.354 (feet)
Reservoir Porosity (fraction)
Horizontal Anis otropy 1 (fraction)
Vertic al A nisotropy 0.1 (fraction)
Length Of Well2000.0 (feet)
Reservoir Length5000.0 (feet)
Reservoir Width5000.0 (feet)
Dis tanc e From Length E dge T o Centre Of Well2500.0 (feet)
Dis tanc e From Width Edge T o Centre Of Well2500.0 (feet)
Dis tanc e From Bottom T o Centre Of Well 50.0 (feet)
Skin 5
AOF : 82543.8 (ST B/day)
Formation PI : 41.07 (ST B/day/psi)
SK IN : 5
Results: IPR curve
13
Results: Well Capacity
0 10000 20000 30000 40000
0
1500
3000
4500
6000
Inf low (IPR) v Outf low (VLP) Plot (HW 05/15/2016 - 08:35:04)
Liquid Rate (STB/day)
Pressure(psig)
PVT Method Black Oil
Fluid Oil
Flow Type Tubing
Top Node Pressure250.00 (psig)
Water Cut 0 (percent)
Bottom Measured Depth8050.0 (feet)
Inflow Type Single Branch
Completion Cased Hole
Sand Control None
Solution Point
Liquid Rate18453.6 (STB/day)
Oil Rate18453.6 (STB/day)
Water Rate 0 (STB/day)
Gas Rate 7.381 (MMscf/day)
Solution Node Pressure3354.18 (psig)
dP Friction 823.12 (psi)
dP Gravity2237.76 (psi)
dP T otal Skin 196.48 (psi)
dP Perforation 0 (psi)
dP Damage 0 (psi)
dP Completion 0 (psi)
Completion Skin 5.00
Total Skin 5.00
Wellhead Liquid Density 52.761 (lb/ft3)
Wellhead Gas Density0.87847 (lb/ft3)
Wellhead Liquid Viscosity 2.3440 (centipoise)
Wellhead Gas Viscosity0.012674 (centipoise)
Wellhead Superficial Liquid Velocity 14.432 (ft/sec)
Wellhead Superficial Gas Velocity 56.913 (ft/sec)
Wellhead Z Factor0.96557
Wellhead Interfacial Tension14.9531 (dyne/cm)
Wellhead Pressure 250.00 (psig)
Wellhead Temperature 172.16 (deg F)
First Node Liquid Density 52.761 (lb/ft3)
First Node Gas Density0.87847 (lb/ft3)
First Node Liquid Viscosity 2.3440 (centipoise)
First Node Gas Viscosity0.012674 (centipoise)
First Node Superficial Liquid Velocity 14.432 (ft/sec)
First Node Superficial Gas Velocity 56.913 (ft/sec)
First Node Z Factor0.96557
First Node Interfacial T ension14.9531 (dyne/cm)
First Node Pressure 250.00 (psig)
First Node Temperature 172.16 (deg F)
E
E
E
14
Results: Well Length Optimization Reuslts
0 10000 20000 30000 40000
0
1500
3000
4500
6000
Inf low (IPR) v Outf low (VLP) Plot (HW 05/14/2016 - 12:04:10)
Liquid Rate (STB/day)
Pressure(psig)
PVT Method Black Oil
Fluid Oil
Top Node Pressure250.00 (psig)
Water Cut 0 (percent)
Inflow Type Single Branch
Completion Cased Hole
Variables
1:Well Length (feet)
1 2 3
0=500.0
1=1000.0
2=1500.0
3=2000.0
4=2500.0
5=3000.0
0
0
E
E
E
1
1
E
E
E
2
2
E
E
E
3
3
E
E
E
4
4
E
E
E
5
5
E
E
E
15
Results: Well Length Sensitivity Results
16
Results: Well Length Sensitivity Results
0
500
1000
1500
2000
2500
3000
3500
4000
0 500 1000 1500 2000 2500 3000 3500
Pwf
Well Length
17
Results: Well Length Sensitivity Data Results
Well length in
ft
Pressure in
psi
Production rate
STB/day
500 2706.98 11689.5
1000 3036.53 15233.2
1500 3226.67 17152.5
2000 3354.18 18453.6
2500 3448.84 19379.3
3000 3522.08 20062.4
18
• With increasing length, pressure
drop must be increased.
• Also with increasing length, Pwf &
Flowrate will be increased.
19
20
well length Pwf dp friction dp gravity
500 2706.98 388.5 2045.59
1000 3036.53 600.26 2153.6
1500 3226.67 728.4 2207.15
2000 3354.18 823.1 2237.77
2500 3448.84 892.15 2259.63
3000 3522.08 944.54 2275.82
21
• Horizontal wells are better than vertical.
• To optimize production in horizontal wells, many factors can
be considered.
• The production can be optimized by increasing of length of
horizontal section.
• The PROSPER can be helpful to achieve the results, it may be
used to choose the best result.
22
1. Petroleum Production Engineering, A Computer-Assisted Approach by
Boyun Guo, PH.D. , William C. Lyons, PH.D. and Ali Ghalambor, PH.D.
2. Production Optimization Using Nodal Analysis by H. Dale Beggs, 1991
Oklahoma.
3. Development and Applications of Production Optimization Techniques by
PENGJU WANG, 2003 Stanford.
4. Pressure drop evaluation along pipelines
https://www.scribd.com/doc/284696108/Theory
5. Fluid-Flow Theory, Energy Losses in Flow
http://www.nzifst.org.nz/unitoperations/flfltheory5.htm#frictioninpipes
6. Pressure Loss Form Fittings – Expansion and Reduction in Pipe Size
https://neutrium.net/fluid_flow/pressure-loss-from-fittings-expansion-
and-reduction-in-pipe-size/
23
7. Flow in Pipes
http://www.uomisan.edu.iq/eng/ar/admin/pdf/26059867395.pdf
8. Bends, Flow and Pressure Drop in by Jayanti, Sreenivas
http://www.thermopedia.com/content/577/
9. Its application to well producing system was first proposed by Gilbert
(1954)
10. PROSPER, Petroleum Experts, User Manual, Version 11.5, January 2010
24
25

Horizontal Well Performance Optimization Analysis

  • 2.
    • Aim • Whatis Optimization? • What is Production Optimization? • Production Optimization Using Nodal Analysis • Improved Nodal Analysis for Horizontal Well • Factors Affects Pressure Losses in Horizontal Section • Factors Affects Pressure Losses in Inclination Section • What is PROSPER? • Applications of PROSPER • Results • Unimaginable Point! • Conclusion • References 2
  • 3.
    The aim ofthis project is to optimize the production in horizontal wells, there are several methods to optimize production in horizontal wells. One of the most effective way to achieve the gaol is increasing horizontal well section. 3
  • 4.
    Optimization is anact, process, or methodology of making as fully perfect, functional, or effective as possible, specifically the mathematical procedures involved in this. 4
  • 5.
    • The term‘‘production optimization’’ has been used to describe different processes in the oil and gas industry. • Production Optimization means Balance between Production rate / Deliverability and demand. • Production Optimization includes a good understanding about Production Systems and Reservoir Fluid. 5
  • 6.
    • Well deliverabilityis determined by the combination of well inflow performance and wellbore flow performance. • This work focuses on prediction of achievable fluid production rates from reservoirs with specified production string characteristics. • The technique of analysis is called “Nodal Analysis” 6 Gilbert (1956) (10)
  • 7.
  • 8.
    After improve nodal analysisfor horizontal well, two important section will be increased that are following: • Horizontal Section • Inclination Section 8
  • 9.
    1. The characteristicsand physical properties of the fluid. 2. Friction in pipes. 3. Energy losses in fitting. 4. Pressure drop through equipment. 5. The distance or length the fluid must travel. 6. Diameter change of the pipe. 9
  • 10.
    Factors affects pressurelosses in horizontal section same as bent section, only one factor will be added which is Pressure Losses whenever the flow direction changes. The pressure loss in a bend can thus be calculated as: 10
  • 11.
    • PROSPER isa well performance, design and optimization program. • PROSPER is designed to allow the building of reliable and consistent well models, with the ability to address each aspect of well bore modelling PVT, VLP correlations and IPR. • PROSPER enables detailed surface pipeline performance and design: Flow Regimes, pipeline stability, Slug Size and Frequency. 11
  • 12.
    • Design andoptimize well completions including multi-lateral, multilayer and horizontal wells. • Design and optimize tubing and pipeline sizes. • Design, diagnose and optimize Gas lifted, Hydraulic pumps and ESP wells. • Calculate pressure losses in wells, flow lines and across chokes. • Predict flowing temperatures in wells and pipelines. • Calculate total skin and determine breakdown. • Allocate production between wells. 12
  • 13.
    D:Koya UniProd EngII - 2015-2016projec tH.W OptPROSPE R ModelT 04_HORIZONT ALOILWE LL.Out 0 21000 42000 63000 84000 0 1000 2000 3000 4000 IPR plot Horizontal Well - No Flow Boundaries (HW 05/14/2016 - 11:58:15) Rate (S T B/day) Pressure(psig) Inflow T ype Single Branch Completion Cased Hole Sand Control None Gas Coning No Reservoir Model Horizontal Well - No Flow Boundaries M& G Skin Model Enter Skin B y Hand Compaction Permeability Reduction Model No Relative P ermeability No Formation PI 41.07 (ST B /day/ps i) Absolute Open Flow (AOF)82543.8 (ST B /day) Reservoir Pres sure4000.00 (ps ig) Reservoir T emperature200.00 (deg F) Water Cut 0 (perc ent) T otal GOR400.00 (sc f/S T B) Reservoir Permeability150.00 (md) Reservoir T hic knes s 100.0 (feet) Wellbore Radius 0.354 (feet) Reservoir Porosity (fraction) Horizontal Anis otropy 1 (fraction) Vertic al A nisotropy 0.1 (fraction) Length Of Well2000.0 (feet) Reservoir Length5000.0 (feet) Reservoir Width5000.0 (feet) Dis tanc e From Length E dge T o Centre Of Well2500.0 (feet) Dis tanc e From Width Edge T o Centre Of Well2500.0 (feet) Dis tanc e From Bottom T o Centre Of Well 50.0 (feet) Skin 5 AOF : 82543.8 (ST B/day) Formation PI : 41.07 (ST B/day/psi) SK IN : 5 Results: IPR curve 13
  • 14.
    Results: Well Capacity 010000 20000 30000 40000 0 1500 3000 4500 6000 Inf low (IPR) v Outf low (VLP) Plot (HW 05/15/2016 - 08:35:04) Liquid Rate (STB/day) Pressure(psig) PVT Method Black Oil Fluid Oil Flow Type Tubing Top Node Pressure250.00 (psig) Water Cut 0 (percent) Bottom Measured Depth8050.0 (feet) Inflow Type Single Branch Completion Cased Hole Sand Control None Solution Point Liquid Rate18453.6 (STB/day) Oil Rate18453.6 (STB/day) Water Rate 0 (STB/day) Gas Rate 7.381 (MMscf/day) Solution Node Pressure3354.18 (psig) dP Friction 823.12 (psi) dP Gravity2237.76 (psi) dP T otal Skin 196.48 (psi) dP Perforation 0 (psi) dP Damage 0 (psi) dP Completion 0 (psi) Completion Skin 5.00 Total Skin 5.00 Wellhead Liquid Density 52.761 (lb/ft3) Wellhead Gas Density0.87847 (lb/ft3) Wellhead Liquid Viscosity 2.3440 (centipoise) Wellhead Gas Viscosity0.012674 (centipoise) Wellhead Superficial Liquid Velocity 14.432 (ft/sec) Wellhead Superficial Gas Velocity 56.913 (ft/sec) Wellhead Z Factor0.96557 Wellhead Interfacial Tension14.9531 (dyne/cm) Wellhead Pressure 250.00 (psig) Wellhead Temperature 172.16 (deg F) First Node Liquid Density 52.761 (lb/ft3) First Node Gas Density0.87847 (lb/ft3) First Node Liquid Viscosity 2.3440 (centipoise) First Node Gas Viscosity0.012674 (centipoise) First Node Superficial Liquid Velocity 14.432 (ft/sec) First Node Superficial Gas Velocity 56.913 (ft/sec) First Node Z Factor0.96557 First Node Interfacial T ension14.9531 (dyne/cm) First Node Pressure 250.00 (psig) First Node Temperature 172.16 (deg F) E E E 14
  • 15.
    Results: Well LengthOptimization Reuslts 0 10000 20000 30000 40000 0 1500 3000 4500 6000 Inf low (IPR) v Outf low (VLP) Plot (HW 05/14/2016 - 12:04:10) Liquid Rate (STB/day) Pressure(psig) PVT Method Black Oil Fluid Oil Top Node Pressure250.00 (psig) Water Cut 0 (percent) Inflow Type Single Branch Completion Cased Hole Variables 1:Well Length (feet) 1 2 3 0=500.0 1=1000.0 2=1500.0 3=2000.0 4=2500.0 5=3000.0 0 0 E E E 1 1 E E E 2 2 E E E 3 3 E E E 4 4 E E E 5 5 E E E 15
  • 16.
    Results: Well LengthSensitivity Results 16
  • 17.
    Results: Well LengthSensitivity Results 0 500 1000 1500 2000 2500 3000 3500 4000 0 500 1000 1500 2000 2500 3000 3500 Pwf Well Length 17
  • 18.
    Results: Well LengthSensitivity Data Results Well length in ft Pressure in psi Production rate STB/day 500 2706.98 11689.5 1000 3036.53 15233.2 1500 3226.67 17152.5 2000 3354.18 18453.6 2500 3448.84 19379.3 3000 3522.08 20062.4 18
  • 19.
    • With increasinglength, pressure drop must be increased. • Also with increasing length, Pwf & Flowrate will be increased. 19
  • 20.
    20 well length Pwfdp friction dp gravity 500 2706.98 388.5 2045.59 1000 3036.53 600.26 2153.6 1500 3226.67 728.4 2207.15 2000 3354.18 823.1 2237.77 2500 3448.84 892.15 2259.63 3000 3522.08 944.54 2275.82
  • 21.
  • 22.
    • Horizontal wellsare better than vertical. • To optimize production in horizontal wells, many factors can be considered. • The production can be optimized by increasing of length of horizontal section. • The PROSPER can be helpful to achieve the results, it may be used to choose the best result. 22
  • 23.
    1. Petroleum ProductionEngineering, A Computer-Assisted Approach by Boyun Guo, PH.D. , William C. Lyons, PH.D. and Ali Ghalambor, PH.D. 2. Production Optimization Using Nodal Analysis by H. Dale Beggs, 1991 Oklahoma. 3. Development and Applications of Production Optimization Techniques by PENGJU WANG, 2003 Stanford. 4. Pressure drop evaluation along pipelines https://www.scribd.com/doc/284696108/Theory 5. Fluid-Flow Theory, Energy Losses in Flow http://www.nzifst.org.nz/unitoperations/flfltheory5.htm#frictioninpipes 6. Pressure Loss Form Fittings – Expansion and Reduction in Pipe Size https://neutrium.net/fluid_flow/pressure-loss-from-fittings-expansion- and-reduction-in-pipe-size/ 23
  • 24.
    7. Flow inPipes http://www.uomisan.edu.iq/eng/ar/admin/pdf/26059867395.pdf 8. Bends, Flow and Pressure Drop in by Jayanti, Sreenivas http://www.thermopedia.com/content/577/ 9. Its application to well producing system was first proposed by Gilbert (1954) 10. PROSPER, Petroleum Experts, User Manual, Version 11.5, January 2010 24
  • 25.