Download to read offline
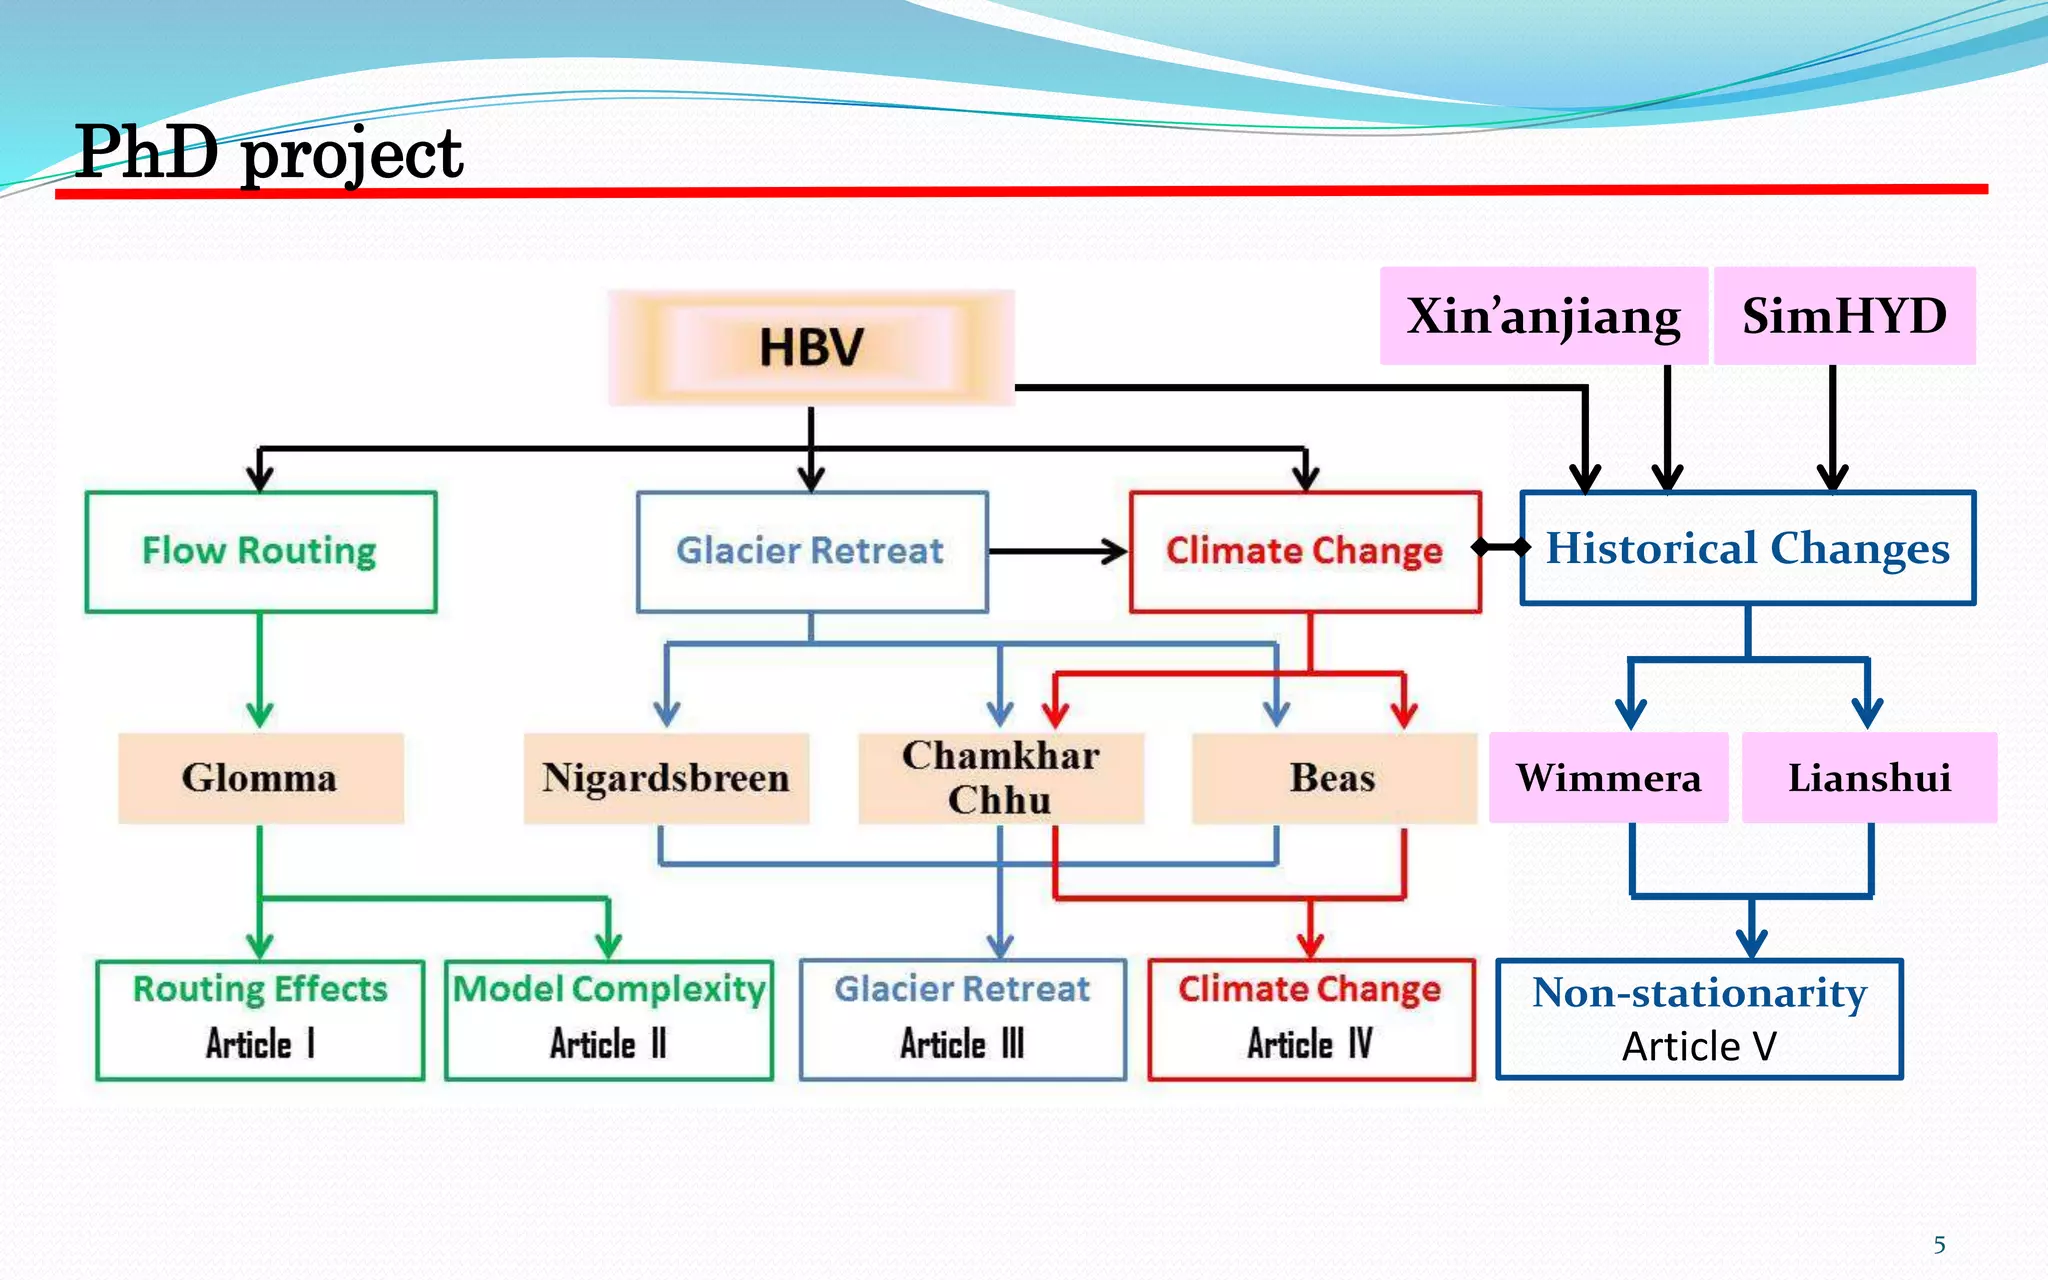

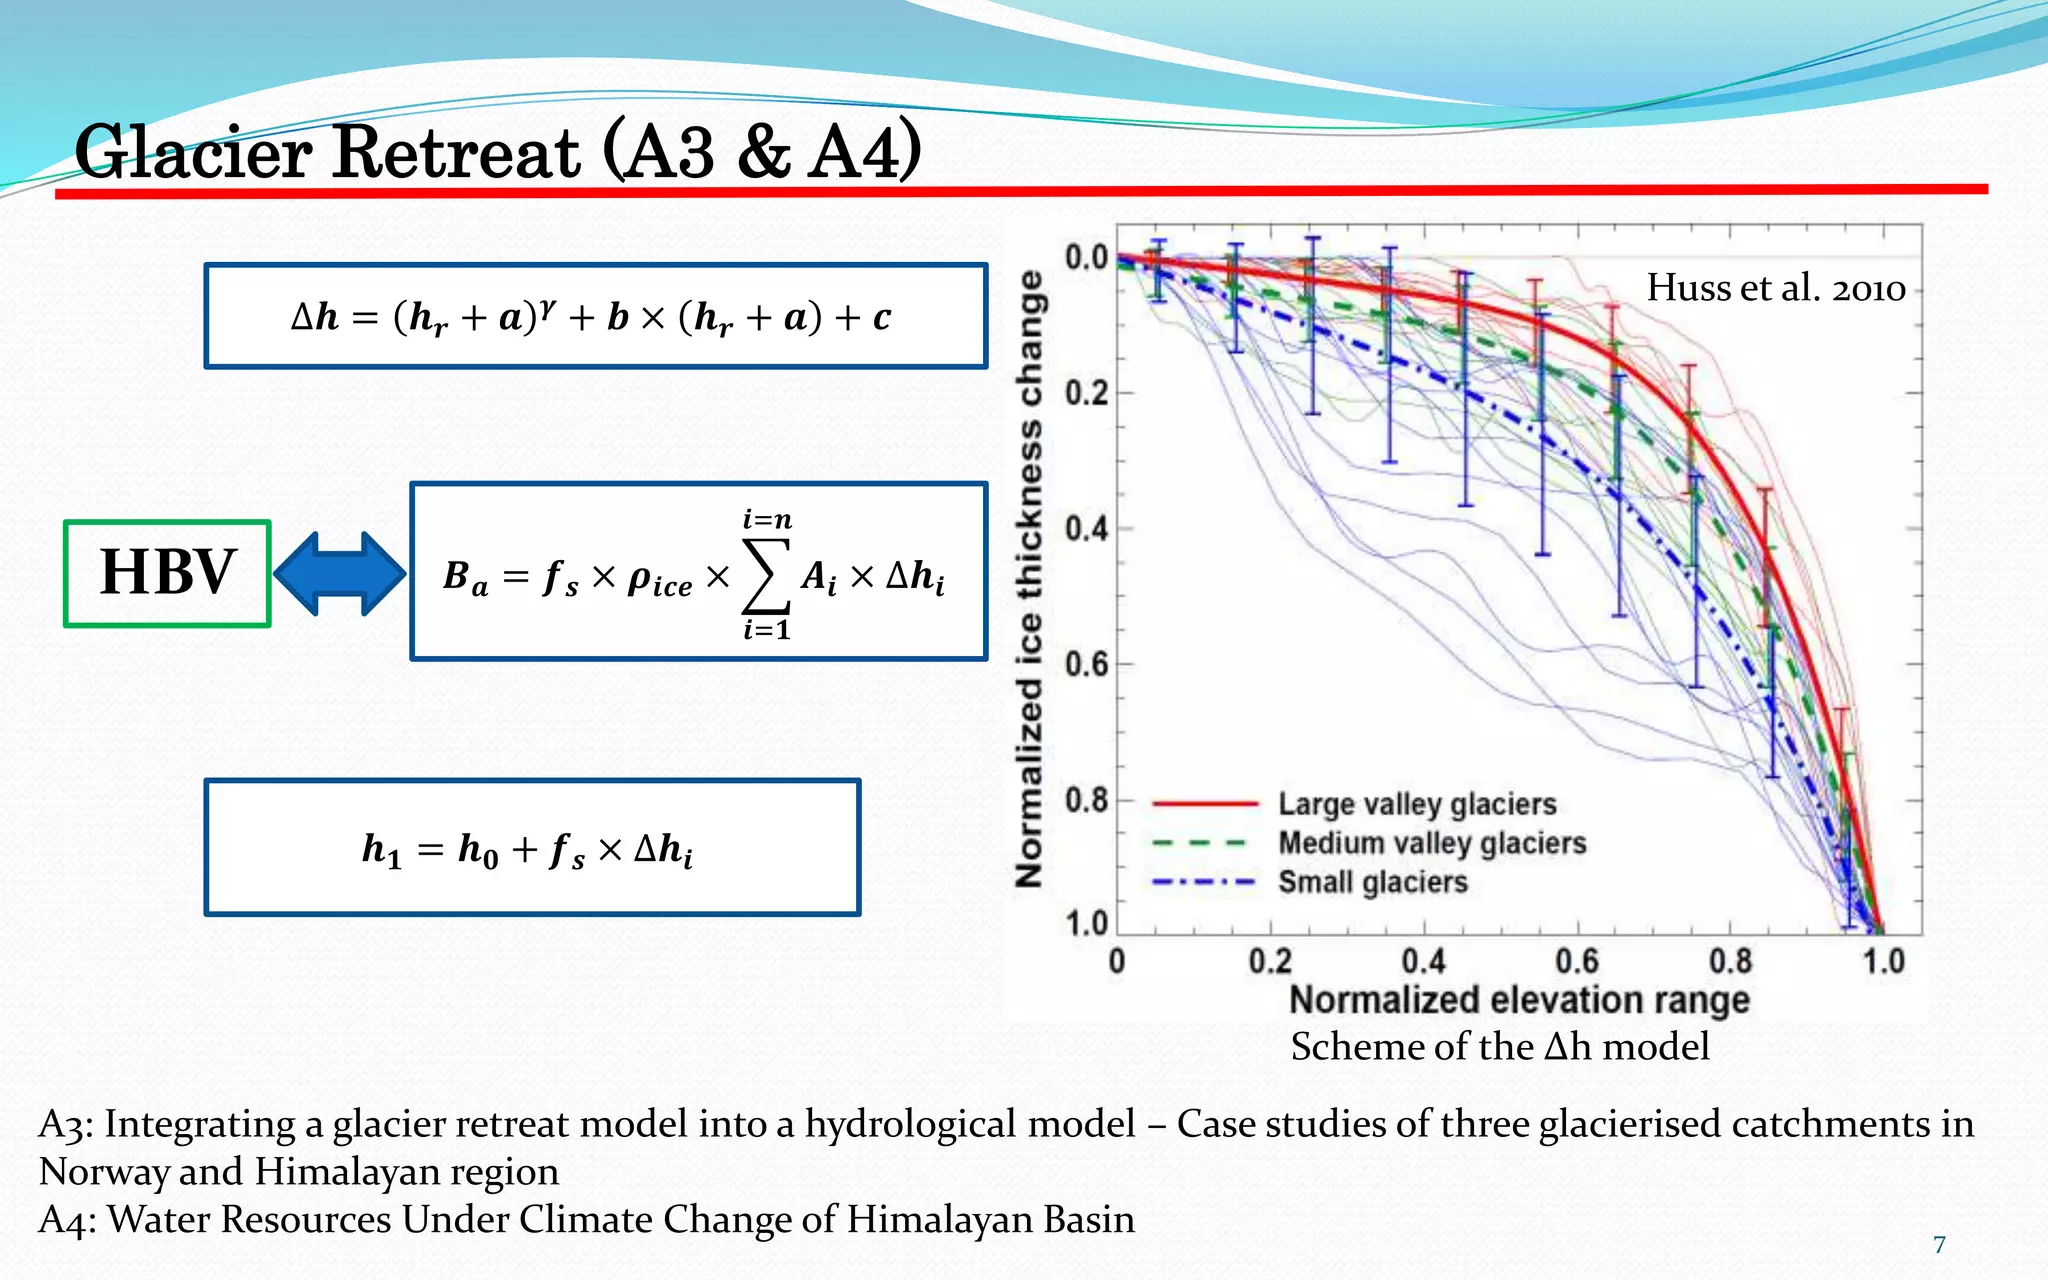
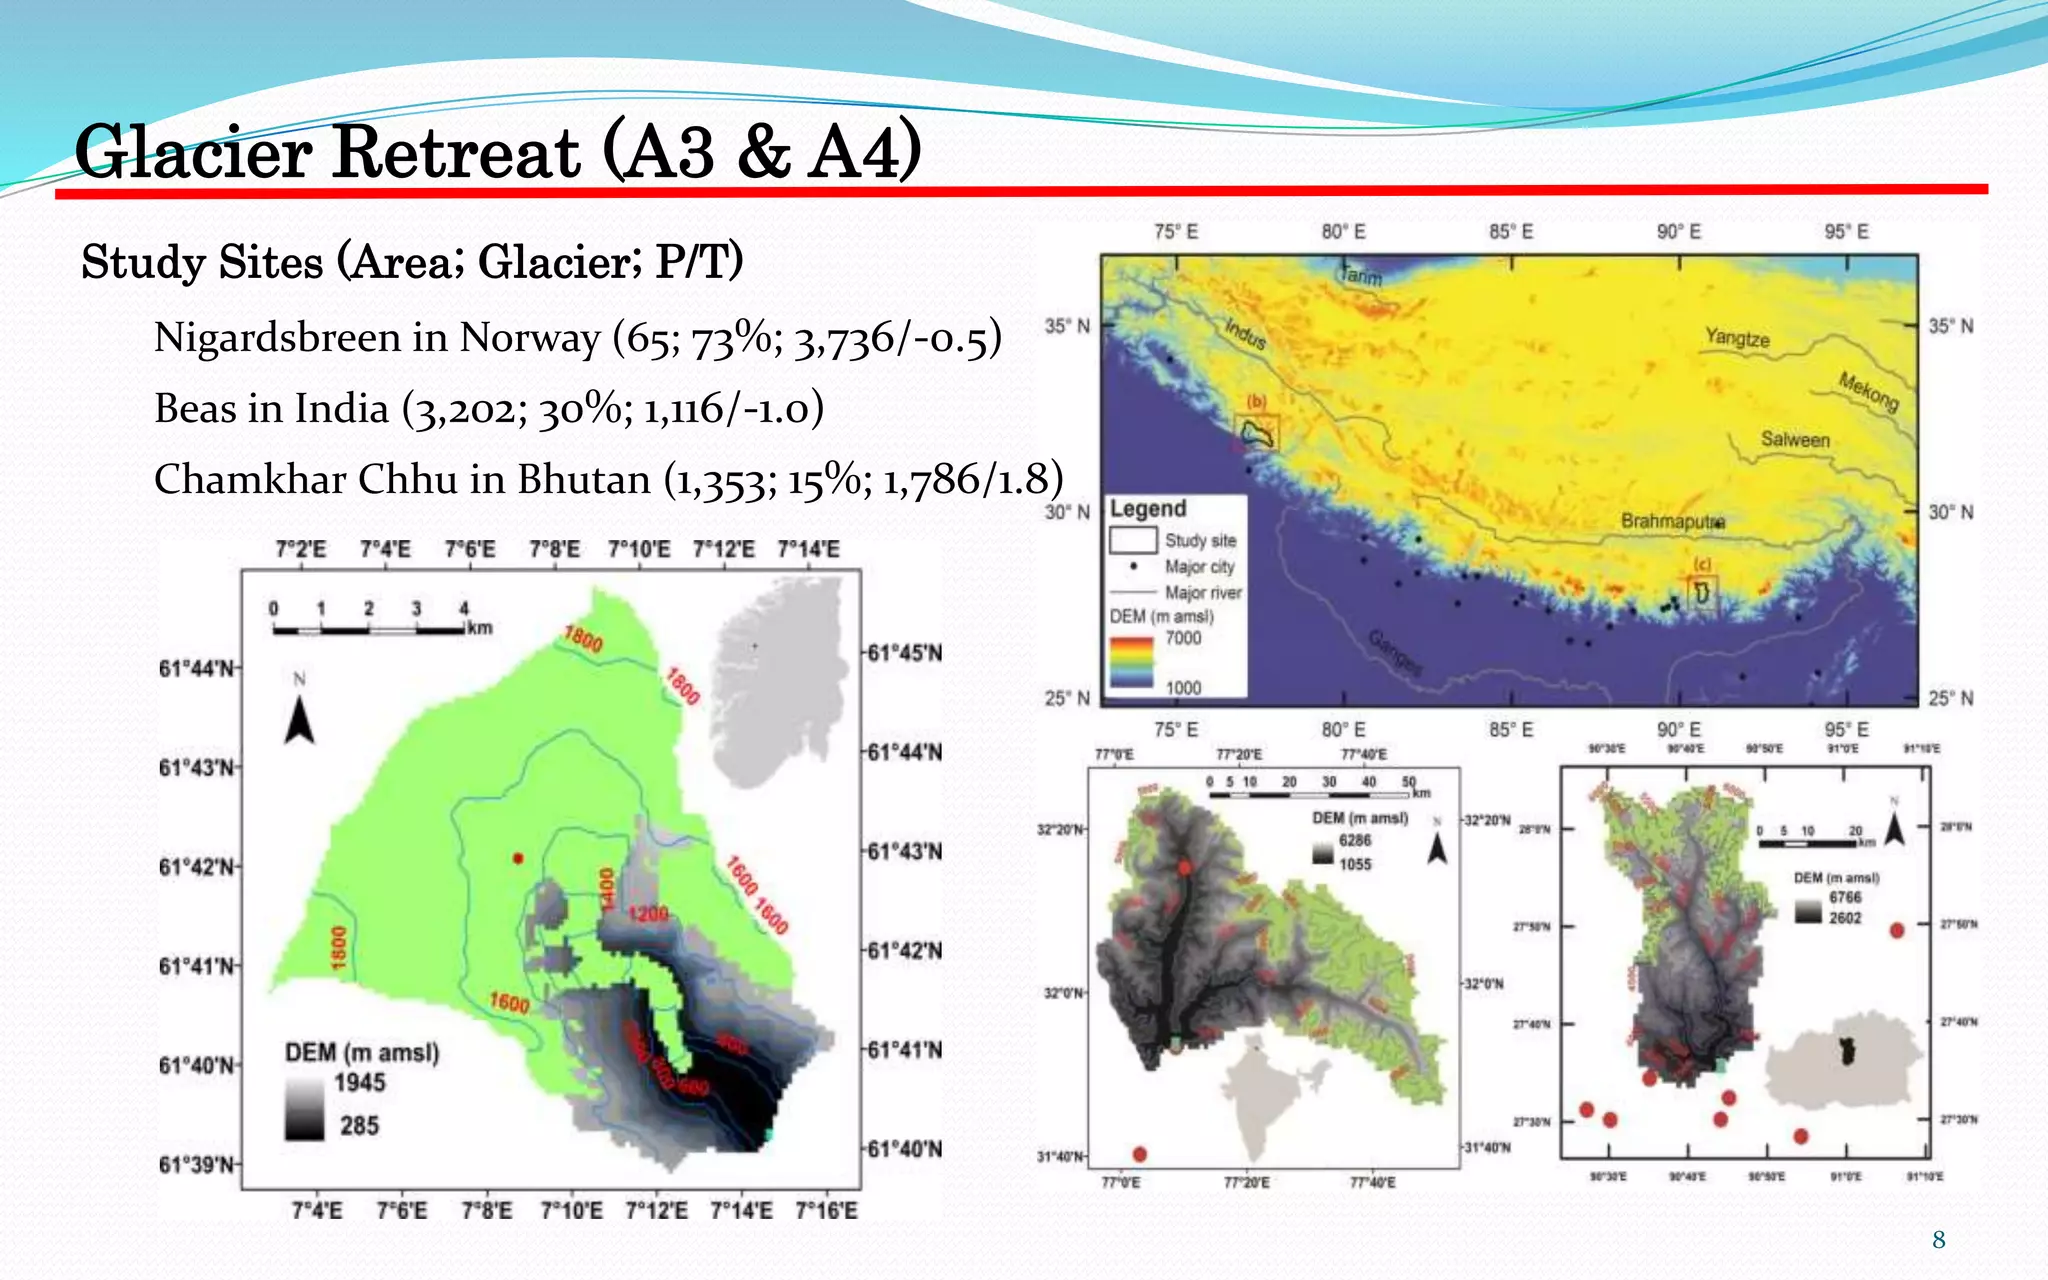

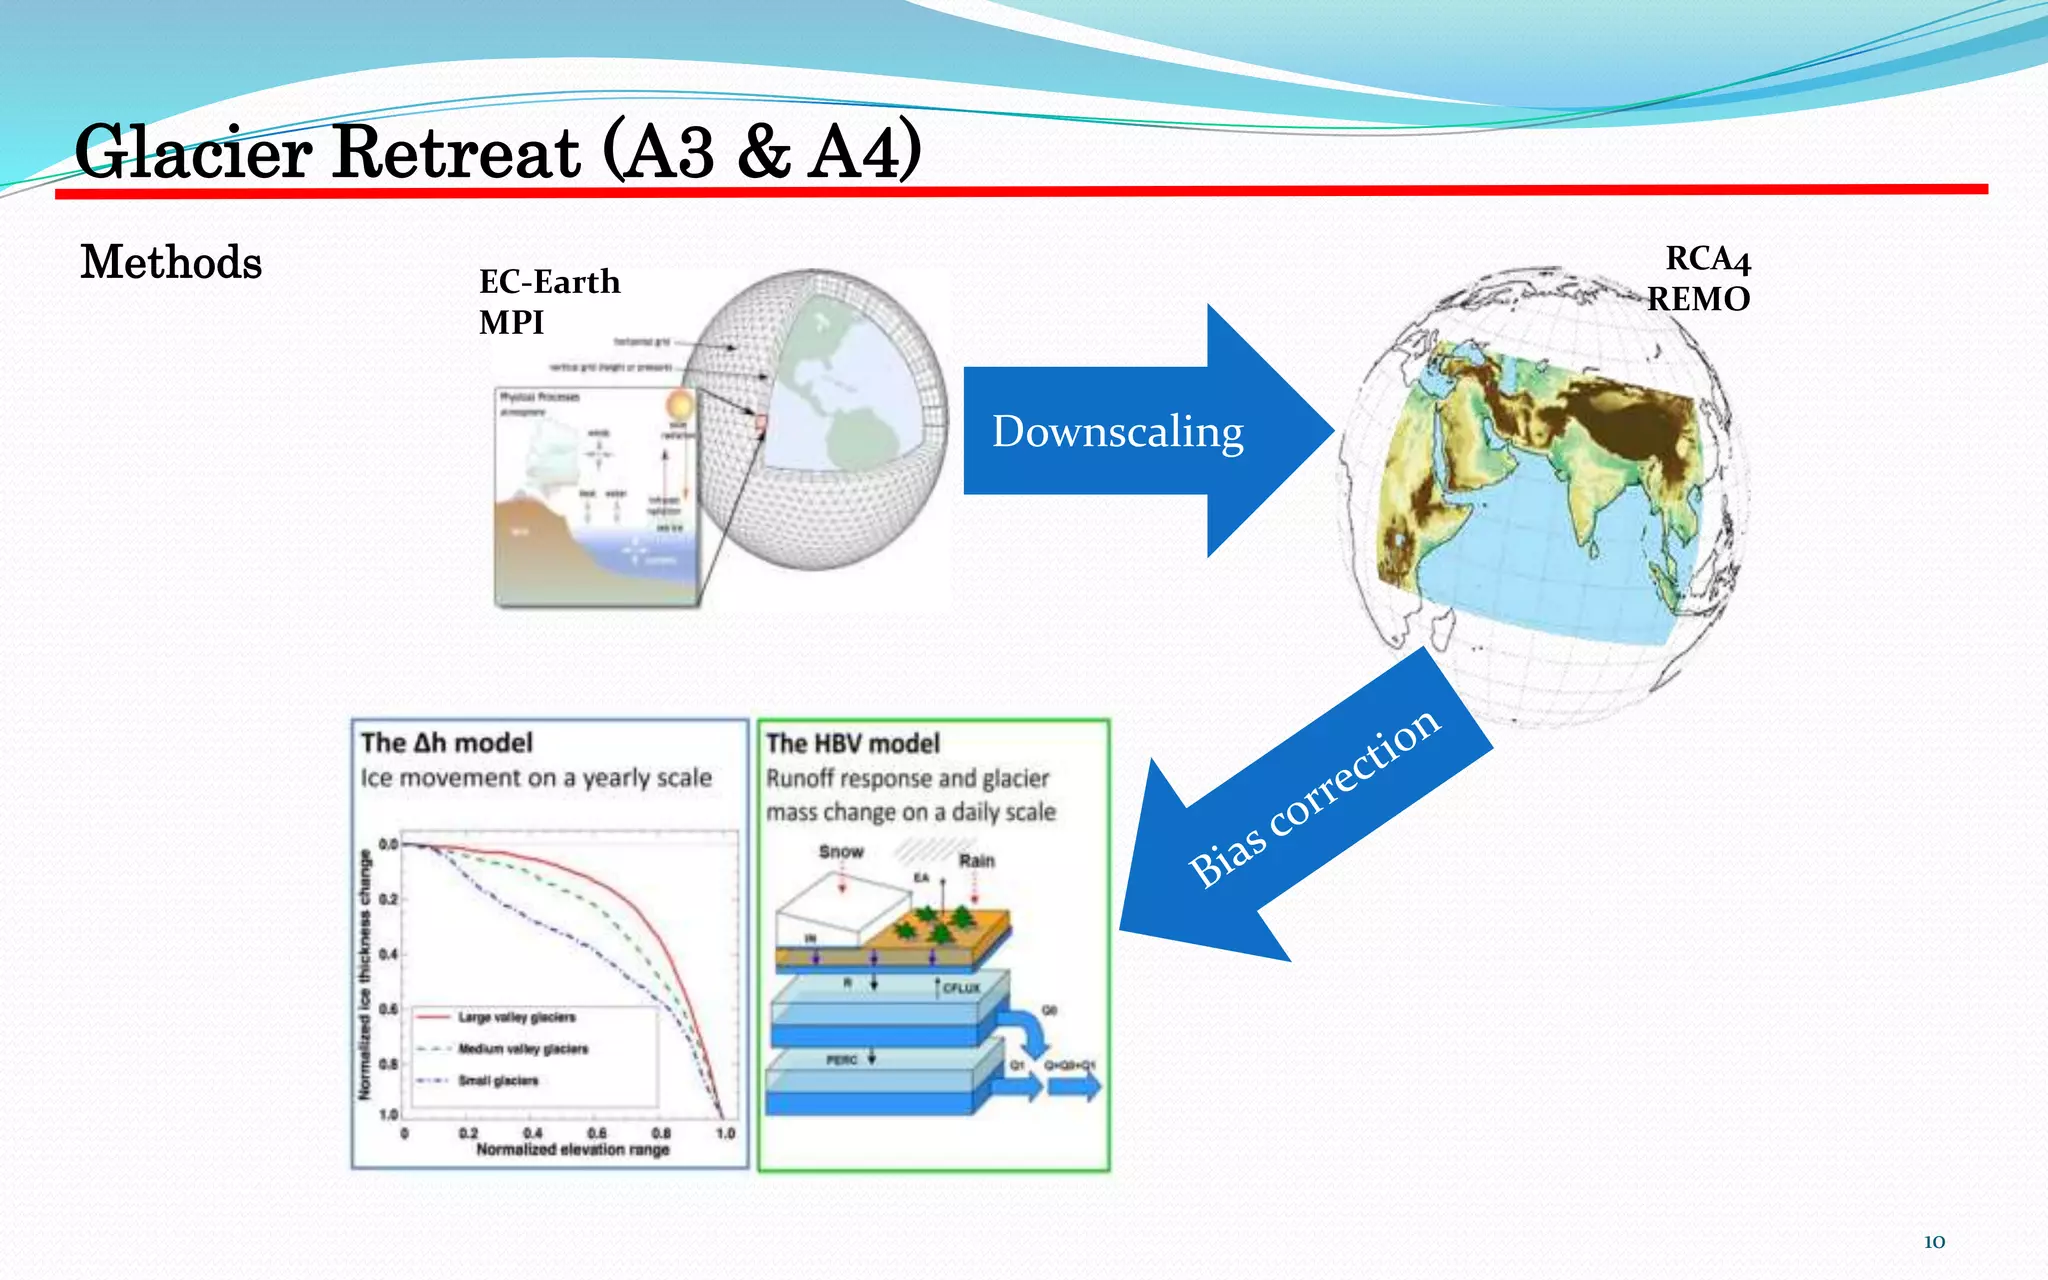
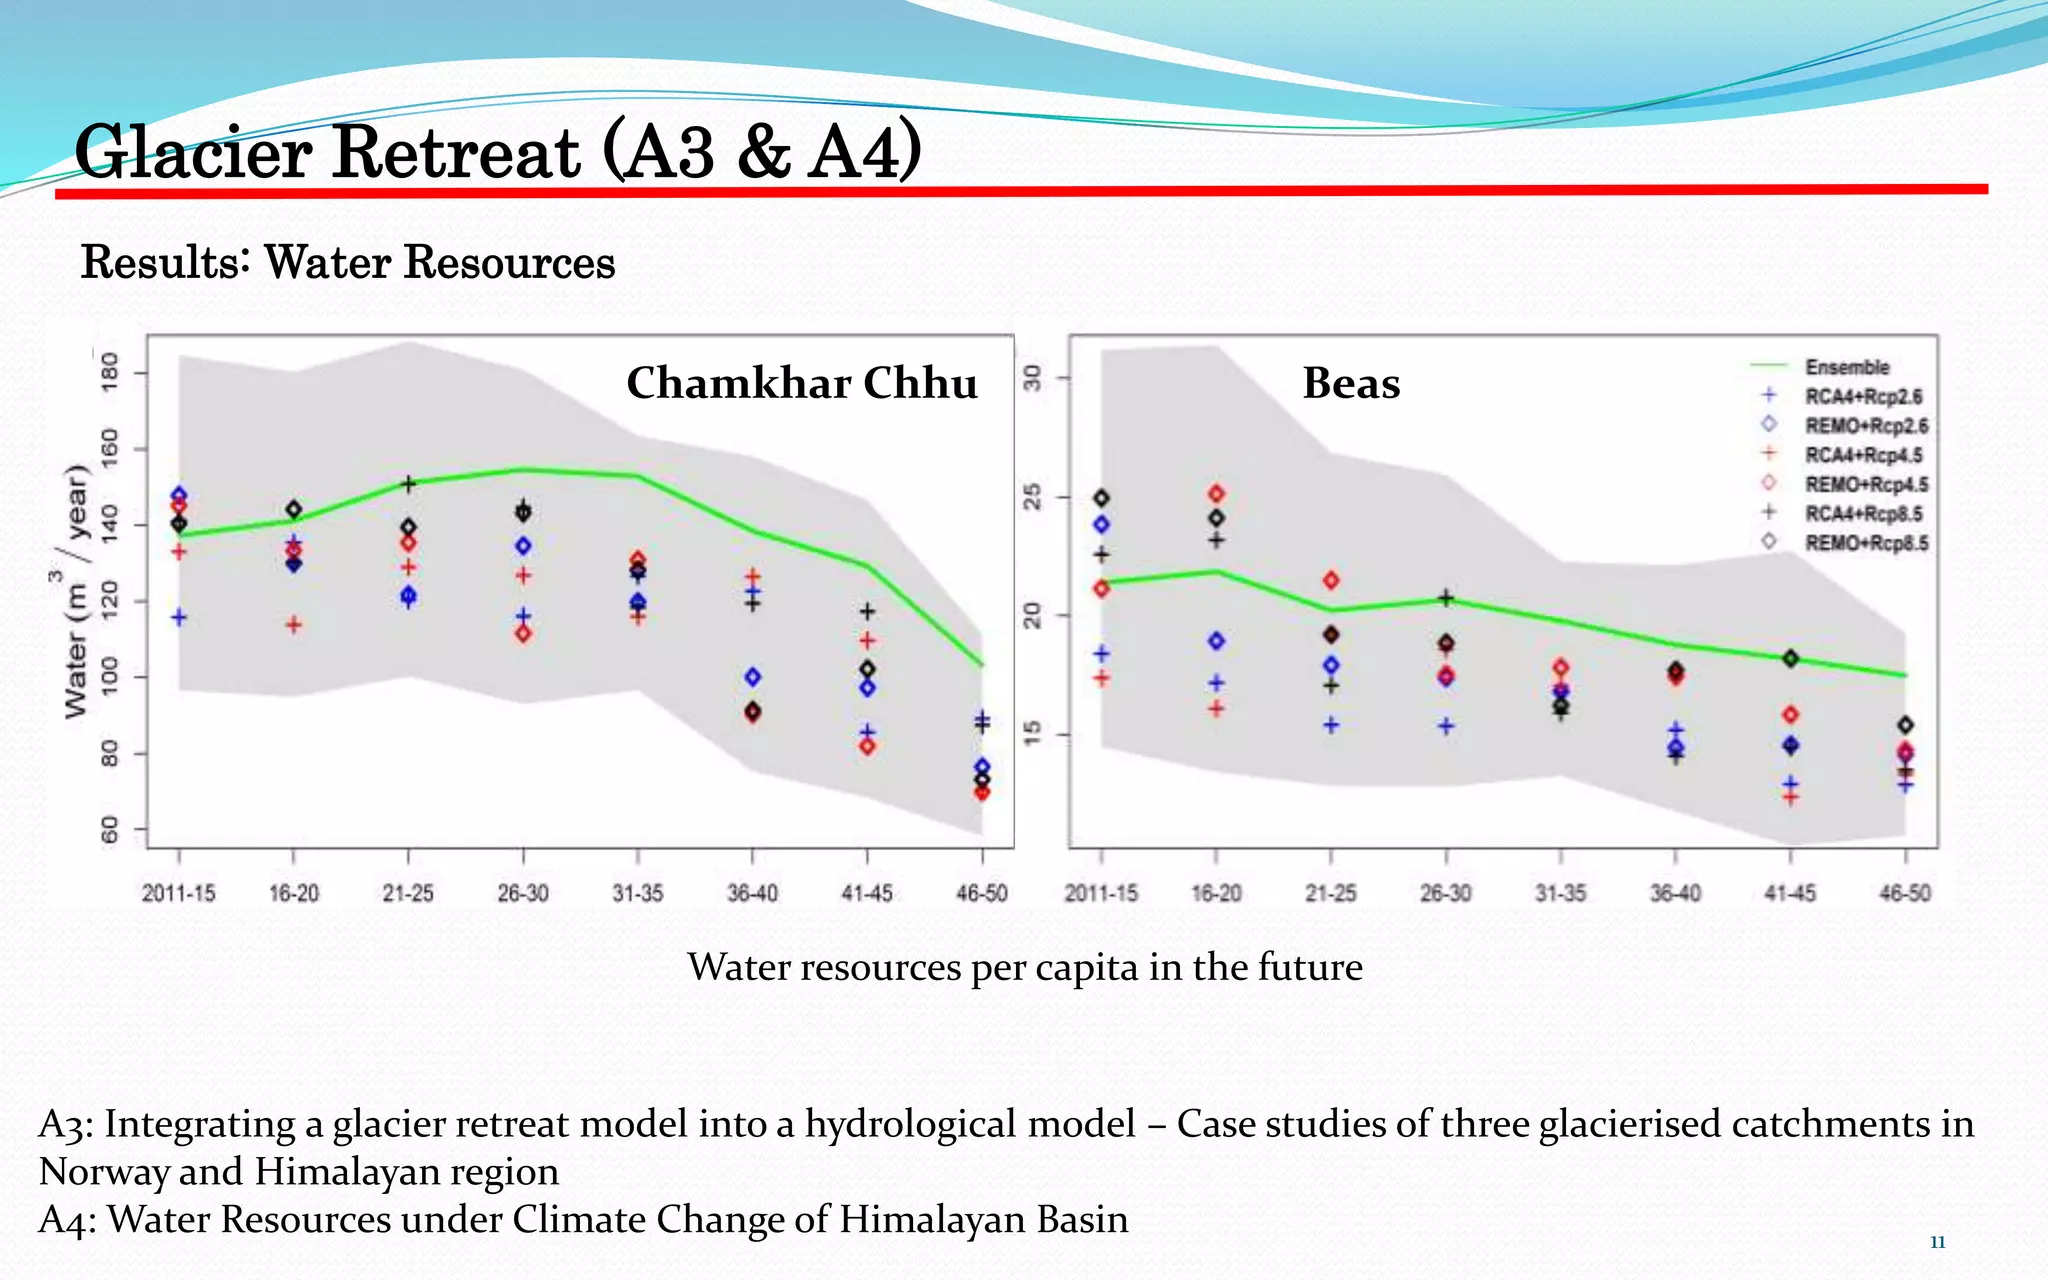


This document summarizes Hong Li's PhD research on integrating glacier retreat models into hydrological models. It includes: 1) Case studies of three glacierized catchments (in Norway and Himalayas) to assess model performance in simulating streamflow with and without a glacier retreat model. 2) Projections of future water resources in two Himalayan catchments (Chamkhar Chhu and Beas) under different climate change scenarios based on downscaled global climate model output. 3) An ongoing study examining the response of hydrological systems in India to climate change through climate modelling, hydrological modelling, and assessing changes in water resources.


