SlideShare a Scribd company logo
1 of 129
Download to read offline
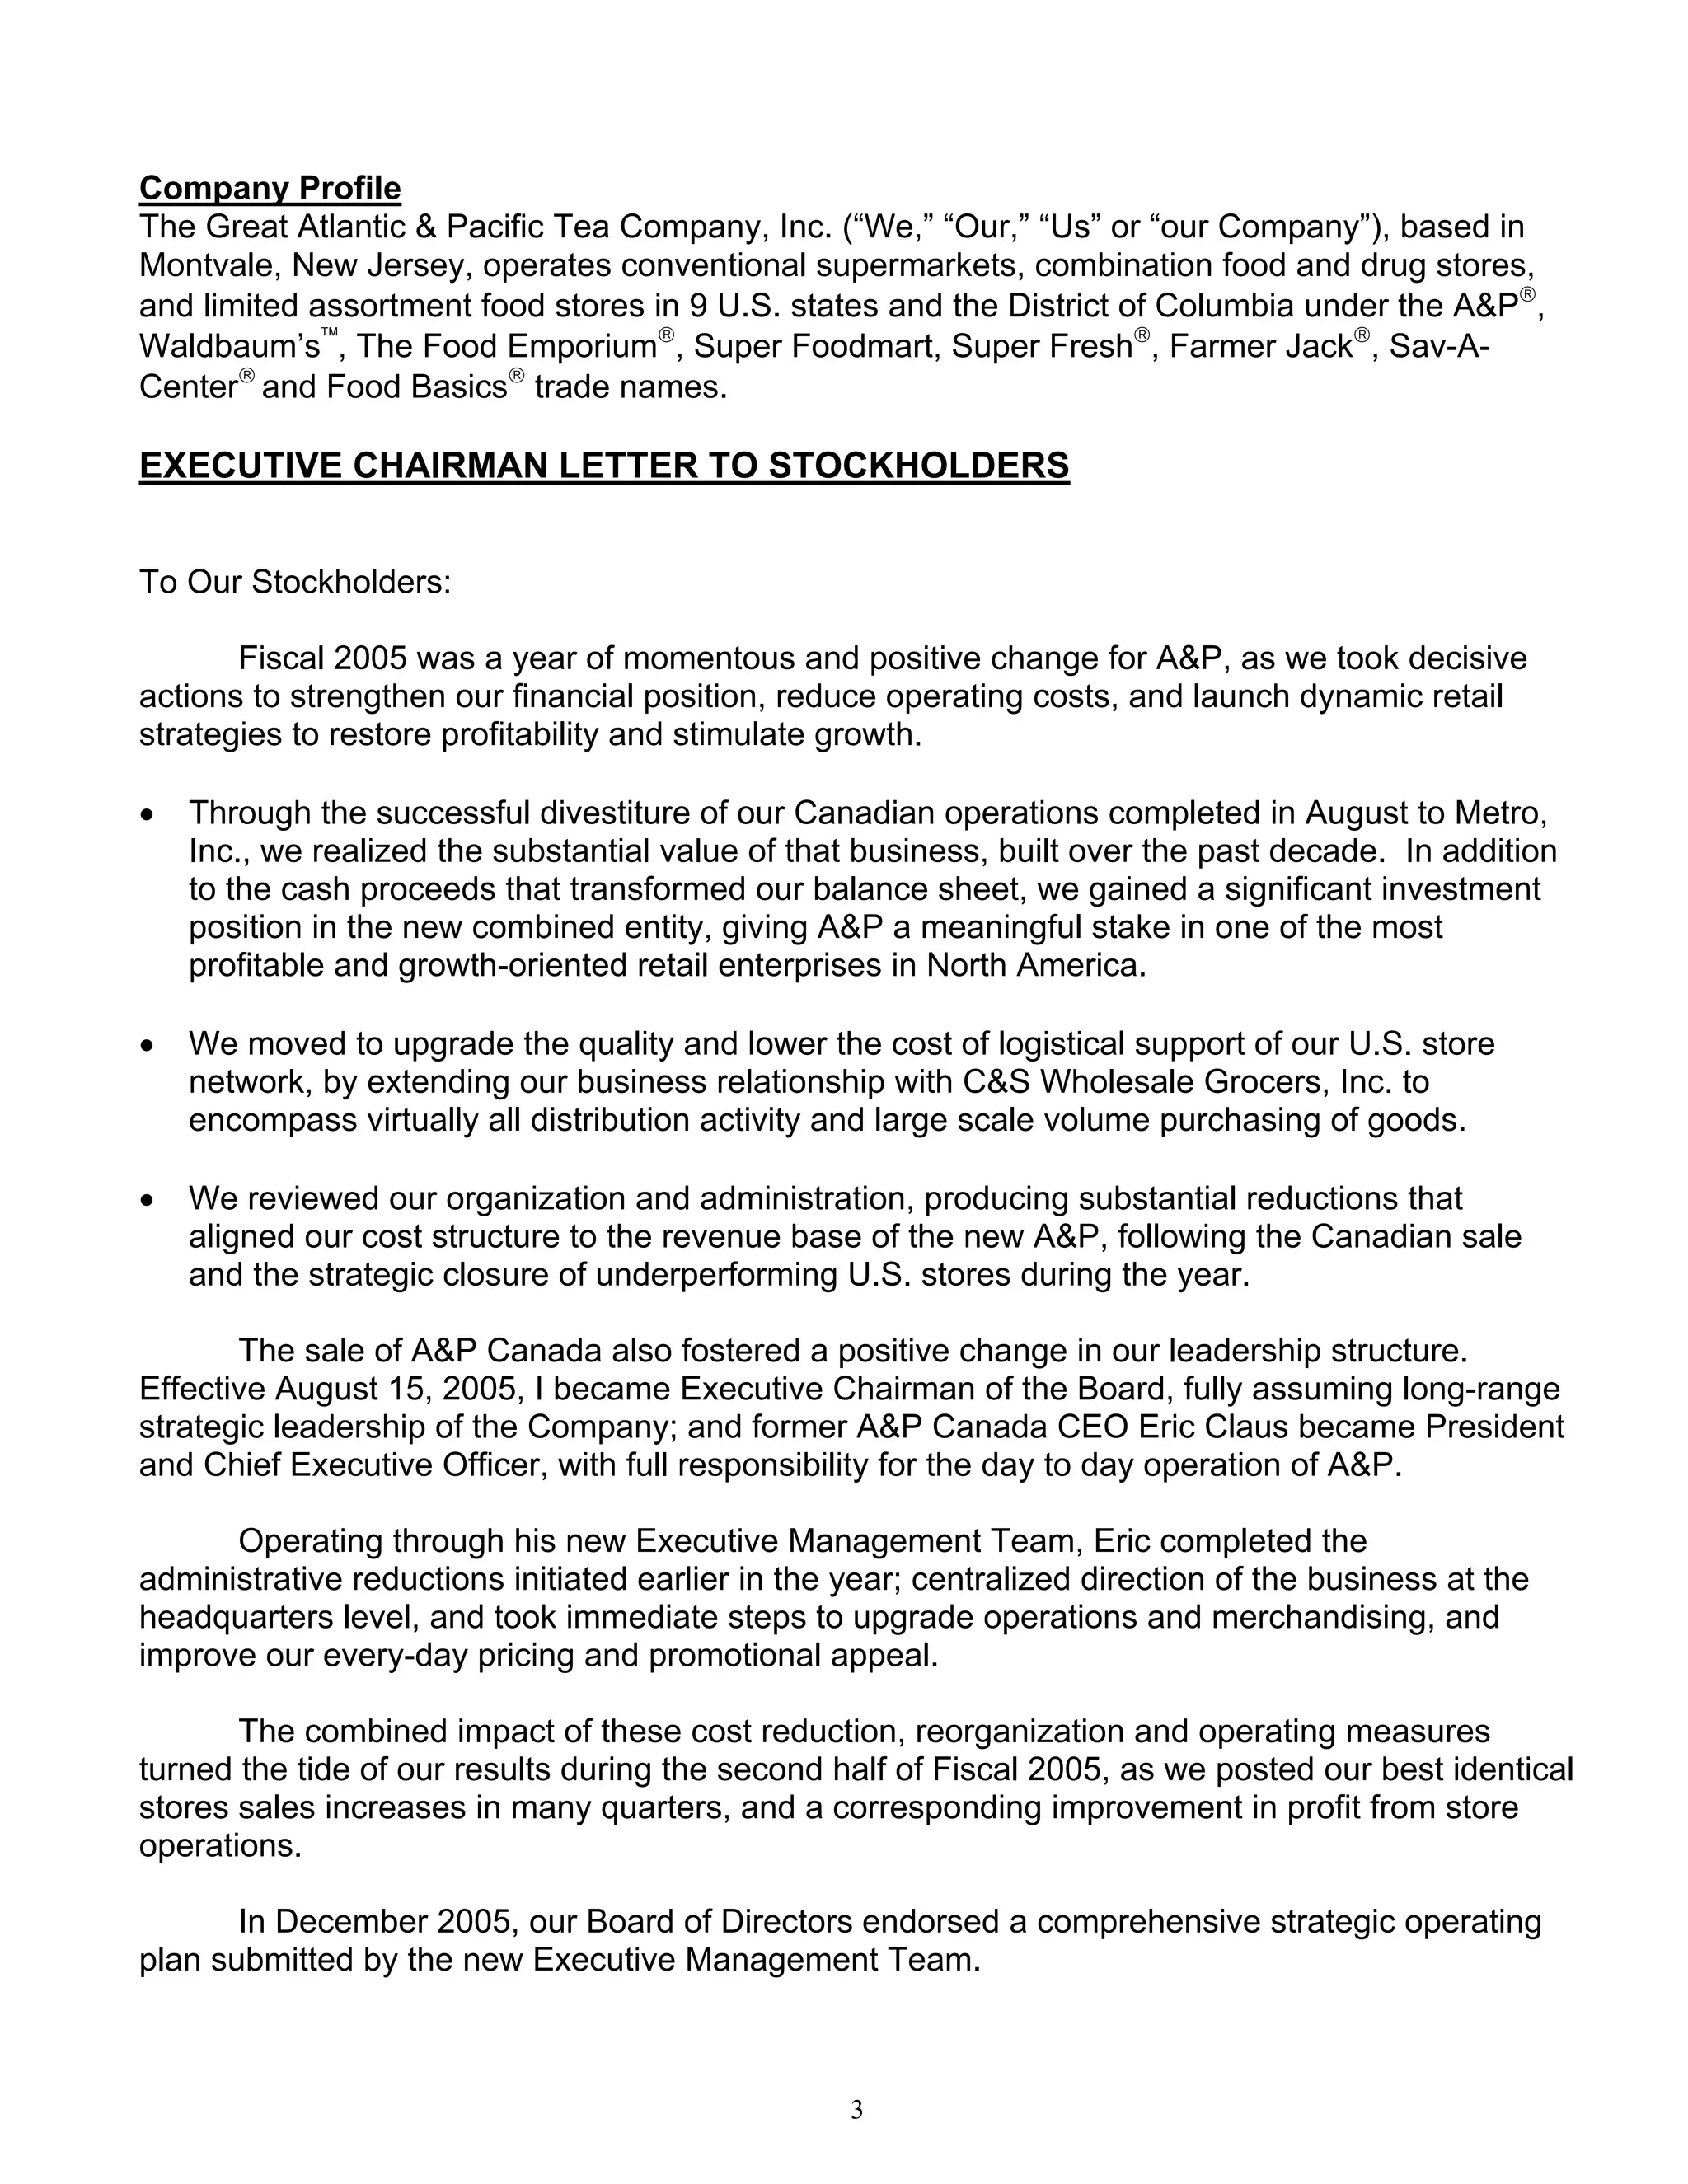
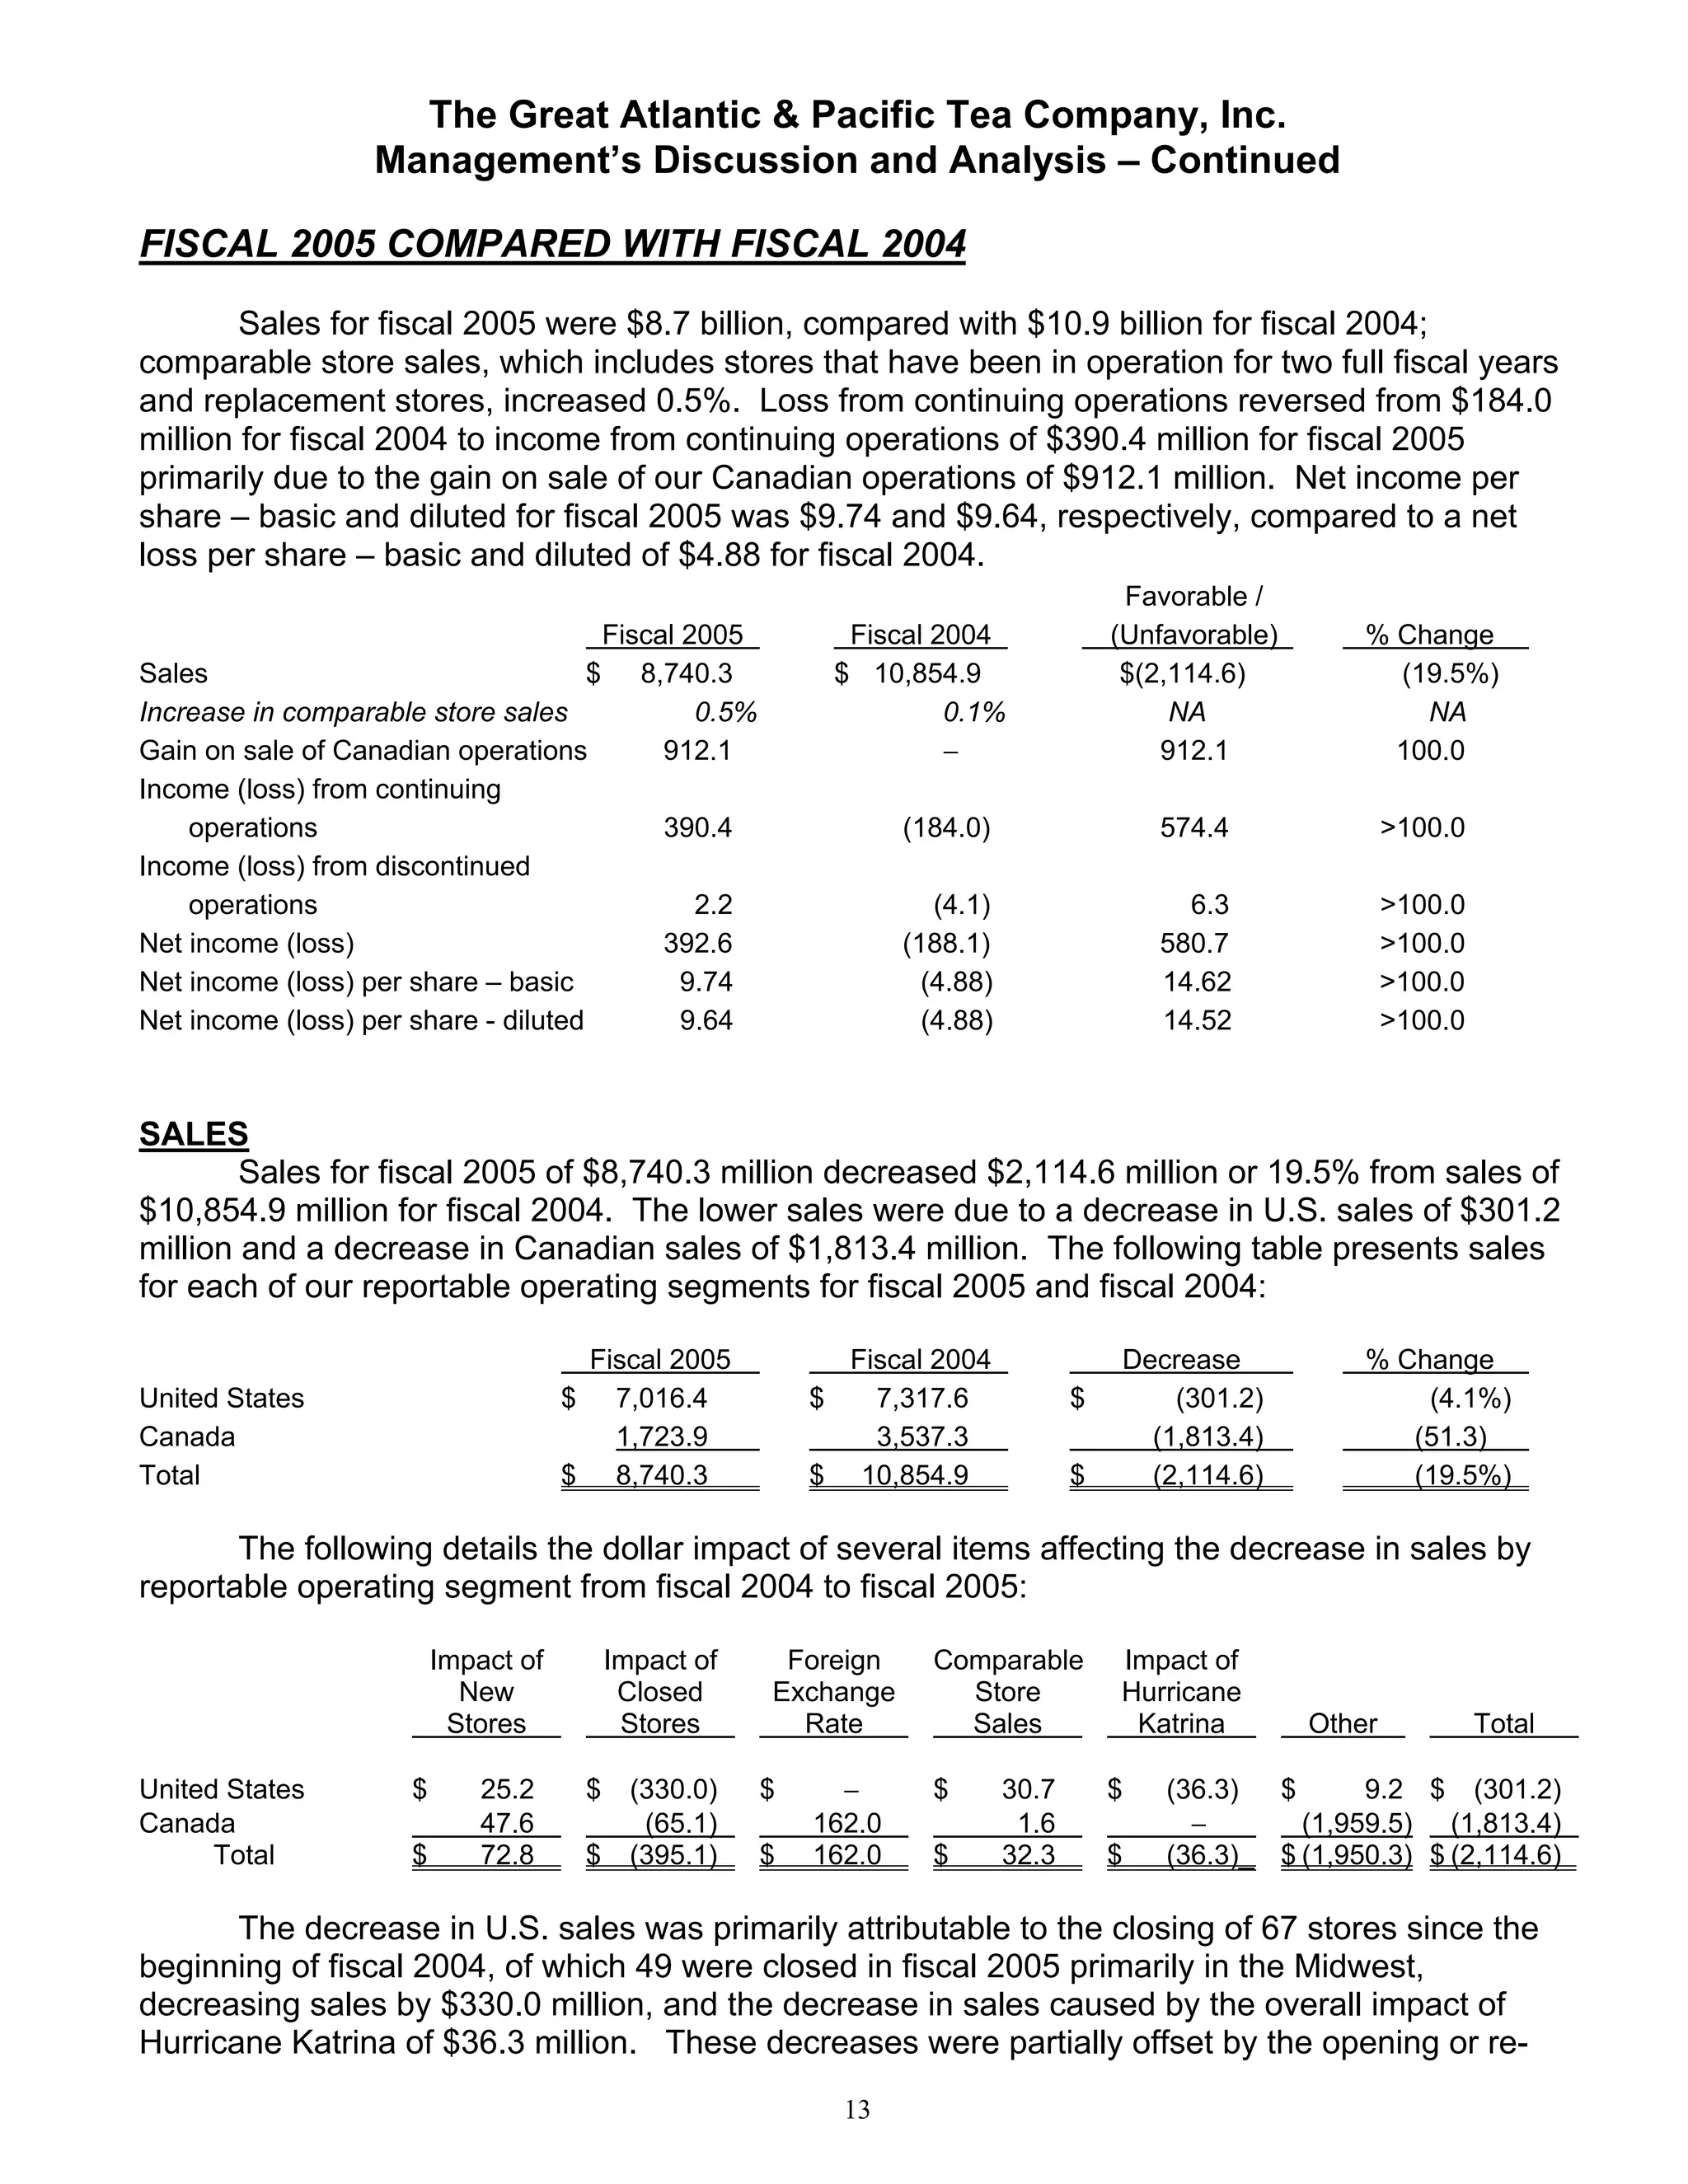
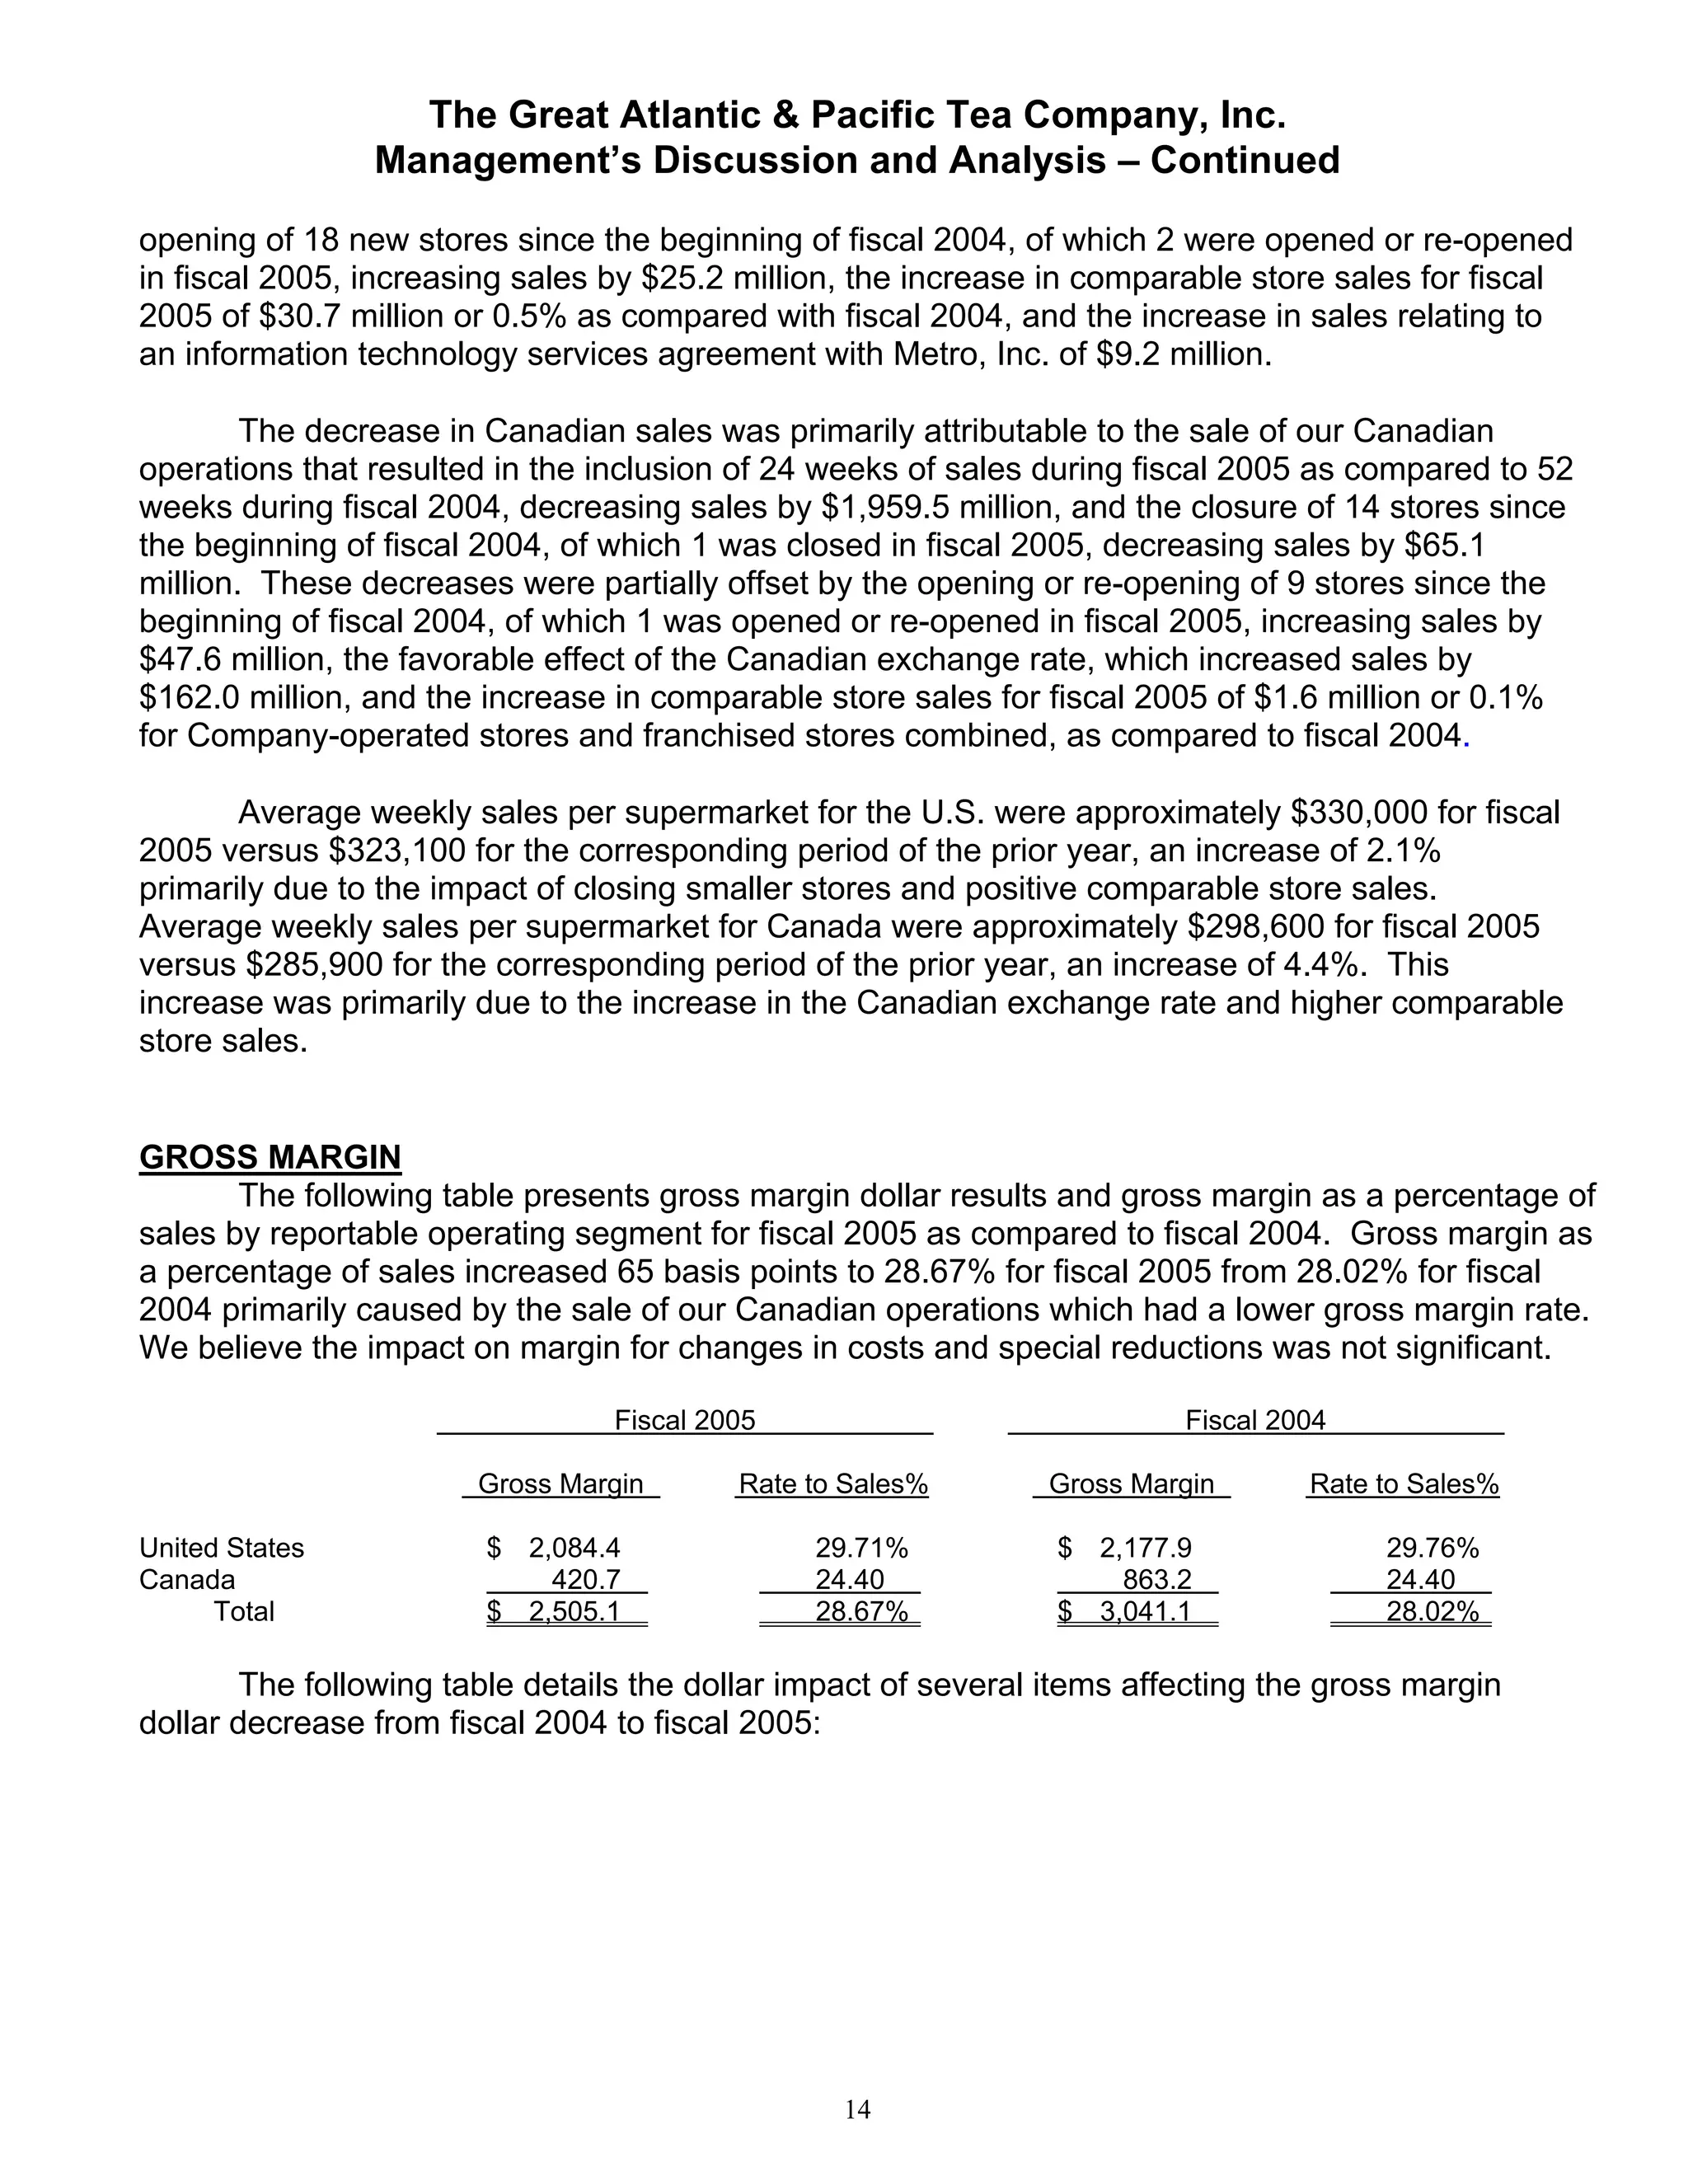
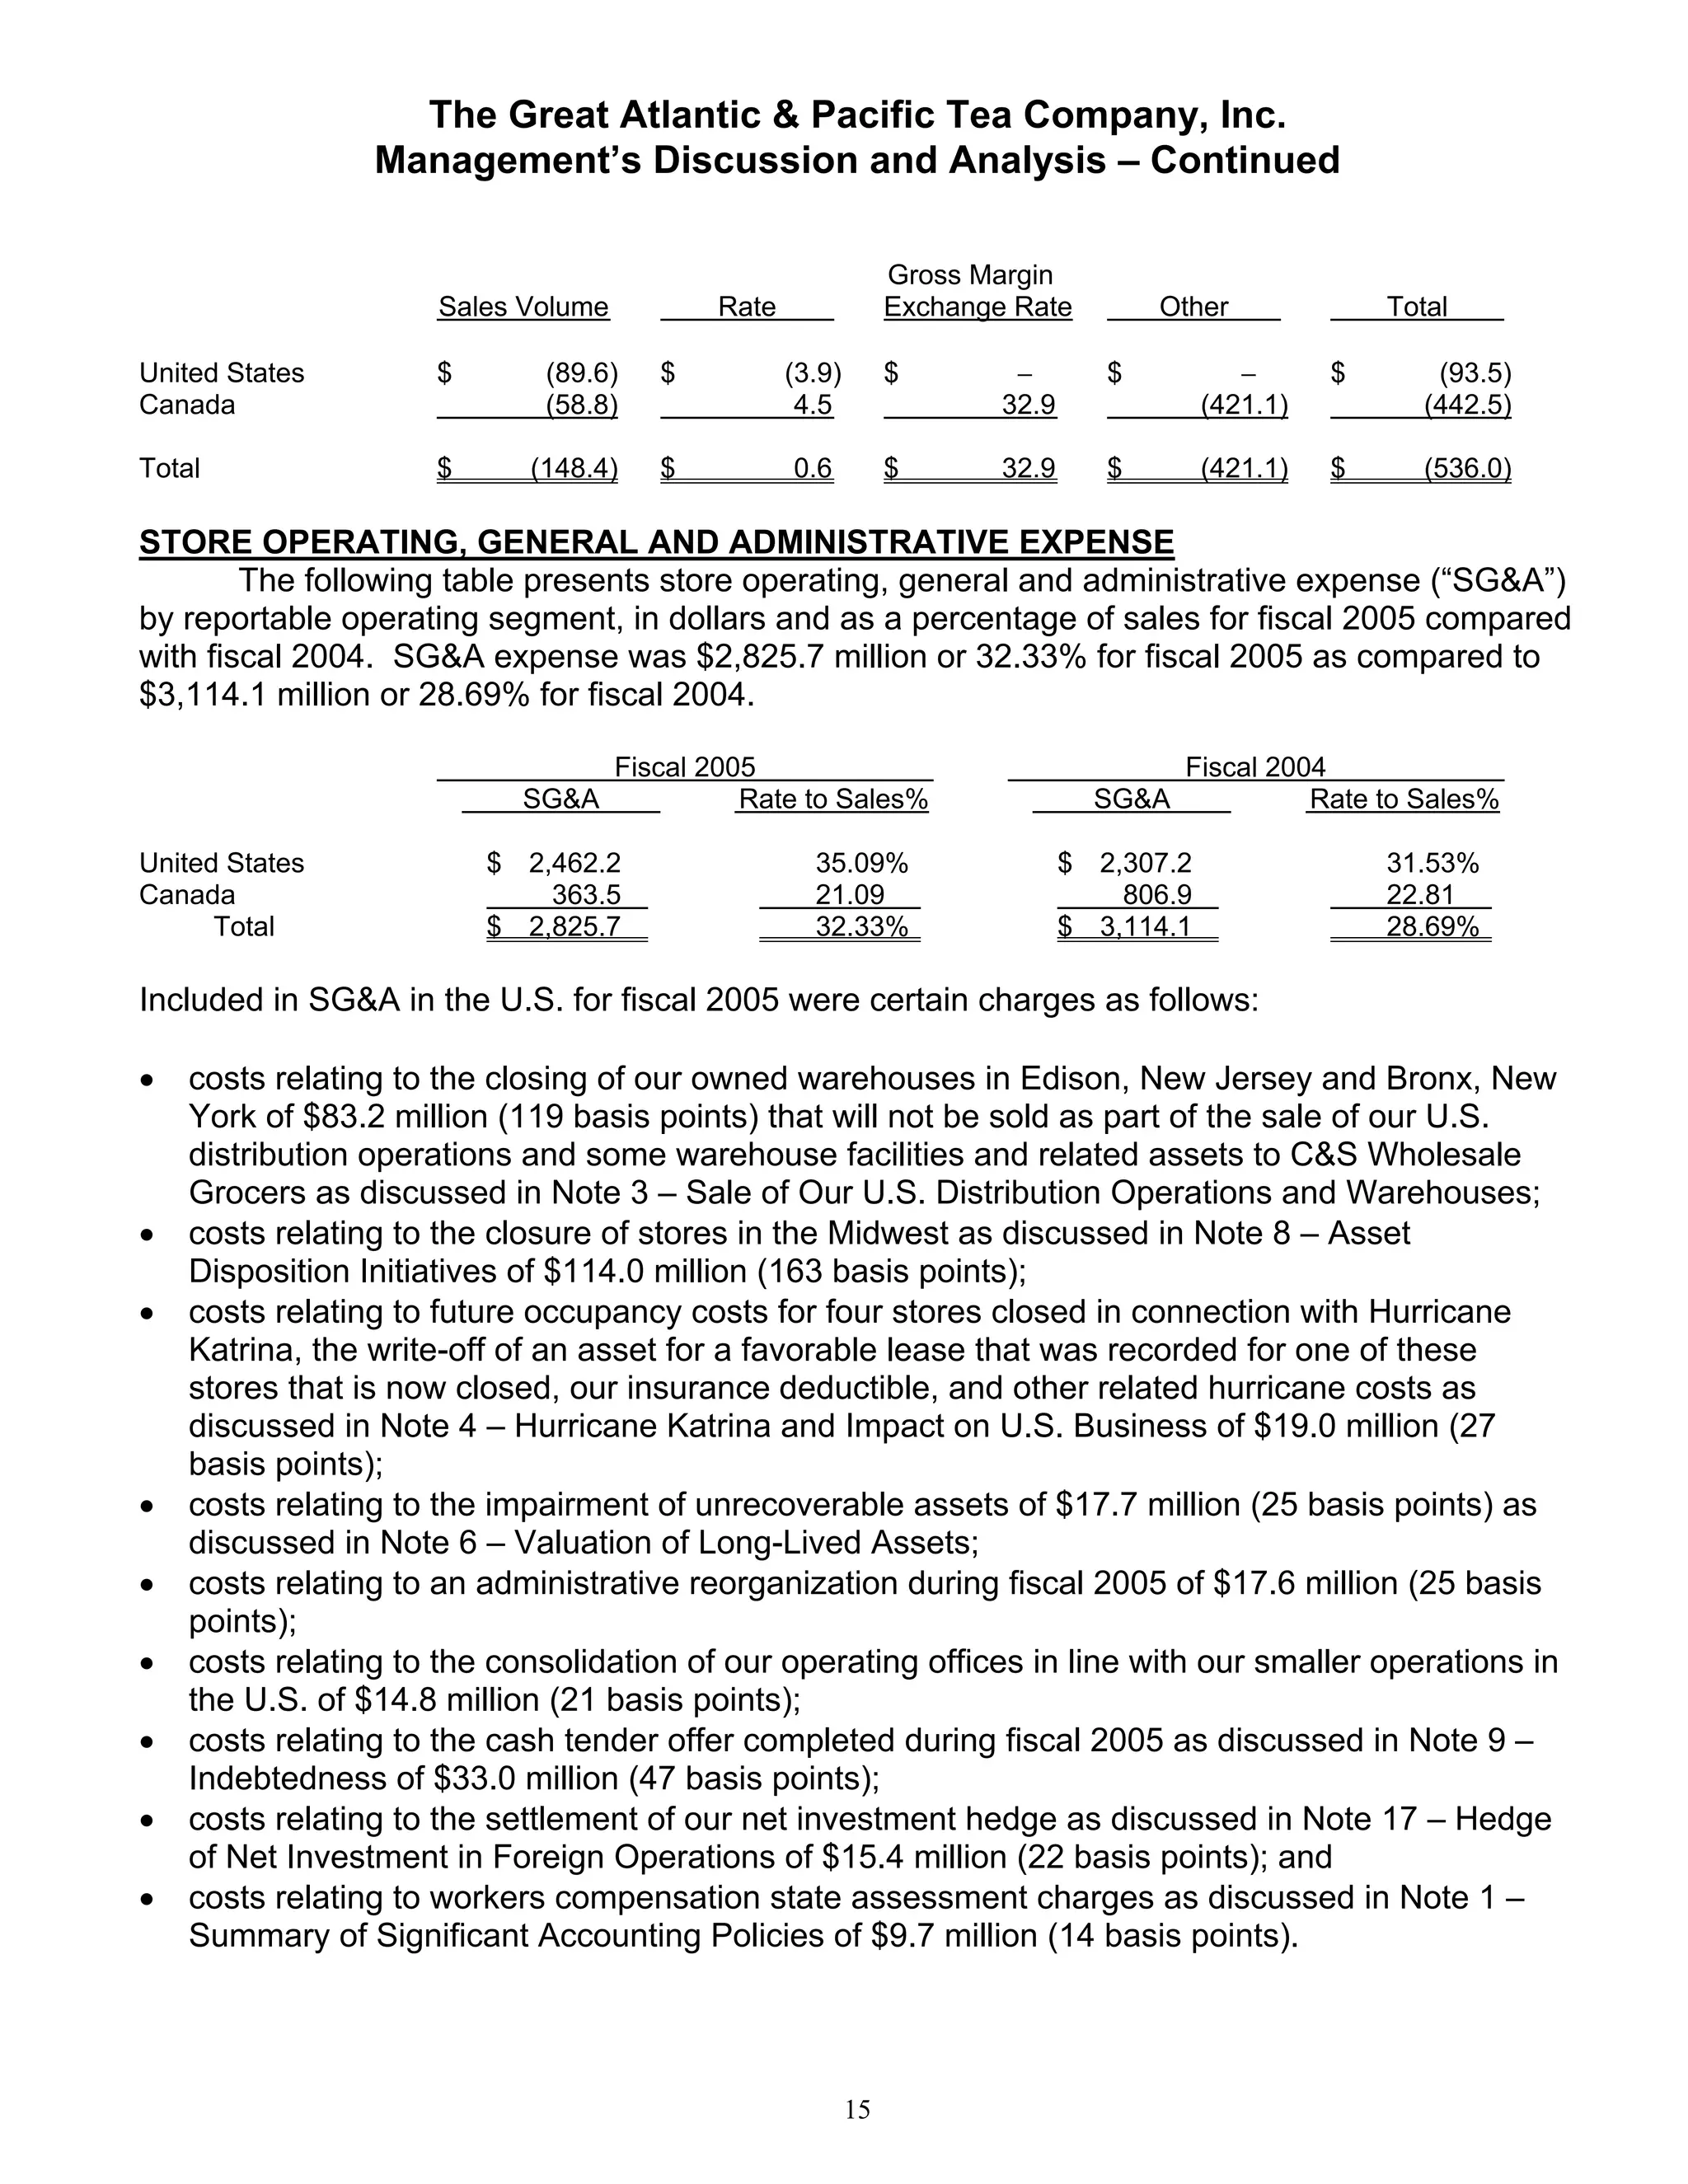
annual report to stockholders
                   fiscal 2005


 the great atlantic & pacific tea co., inc.
Table of Contents
Executive Chairman Letter to Stockholders.................................................                    3
President and Chief Executive Officer Letter to Stockholders .....................                            5
Management’s Discussion and Analysis......................................................                    8
Consolidated Statements of Operations ......................................................                 52
Consolidated Statements of Stockholders’ Equity
     and Comprehensive (Loss) Income .....................................................                    53
Consolidated Balance Sheets......................................................................             54
Consolidated Statements of Cash Flows .....................................................                   55
Notes to Consolidated Financial Statements ...............................................                    56
Management’s Annual Report on Internal Control over Financial Reporting                                      122
Report of Independent Registered Public Accounting Firm .........................                            123
Five Year Summary of Selected Financial Data ..........................................                      125
Executive Officers........................................................................................   127
Board of Directors........................................................................................   127
Stockholder Information...............................................................................       128


                                                                     2
Company Profile
The Great Atlantic & Pacific Tea Company, Inc. (“We,” “Our,” “Us” or “our Company”), based in
Montvale, New Jersey, operates conventional supermarkets, combination food and drug stores,
and limited assortment food stores in 9 U.S. states and the District of Columbia under the A&P,
Waldbaum’s, The Food Emporium, Super Foodmart, Super Fresh, Farmer Jack, Sav-A-
Center and Food Basics trade names.

EXECUTIVE CHAIRMAN LETTER TO STOCKHOLDERS


To Our Stockholders:

       Fiscal 2005 was a year of momentous and positive change for A&P, as we took decisive
actions to strengthen our financial position, reduce operating costs, and launch dynamic retail
strategies to restore profitability and stimulate growth.

•   Through the successful divestiture of our Canadian operations completed in August to Metro,
    Inc., we realized the substantial value of that business, built over the past decade. In addition
    to the cash proceeds that transformed our balance sheet, we gained a significant investment
    position in the new combined entity, giving A&P a meaningful stake in one of the most
    profitable and growth-oriented retail enterprises in North America.

•   We moved to upgrade the quality and lower the cost of logistical support of our U.S. store
    network, by extending our business relationship with C&S Wholesale Grocers, Inc. to
    encompass virtually all distribution activity and large scale volume purchasing of goods.

•   We reviewed our organization and administration, producing substantial reductions that
    aligned our cost structure to the revenue base of the new A&P, following the Canadian sale
    and the strategic closure of underperforming U.S. stores during the year.

       The sale of A&P Canada also fostered a positive change in our leadership structure.
Effective August 15, 2005, I became Executive Chairman of the Board, fully assuming long-range
strategic leadership of the Company; and former A&P Canada CEO Eric Claus became President
and Chief Executive Officer, with full responsibility for the day to day operation of A&P.

      Operating through his new Executive Management Team, Eric completed the
administrative reductions initiated earlier in the year; centralized direction of the business at the
headquarters level, and took immediate steps to upgrade operations and merchandising, and
improve our every-day pricing and promotional appeal.

       The combined impact of these cost reduction, reorganization and operating measures
turned the tide of our results during the second half of Fiscal 2005, as we posted our best identical
stores sales increases in many quarters, and a corresponding improvement in profit from store
operations.

       In December 2005, our Board of Directors endorsed a comprehensive strategic operating
plan submitted by the new Executive Management Team.


                                                   3
That plan combines dynamic retail strategies with strict cost management, to return A&P to
sustainable profitability by Fiscal 2007, steadily grow our consumer franchise and market share,
and position the business to take advantage of suitable growth opportunities going forward.
Specific elements of the strategic plan, our ongoing results and future goals for the Company will
be addressed by Eric Claus in the accompanying letter that follows.

      Early in Fiscal 2006, our Board of Directors approved the payment of a special dividend in
the amount of $300 million which was distributed to all our stockholders in April. This sharing of
proceeds from the Canadian divestiture with investors reflected both our appreciation of their
ongoing support, and growing confidence in our turnaround and growth prospects.

       By virtue of our decisive actions in the past year, our new leadership and our exciting retail
strategies, it is my belief that we are better positioned than ever to embrace the developing sea
changes in both the nature and structure of our industry, and convert them to profitable
opportunities for A&P in North America.

        Finally, I want to pay special tribute to our Sav-A-Center management team and associates
in New Orleans. As the result of their commitment and fortitude in the wake of Hurricane Katrina’s
terrible devastation last fall, we now have 23 stores open and serving grateful customers who
remained in their hard-hit communities, and those returning to them. I cannot overstate our
admiration for this intrepid team, whose amazing accomplishment has truly inspired us all.

       In closing, my thanks to all of our key stakeholders – our customers, employees, suppliers
and stockholders – for their ongoing support through challenging times of change, as we work to
realize both our immediate objectives and the long-range success of the New A&P. I also want to
express my thanks to our Board of Directors for their diligent participation and strong support
throughout the planning and execution of our strategic restructuring.


Sincerely,


Christian Haub,
Executive Chairman


                                                  4
PRESIDENT AND CHIEF EXECUTIVE OFFICER LETTER TO STOCKHOLDERS


To Our Stockholders:

       This is my first year-end address as Chief Executive Officer of A&P, and I’m honored to be
entrusted with leadership at such an exciting time for our Company.

       Many difficult decisions and much hard work created the opportunity we have at A&P
today, and my thanks go to Christian Haub and our Board of Directors for their courageous and
determined actions, and for their vote of confidence in our new Executive Management Team.

      I commend our new team and all of our associates, who despite significant organizational
changes following our midyear transition, remained focused on the business and revitalized our
key operating results in the second half. This was a tall order for our people, and they responded
admirably.

       In those months, we rapidly enforced fundamental operating, purchasing and
merchandising disciplines, and curtailed activities and attached costs that had no direct bearing
on the retail business.


The Road Ahead

      Our Strategic Plan is designed to significantly improve our results to meet stockholders’
expectations through Fiscal 2007. We are focused on growth and expansion – rooted in three
overarching objectives – build sales profitably, reduce costs, and by Fiscal 2008, improve at least
75% of our store base to prototype standards in three retail formats: Fresh, Discount and
Gourmet.

Build Sales Profitably

•   Our new senior management team understands and is committed to its accountability for top
    and bottom line results.

•   We are negotiating more vigorously with product vendors, both directly and through C&S
    Wholesale Grocers, to significantly lower our cost of goods across the board. Our goal is to
    increase sales and direct product profitability, by serving as the most efficient purchasing
    agent for our customers. The lower cost of goods will also support more aggressive pricing
    and sharper ad specials on popular items without suppressing margins – to build profitable
    sales.

                                                 5
•   We will support those efforts on the Operations side by stressing the fundamental best
    practices – clean, well organized stores, courteous and professional associates, and store
    managers visible to employees and customers on the sales floor.

•   Comprehensive training will be delivered to the majority of our store associates in Fiscal 2006,
    as we roll out our “Make It Personal” customer service program across the Company.


Reduce Costs

•   We lowered overheads by approximately $50 million in Fiscal 2005 through the reduction of
    administrative and certain operating positions and other expenses.

•   In addition to the vigorous actions we are taking with vendors to continue to lower our costs on
    behalf of our customers, we will likewise continue in fiscal year 2006 to be dedicated to
    lowering our store operating, general and administrative overheads.

Bring Store Base to Standard

•   Our Board of Directors has approved a three-year capital development plan providing the
    funds necessary to develop our Fresh, Discount and Gourmet store formats in appropriate
    locations.

•   Our innovative Fresh store prototype – which sets our new standards for natural, organic,
    prepared and specialty foods along with everyday grocery, general merchandise and
    pharmacy offerings – combines the best elements of our former profitable Canadian format
    with those of our initial U.S. examples. It was launched in March in Midland Park, N.J. to a
    very positive customer and media response, and has maintained a consistent double-digit
    year-over-year sales increase. We will convert a significant number of stores to this format
    from Fiscal 2006 through Fiscal 2008.

•   We have totally revamped the look, product assortment and merchandising of our discount
    Food Basics format. We are convinced of the ability of this attractive, well-maintained,
    rewarding-to-shop discount supermarket to succeed in many U.S. markets as our original
    Food Basics operation did in Canada. We recently opened our totally new Food Basics
    prototype in Glassboro, N.J., and the shopper response and sales performance have borne
    out our confidence in the concept. As with our Fresh concept, we will convert the appropriate
    number of stores to this prototype Discount format from Fiscal 2006 through Fiscal 2008.

•   Later this year, we will begin elevating our Food Emporium business to world class levels in
    New York City by taking our menu, services and store design to an entirely new level. Our
    vision is to distinguish this venerable gourmet brand as the premier destination for fine foods.

•   At this writing, we are in the process of unveiling an aggressive, value-oriented marketing
    initiative for our Farmer Jack operations in Michigan, underlining our renewed commitment to
    that marketplace. Recalling prior tradition and success as Detroit’s Home Town Grocer, our
    “Jack is Back” launch will rekindle the “Farmer Jack Savings Time” aura that still resonates
    with the area’s quality-and-value-conscious shoppers. We have already seen financial
    improvement at Farmer Jack, due in part to the cost benefits of our amended labor agreement

                                                  6
there. We thank our union associates for demonstrating their commitment in that way, and are
   joining with them to usher in a great new era for customers and workers alike.

      The fresh thinking now transforming our business also includes exciting marketing
developments that we are applying across A&P formats and store banners.

       In New York City, its outer boroughs and on Long Island, customers of The Food
Emporium, and more recently our Waldbaum’s stores, are now enjoying the added convenience
of online shopping. This is a popular and growing element of our customer service offer that we
intend to expand across operations over time.

       These, and the additional improvements and innovations to come, are aimed at recreating
the unshakeable bond with consumers that John and George Hartford forged so many decades
ago, along the way to building in A&P the greatest retail enterprise of their era. Our go-to-market
strategies, and the backstage efforts supporting them, are aligned behind that traditional yet ever-
timely principle.

       Despite the many challenges ahead of us, I am confident about what’s in store for A&P and
proud to be part of it. Our assets include a strong balance sheet, improving results, irreplaceable
locations, talented and committed leadership, dedicated associates, and targeted retail formats
appealing to specific and profitable customer segments.

         Our plan is simple yet strategically sound. It has been communicated throughout the
Company, as has our determination to see it through. Our ultimate vision is to restore The Great
A&P to its rightful position as a leader – where “Fresh Thinking Since 1859” not only defines an
illustrious past, but ensures a promising future.

      With the essential ingredients for success in place, it’s all up to us, and I look forward to
working with my team, and all of our associates, in achieving it.


Sincerely,


Eric Claus
President and Chief Executive Officer


                                                   7
The Great Atlantic & Pacific Tea Company, Inc.
                       Management’s Discussion and Analysis


INTRODUCTION
      The following Management’s Discussion and Analysis is intended to help the reader
understand the financial position, operating results, and cash flows of The Great Atlantic and Pacific
Tea Company, Inc. It should be read in conjunction with our financial statements and the
accompanying notes (“Notes”). It discusses matters that Management considers relevant to
understanding the business environment, financial position, results of operations and our
Company’s liquidity and capital resources. These items are presented as follows:

•     Basis of Presentation – a discussion of our Company’s fiscal year-end.

•     Overview — a general description of our business; the value drivers of our business;
      measurements; opportunities; challenges and risks; and initiatives.

•     2006 Outlook — a discussion of certain trends or business initiatives for the upcoming year
      that Management wishes to share with the reader to assist in understanding the business.

•     Review of Continuing Operations and Liquidity and Capital Resources – a discussion of
      results for fiscal 2005 and 2004, significant business initiatives, current and expected future
      liquidity and the impact of various market risks on our Company.

•     Market Risk – a discussion of the impact of market changes on our consolidated financial
      statements.

•     Critical Accounting Estimates – a discussion of significant estimates made by Management.

•     Impact of New Accounting Pronouncements – a discussion of authoritative pronouncements
      that have been or will be adopted by our Company.


BASIS OF PRESENTATION
       Our fiscal year ends on the last Saturday in February. Fiscal 2005 ended February 25,
2006, fiscal 2004 ended February 26, 2005, and fiscal 2003 ended February 28, 2004. Fiscal 2005
and fiscal 2004 were each comprised of 52 weeks, and fiscal 2003 was comprised of 53 weeks.
Except where noted, all amounts are presented in millions, and all net income (loss) per share data
presented is both basic and diluted.


                                                8
The Great Atlantic & Pacific Tea Company, Inc.
                Management’s Discussion and Analysis – Continued


OVERVIEW
        The Great Atlantic & Pacific Tea Company, Inc., based in Montvale, New Jersey,
operates conventional supermarkets, combination food and drug stores and discount food stores
in 9 U.S. states and the District of Columbia. Our Company’s business consists strictly of our
retail operations, which totaled 405 stores as of February 25, 2006.

      Commencing in the second half of fiscal 2005, our United States retail operations are now
organized in three regions: North Region, operating A&P supermarkets in New York and Northern
New Jersey, The Food Emporium in Westchester County, N.Y, A&P/Super Foodmart stores in
Connecticut, and all Food Basics discount stores; Central Region, operating all Waldbaum’s
supermarkets, The Food Emporium in Manhattan, and the Farmer Jack supermarkets in
Michigan; and South Region, operating Super Fresh supermarkets in Baltimore and Philadelphia,
A&P supermarkets in Central New Jersey and Sav-A-Center supermarkets in the greater New
Orleans market.

       Focused operating and merchandising improvements combined with the continued
reduction of operating costs resulted in further progress for A&P.

        Alongside these systemic improvements that remain under way, our Company launched
outstanding examples of our future fresh stores to enthusiastic customer responses in New Jersey
and Baltimore as well as in New Orleans, where we, at the end of March 2006, have 23 stores
fully operative and thriving as they serve that recovering marketplace.

       Perhaps most notable as an indicator of our retail future was the unveiling in February of
our new-generation fresh store, in Midland Park, New Jersey. Combining the best Fresh product
and service elements previously introduced in the U.S. with those applied so successfully in our
former Canadian operations, this formula has produced spectacular sales gains at that location,
while generating considerable word-of-mouth and media attention in the market.

       The success of our newest Fresh remodels validates the prototype Midland Park design as
the general baseline for our future Fresh store rollout, which combined with our gourmet and
discount strategies, will result in a comprehensive and profitable three-tier marketing thrust to be
rolled out over the next three years. We are on track with an aggressive capital development
program that is consistent with our three-year strategic plan.

        Across the business, we continued driving intensive improvements – in merchandising, we
upgraded, re-priced and fine-tuned product assortments to combine customer appeal with greater
efficiency; while in operations, we continued to standardize best practices and improve our service
levels.

      We are making significant progress in improving our price and value image with
consumers, through more aggressive and strategic weekly ad features; and the steady
improvement of pricing levels, through our Temporary Price Reduction (“TPR”) program.

     The careful balance of operating and merchandising improvements, expense control
measures and retail pricing adjustments is monitored closely by senior management, to ensure


                                                 9
The Great Atlantic & Pacific Tea Company, Inc.
                Management’s Discussion and Analysis – Continued

both steadily improving results, and a more appealing and satisfying shopping experience for
customers.

      We are aggressively reducing our cost of goods through auctioning, strategic purchasing
changes with our vendors and volume buying with our supply and logistics provider, C&S
Wholesale Grocers.

        On the administrative side, the personnel reduction and reorganization initiative begun
earlier in the year was essentially completed in the fourth quarter, as we further consolidated
management and administration, and completed the conversion of our field operations from the
previous banner orientation to a more centralized framework.

      This action dovetailed with the consolidation of our headquarters management and support
personnel in Montvale, New Jersey. In addition to the significant cost savings generated, our
business will now realize the clear benefit of a cohesive team under one roof.


2006 OUTLOOK

      The ongoing improvement of our results, via the key actions described in our strategic plan,
remains management’s principal focus and objective for the first half of Fiscal 2006 and beyond.

        The resolution of previous organizational and logistical issues has positioned the company
to sustain sales and earnings improvement, with full emphasis on executing our marketing and
retail development plans, augmented by ongoing cost control disciplines throughout the company.

       Key elements are as follows:

•   Move forward with the conversion of appropriate locations to the Fresh format prototype
    successfully launched in Midland Park, New Jersey in the fourth quarter;

•   Launch the first example of our upgraded discount Food Basics concept;

•   Complete development of our new generation Gourmet concept, for introduction later in the
    year under our Food Emporium Gourmet banner in New York City;

•   Successfully complete the introduction of our new merchandising strategy for Farmer Jack in
    Michigan, reiterating our commitment to the market, and a new freshness and value
    proposition for area food shoppers.

•   Continue to improve our every-day grocery pricing and value image, through more efficient
    buying and distribution practices, promotional programs, and the expansion of our TPR
    program.

        Supporting those development efforts is ongoing adherence to cost control, and further
reduction wherever possible without compromising the growth and quality of our business. We
will continue to seek additional means of improving labor productivity in cooperation with our

                                                10
The Great Atlantic & Pacific Tea Company, Inc.
                 Management’s Discussion and Analysis – Continued

people and their labor unions, and by seeking all reasonable opportunities to lower administrative,
advertising, occupancy and other operating expenses.

       In summary, we are encouraged by the progress we have generated over the past two
quarters. More importantly, we are confident that the strategies we are executing provide ample
potential for continued and hopefully accelerated improvement.

      We fully believe that our improving operations, merchandising and store development will
enable us to continue elevating our competitive profile and operating performance in Fiscal 2006
and beyond.

        Various factors could cause us to fail to achieve these goals. These include, among others,
the following:

•   Actions of competitors could adversely affect our sales and future profits. The grocery retailing
    industry continues to experience fierce competition from other food retailers, super-centers,
    mass merchandisers, warehouse clubs, drug stores, dollar stores and restaurants. Our
    continued success is dependent upon our ability to effectively compete in this industry and to
    reduce operating expenses, including managing health care and pension costs contained in
    our collective bargaining agreements. The competitive practices and pricing in the food
    industry generally and particularly in our principal markets may cause us to reduce our prices
    in order to gain or maintain share of sales, thus reducing margins.

•   Changes in the general business and economic conditions in our operating regions, including
    the rate of inflation, population growth, the rising prices of oil and gas, the nature and extent of
    continued consolidation in the food industry and employment and job growth in the markets in
    which we operate, may affect our ability to hire and train qualified employees to operate our
    stores. This would negatively affect earnings and sales growth. General economic changes
    may also affect the shopping habits and buying patterns of our customers, which could affect
    sales and earnings. We have assumed economic and competitive situations will not worsen in
    fiscal 2006 and 2007. However, we cannot fully foresee the effects of changes in economic
    conditions, inflation, population growth, the rising prices of oil and gas, customer shopping
    habits and the consolidation of the food industry on our business.

•   Our capital expenditures could differ from our estimate if we are unsuccessful in acquiring
    suitable sites for new stores, or if development and remodel costs vary from those budgeted.

•   Our ability to achieve our profit goals will be affected by (i.) our success in executing category
    management and purchasing programs that we have underway, which are designed to
    improve our gross margins and reduce product costs while making our product selection more
    attractive to consumers, (ii.) our ability to achieve productivity improvements and shrink
    reduction in our stores, (iii.) our success in generating efficiencies in our supporting activities,
    and (iv.) our ability to eliminate or maintain a minimum level of supply and/or quality control
    problems with our vendors.

•   The vast majority of our employees are members of labor unions. While we believe that our
    relationships with union leaderships and our employees are satisfactory, we operate under
    collective bargaining agreements which periodically must be renegotiated. In the coming year,

                                                   11
The Great Atlantic & Pacific Tea Company, Inc.
                Management’s Discussion and Analysis – Continued

    we have several contracts expiring and under negotiation. In each of these negotiations rising
    health care and pension costs will be an important issue, as will the nature and structure of
    work rules. We are hopeful, but cannot be certain, that we can reach satisfactory agreements
    without work stoppages in these markets. However, the actual terms of the renegotiated
    collective bargaining agreements, our future relationships with our employees and/or a
    prolonged work stoppage affecting a substantial number of stores could have a material effect
    on our results.

•   The amount of contributions made to our pension and multi-employer plans will be affected by
    the performance of investments made by the plans and the extent to which trustees of the
    plans reduce the costs of future service benefits.

•   Our Company currently acquires a significant amount of our saleable inventory from one
    supplier, C&S Wholesale Grocers, Inc. Although there are a limited number of distributors that
    can supply our stores, we believe that other suppliers could provide similar product on
    comparable terms. However, a change in suppliers could cause a delay in distribution and a
    possible loss of sales, which would affect operating results adversely.

•   We have estimated our exposure to claims, administrative proceedings and litigation and
    believe we have made adequate provisions for them, where appropriate. Unexpected
    outcomes in both the costs and effects of these matters could result in an adverse effect on
    our earnings.

Other factors and assumptions not identified above could also cause actual results to differ
materially from those set forth in the forward-looking information. Accordingly, actual events and
results may vary significantly from those included in or contemplated or implied by forward-looking
statements made by us or our representatives.


REVIEW OF CONTINUING OPERATIONS AND LIQUIDITY AND CAPITAL
RESOURCES

      Our consolidated financial information presents the results related to our operations of
discontinued businesses separate from the results of our continuing operations. Both the
discussion and analysis that follows focus on continuing operations.

      As further discussed in Note 2- Divestiture of Our Business in Canada and Stores in the
Midwest, we sold our Canadian operations to Metro, Inc. at the close of business on August 13,
2005. Therefore, comparative information relating to our Canadian business that follows was
comprised of 24 weeks and 52 weeks during fiscal years 2005 and 2004, respectively.


                                                 12
The Great Atlantic & Pacific Tea Company, Inc.
                   Management’s Discussion and Analysis – Continued

FISCAL 2005 COMPARED WITH FISCAL 2004

        Sales for fiscal 2005 were $8.7 billion, compared with $10.9 billion for fiscal 2004;
comparable store sales, which includes stores that have been in operation for two full fiscal years
and replacement stores, increased 0.5%. Loss from continuing operations reversed from $184.0
million for fiscal 2004 to income from continuing operations of $390.4 million for fiscal 2005
primarily due to the gain on sale of our Canadian operations of $912.1 million. Net income per
share – basic and diluted for fiscal 2005 was $9.74 and $9.64, respectively, compared to a net
loss per share – basic and diluted of $4.88 for fiscal 2004.
                                                                                                  Favorable /
                                               Fiscal 2005             Fiscal 2004               (Unfavorable)       % Change
Sales                                 $           8,740.3             $ 10,854.9                  $(2,114.6)           (19.5%)
Increase in comparable store sales                     0.5%                    0.1%                   NA                 NA
                                                                               −
Gain on sale of Canadian operations                 912.1                                            912.1             100.0
Income (loss) from continuing
    operations                                     390.4                   (184.0)                   574.4               >100.0
Income (loss) from discontinued
    operations                                       2.2                      (4.1)                    6.3               >100.0
Net income (loss)                                  392.6                   (188.1)                   580.7               >100.0
Net income (loss) per share – basic                 9.74                     (4.88)                  14.62               >100.0
Net income (loss) per share - diluted               9.64                     (4.88)                  14.52               >100.0


SALES
        Sales for fiscal 2005 of $8,740.3 million decreased $2,114.6 million or 19.5% from sales of
$10,854.9 million for fiscal 2004. The lower sales were due to a decrease in U.S. sales of $301.2
million and a decrease in Canadian sales of $1,813.4 million. The following table presents sales
for each of our reportable operating segments for fiscal 2005 and fiscal 2004:

                                        Fiscal 2005                 Fiscal 2004                  Decrease            % Change
United States                          $  7,016.4                 $   7,317.6                $       (301.2)             (4.1%)
Canada                                    1,723.9                     3,537.3                      (1,813.4)            (51.3)
Total                                  $ 8,740.3                  $ 10,854.9                 $     (2,114.6)            (19.5%)

       The following details the dollar impact of several items affecting the decrease in sales by
reportable operating segment from fiscal 2004 to fiscal 2005:

                           Impact of           Impact of       Foreign       Comparable          Impact of
                             New                Closed        Exchange         Store             Hurricane
                            Stores              Stores          Rate           Sales              Katrina        Other            Total

                                                                    −
United States          $       25.2        $     (330.0)      $              $        30.7       $   (36.3)  $      9.2 $ (301.2)
                                                                                                       −
Canada                         47.6               (65.1)          162.0                1.6                     (1,959.5) (1,813.4)
      Total            $       72.8        $     (395.1)      $   162.0      $        32.3       $   (36.3)_ $ (1,950.3) $ (2,114.6)

       The decrease in U.S. sales was primarily attributable to the closing of 67 stores since the
beginning of fiscal 2004, of which 49 were closed in fiscal 2005 primarily in the Midwest,
decreasing sales by $330.0 million, and the decrease in sales caused by the overall impact of
Hurricane Katrina of $36.3 million. These decreases were partially offset by the opening or re-
                                                                      13
The Great Atlantic & Pacific Tea Company, Inc.
                Management’s Discussion and Analysis – Continued

opening of 18 new stores since the beginning of fiscal 2004, of which 2 were opened or re-opened
in fiscal 2005, increasing sales by $25.2 million, the increase in comparable store sales for fiscal
2005 of $30.7 million or 0.5% as compared with fiscal 2004, and the increase in sales relating to
an information technology services agreement with Metro, Inc. of $9.2 million.

        The decrease in Canadian sales was primarily attributable to the sale of our Canadian
operations that resulted in the inclusion of 24 weeks of sales during fiscal 2005 as compared to 52
weeks during fiscal 2004, decreasing sales by $1,959.5 million, and the closure of 14 stores since
the beginning of fiscal 2004, of which 1 was closed in fiscal 2005, decreasing sales by $65.1
million. These decreases were partially offset by the opening or re-opening of 9 stores since the
beginning of fiscal 2004, of which 1 was opened or re-opened in fiscal 2005, increasing sales by
$47.6 million, the favorable effect of the Canadian exchange rate, which increased sales by
$162.0 million, and the increase in comparable store sales for fiscal 2005 of $1.6 million or 0.1%
for Company-operated stores and franchised stores combined, as compared to fiscal 2004.

       Average weekly sales per supermarket for the U.S. were approximately $330,000 for fiscal
2005 versus $323,100 for the corresponding period of the prior year, an increase of 2.1%
primarily due to the impact of closing smaller stores and positive comparable store sales.
Average weekly sales per supermarket for Canada were approximately $298,600 for fiscal 2005
versus $285,900 for the corresponding period of the prior year, an increase of 4.4%. This
increase was primarily due to the increase in the Canadian exchange rate and higher comparable
store sales.


GROSS MARGIN
       The following table presents gross margin dollar results and gross margin as a percentage of
sales by reportable operating segment for fiscal 2005 as compared to fiscal 2004. Gross margin as
a percentage of sales increased 65 basis points to 28.67% for fiscal 2005 from 28.02% for fiscal
2004 primarily caused by the sale of our Canadian operations which had a lower gross margin rate.
We believe the impact on margin for changes in costs and special reductions was not significant.

                                 Fiscal 2005                             Fiscal 2004

                       Gross Margin       Rate to Sales%        Gross Margin      Rate to Sales%

United States           $ 2,084.4              29.71%           $ 2,177.9              29.76%
Canada                      420.7              24.40                863.2              24.40
      Total             $ 2,505.1              28.67%           $ 3,041.1              28.02%

       The following table details the dollar impact of several items affecting the gross margin
dollar decrease from fiscal 2004 to fiscal 2005:


                                                 14
The Great Atlantic & Pacific Tea Company, Inc.
                 Management’s Discussion and Analysis – Continued

                                                                Gross Margin
                      Sales Volume          Rate                Exchange Rate         Other              Total

                                                                         −                    −
United States        $       (89.6)     $          (3.9)        $                 $                  $       (93.5)
Canada                       (58.8)                 4.5                 32.9               (421.1)          (442.5)

Total                $      (148.4)     $          0.6          $       32.9      $        (421.1)   $      (536.0)

STORE OPERATING, GENERAL AND ADMINISTRATIVE EXPENSE
        The following table presents store operating, general and administrative expense (“SG&A”)
by reportable operating segment, in dollars and as a percentage of sales for fiscal 2005 compared
with fiscal 2004. SG&A expense was $2,825.7 million or 32.33% for fiscal 2005 as compared to
$3,114.1 million or 28.69% for fiscal 2004.

                                     Fiscal 2005                                        Fiscal 2004
                            SG&A               Rate to Sales%                    SG&A             Rate to Sales%

United States            $ 2,462.2                   35.09%                    $ 2,307.2                 31.53%
Canada                       363.5                   21.09                         806.9                 22.81
      Total              $ 2,825.7                   32.33%                    $ 3,114.1                 28.69%

Included in SG&A in the U.S. for fiscal 2005 were certain charges as follows:

•   costs relating to the closing of our owned warehouses in Edison, New Jersey and Bronx, New
    York of $83.2 million (119 basis points) that will not be sold as part of the sale of our U.S.
    distribution operations and some warehouse facilities and related assets to C&S Wholesale
    Grocers as discussed in Note 3 – Sale of Our U.S. Distribution Operations and Warehouses;
•   costs relating to the closure of stores in the Midwest as discussed in Note 8 – Asset
    Disposition Initiatives of $114.0 million (163 basis points);
•   costs relating to future occupancy costs for four stores closed in connection with Hurricane
    Katrina, the write-off of an asset for a favorable lease that was recorded for one of these
    stores that is now closed, our insurance deductible, and other related hurricane costs as
    discussed in Note 4 – Hurricane Katrina and Impact on U.S. Business of $19.0 million (27
    basis points);
•   costs relating to the impairment of unrecoverable assets of $17.7 million (25 basis points) as
    discussed in Note 6 – Valuation of Long-Lived Assets;
•   costs relating to an administrative reorganization during fiscal 2005 of $17.6 million (25 basis
    points);
•   costs relating to the consolidation of our operating offices in line with our smaller operations in
    the U.S. of $14.8 million (21 basis points);
•   costs relating to the cash tender offer completed during fiscal 2005 as discussed in Note 9 –
    Indebtedness of $33.0 million (47 basis points);
•   costs relating to the settlement of our net investment hedge as discussed in Note 17 – Hedge
    of Net Investment in Foreign Operations of $15.4 million (22 basis points); and
•   costs relating to workers compensation state assessment charges as discussed in Note 1 –
    Summary of Significant Accounting Policies of $9.7 million (14 basis points).


                                                           15
The Great Atlantic & Pacific Tea Company, Inc.
                  Management’s Discussion and Analysis – Continued

Partially offset by:

•   recoveries from our VISA/Mastercard antitrust class action litigation as discussed in Note 18 –
    Commitments and Contingencies of $1.5 million (2 basis points).
•   net gains on real estate activity of $14.9 million (21 basis points) during fiscal 2005.

SG&A in the U.S. for fiscal 2004 also included certain charges as follows:

•   costs relating to the impairment of unrecoverable assets of $34.7 million (47 basis points);
•   costs relating to severance and other charges of $10.7 million (15 basis points) relating to an
    administrative reorganization; and
•   costs relating to an increase in our workers’ compensation and general liability reserves of
    $27.2 million (37 basis points) in response to both adverse development of prior years’ costs
    and other developments including a continuing trend of rising costs.

Partially offset by:

•   a reduction in the vacation accrual of $8.6 million (12 basis points) due to a change in the
    vacation entitlement practice. Prior to the change in the vacation operating policy, non-union
    employees were fully vested on the first day of the calendar year. As such under SFAS No.
    43, “Compensated Absences”, our Company accrued vacation as it was earned by non-union
    employees (earned in the calendar year immediately preceeding the January 1 vesting date).
    Under the new vacation operating policy, non-union employees vest over the year that
    vacation is earned, and accordingly, our Company recorded a one-time adjustment to reduce
    the liability.
•   net gains on real estate activity of $22.5 million (31 basis points) during fiscal 2005.

         Excluding the items listed above, SG&A within our core U.S. operations as a percentage of
sales decreased by 26 basis points during fiscal 2005 as compared to fiscal 2004 primarily due to
a reduction in administrative expenses of $49.5 million, a reduction in advertising costs of $9.9
million, and a reduction in depreciation expense of $9.9 million partially offset by an increase in
utilities expense of $15.9 million due to rising costs of oil and gas.

        The decrease in SG&A in Canada of $443.4 million (172 basis points) is primarily due to
the inclusion of 24 weeks of costs during fiscal 2005 as compared to 52 weeks of costs during
fiscal 2004, in addition to (i.) lower depreciation expense of $21.6 million as the Canadian assets
were sold during fiscal 2005 as discussed in Note 2 - Divestiture of Our Business in Canada and
Stores in the Midwest, and (ii.) the absence of costs relating to the settlement of the Canadian
lawsuit of $24.9 million which were included in fiscal 2004.


                                                 16
The Great Atlantic & Pacific Tea Company, Inc.
                    Management’s Discussion and Analysis – Continued


       During fiscal 2005 and fiscal 2004, we recorded impairment losses on long-lived assets as
follows:
                                                               Fiscal 2005                     Fiscal 2004
                                                        U.S.     Canada    Total       U.S.      Canada    Total
Impairments due to closure or conversion in the
  normal course of business                              $ 9,851 $   506 $10,357 $ 6,000 $          709 $ 6,709
                                                                       − 17,728 34,688                − 34,688
Impairments due to unrecoverable assets                   17,728
Impairments due to closure of stores impacted by
  Hurricane Katrina (1)                                                −                  −           −        −
                                                           6,090            6,090
Impairments related to the closure of stores in the
  Midwest (2)                                                          −                  −           −        −
                                                           6,873            6,873
Impairments related to the sale of U.S. distribution
  operations and warehouses (3)                                        −                  −           −        −
                                                           8,590            8,590
Impairments related to property held as part of the 2001
  Asset Disposition (2)                                        −       −           −                  −
                                                                                       2,659               2,659
Impairments related to the Farmer Jack restructuring (2)       −       −           −                  −
                                                                                          90                  90

Total impairments                                     $49,132 $      506 $49,638 $43,437 $          709 $44,146

       (1) Refer to Note 4 – Hurricane Katrina and Impact on U.S. Business
       (2) Refer to Note 8 – Asset Disposition Initiatives
       (3) Refer to Note 3 – Sale of our U.S. Distribution Operations and Warehouses

      The effects of changes in estimates of useful lives were not material to ongoing
depreciation expense.

        If current operating levels do not improve, there may be additional future impairments on
long-lived assets, including the potential for impairment of assets that are held and used.


GAIN ON SALE OF CANADIAN OPERATIONS
        As further discussed in Note 2 - Divestiture of Our Business in Canada and Stores in the
Midwest, we sold our Canadian operations to Metro, Inc. at the close of business on August 13,
2005. As a result of this sale, we recorded a pretax gain of $912.1 million (gain of $805.3 million
after tax) during fiscal 2005.


INTEREST EXPENSE
      Interest expense of $92.2 million for fiscal 2005 decreased from the prior year amount of
$114.1 million due primarily to (i.) the repurchase of the majority of our 7.75% Notes due April 15,
2007 and our 9.125% Senior Notes due December 15, 2011 resulting in a reduction in interest
expense of $15.8 million, (ii.) a decrease in capitalized interest expense of $1.0 million due to
mainly a reduction in new store builds, and (iii.) lower interest expense of $8.8 million relating to
our Canadian operations due to the inclusion of its operating results for 24 weeks for fiscal 2005
as compared to 52 weeks for fiscal 2004 as a result of its sale, partially offset by higher interest
expense resulting from our on-balance sheet long-term real estate liabilities, which includes sale
leaseback of Company-owned properties entered into in the fourth quarter of fiscal 2003, of
approximately $1.4 million and sale leaseback of locations for which we received landlord
allowances of $0.5 million.

                                                       17
The Great Atlantic & Pacific Tea Company, Inc.
                 Management’s Discussion and Analysis – Continued


INCOME TAXES
       The provision for income taxes from continuing operations for fiscal 2005 was $128.9 million
(a $110.4 million provision for our U.S. operations and a $18.5 million provision for our Canadian
operations) compared to a provision for income taxes from continuing operations for fiscal 2004 of
$0.5 million (a $4.5 million provision for our U.S. operations and a $4.0 million benefit for our
Canadian operations). Consistent with prior year, we continue to record a valuation allowance
against our U.S. net deferred tax assets.

       For fiscal 2005, our effective income tax rate of 24.8% changed from the effective income
tax rate of 0.3% for fiscal 2004 as follows:

                                    Fiscal 2005                    Fiscal 2004

                                             Effective                     Effective
                             Tax Provision   Tax Rate     Tax Provision    Tax Rate
United States                $ (110,388)        21.3%     $    (4,500)         2.5%
Canada                           (18,539)        3.5%           3,972         (2.2%)
                             $ (128,927)        24.8%     $      (528)         0.3%

       The change in our effective tax rate was primarily due to the tax provisions we recorded in
the U.S. in connection with (i.) our Company’s Domestic Reinvestment Plan as discussed in Note
12 – Income Taxes and (ii.) the sale of our Canadian operations that occurred during fiscal 2005.


DISCONTINUED OPERATIONS
        Beginning in the fourth quarter of fiscal year 2002 and in the early part of the first quarter of
fiscal 2003, we decided to sell our operations located in Northern New England and Wisconsin, as
well as our Eight O’Clock Coffee business. These asset sales are now complete.

      Although the Canadian operations have been sold as of February 25, 2006, the criteria
necessary to classify the Canadian operations as discontinued have not been satisfied as our
Company has retained significant continuing involvement in the operations of this business upon its
sale.


                                                   18
The Great Atlantic & Pacific Tea Company, Inc.
                   Management’s Discussion and Analysis – Continued

        The income from operations of discontinued businesses, net of tax, for fiscal 2005 was $1.6
million as compared to a loss from operations of discontinued businesses, net of tax, of $1.4 million
for fiscal 2004 and is detailed by business as follows:

                                                         Fiscal 2005
                                                                    Eight
                                  Northern                         O’Clock
                                New England         Kohl’s         Coffee         Total
(Loss) income from operations of
    discontinued businesses
                                          −               −              −             −
Sales                          $                $               $             $
Operating expenses                      (58)          3,049           (187)        2,804
(Loss) income from operations of
  discontinued businesses, before
  tax                                   (58)          3,049           (187)         2,804
Tax benefit (provision)                  24          (1,281)            79         (1,178)
(Loss) income from operations of
  discontinued businesses, net
  of tax                       $        (34)    $     1,768     $     (108)   $    1,626

Disposal related costs included in operating expenses above:
Non-accruable closing costs      $        (58) $         (62)   $     (187)   $      (307)
Reversal of previously accrued
                                            −                            −
  occupancy related costs                              3,717                       3,717
Interest accretion on present value
  of future occupancy and
                                            −                            −
  severance costs                                       (606)                       (606)
Total disposal related costs     $        (58) $       3,049    $     (187)   $    2,804


                                                         19
The Great Atlantic & Pacific Tea Company, Inc.
                  Management’s Discussion and Analysis – Continued


                                                        Fiscal 2004
                                                                   Eight
                                   Northern                       O’Clock
                                 New England       Kohl’s         Coffee         Total
Income (loss) from operations of
    discontinued businesses
                                           −             −              −              −
Sales                            $             $               $             $
Operating expenses                      292           (981)          (698)        (1,387)
Income (loss) from operations of
  discontinued businesses, before
  tax                                   292           (981)          (698)        (1,387)
                                           −             −              −              −
Tax provision
Income (loss) from operations of
  discontinued businesses, net of
  tax                            $      292    $      (981)    $     (698)   $    (1,387)

Disposal related costs included in operating expenses above:
                                                          −             −
Severance and benefits           $      (326)    $             $             $      (326)
Reversal of previously accrued
                                            −                           −
  occupancy related costs                               354                          354
Non-accruable closing costs               626          (595)         (698)          (667)
Interest accretion on present value
  of future occupancy and
                                                                        −
  severance costs                          (8)         (740)                        (748)
Total disposal related costs     $        292    $     (981)   $     (698)   $    (1,387)

      The gain on disposal of discontinued operations, net of tax, was $0.6 million for fiscal 2005
as compared to a loss on disposal of discontinued operations, net of tax, of $2.7 million for fiscal
2004 and is detailed by business as follows:

                                                        Fiscal 2005
                                                                   Eight
                                   Northern                       O’Clock
                                 New England       Kohl’s         Coffee         Total
Gain on disposal of discontinued
  businesses
                                           −                            −
Gain on sale of property        $              $     1,002     $             $    1,002
Gain on disposal of discontinued
                                           −                            −
  businesses, before tax                             1,002                        1,002
                                           −                            −
Tax provision                                         (421)                        (421)
Gain on disposal of discontinued
                                           −                            −
  businesses, net of tax        $              $       581     $             $      581


                                                        20
The Great Atlantic & Pacific Tea Company, Inc.
                  Management’s Discussion and Analysis – Continued


                                                           Fiscal 2004
                                                                      Eight
                                   Northern                          O’Clock
                                 New England          Kohl’s         Coffee                 Total
Loss on disposal of discontinued
  businesses
                                           −                                     −
Property impairments            $                 $      (602)     $                   $       (602)
                                                            −
Loss on sale of business                                                    (2,100)          (2,100)
Loss on disposal of discontinued
                                           −
  businesses, before tax                                 (602)              (2,100)          (2,702)
                                           −                −                    −                −
Tax provision
Loss on disposal of discontinued
                                           −
  businesses, net of tax        $                 $      (602)     $        (2,100)    $     (2,702)


FISCAL 2004 COMPARED WITH FISCAL 2003
       Sales for fiscal 2004 were $10.9 billion compared with $10.9 billion for fiscal 2003, which
was a 53-week year; comparable store sales, which includes stores that have been in operation
for two full fiscal years and replacement stores, increased 0.1%. Loss from continuing operations
decreased from $213.2 million in fiscal 2003 to $184.0 million in fiscal 2004. Net loss per share –
basic and diluted for fiscal 2004 was $4.88 compared to $4.08 for fiscal 2003, an increase of
$0.80 per share.

                                                                                       Favorable /
                                       Fiscal 2004        Fiscal 2003                 (Unfavorable)    % Change
Sales                                 $ 10,854.9         $ 10,899.3                    $ (44.4)           (0.4%)
Increase in comparable store sales
    for Company-operated stores              0.1%                 0.9%                      NA             NA
Loss from continuing operations            (184.0)               (213.2)                   29.2           13.7
(Loss) income from discontinued
    operations                               (4.1)                 64.3                    (68.4)       (106.4)
Cumulative effect of a change in
                                               −
    accounting principle – FIN 46-R                                 (8.0)                    8.0         100.0
Net loss                                   (188.1)               (156.9)                   (31.2)        (19.9)
Net loss per share                           (4.88)                (4.08)                  (0.80)        (19.6)


SALES

        Sales for fiscal 2004 of $10,854.9 million decreased $44.4 million or -0.4% from sales of
$10,899.3 million for fiscal 2003. The lower sales were due to a decrease in U.S. sales of $213.3
million partially offset by an increase in Canadian sales of $168.9 million. The increase in
Canadian sales was primarily due to the favorable impact of the Canadian exchange rate. The
following table presents sales for each of our operating segments for fiscal 2004 and fiscal 2003:


                                                          21
The Great Atlantic & Pacific Tea Company, Inc.
                Management’s Discussion and Analysis – Continued

                                                                                     (Decrease)
                                     Fiscal 2004          Fiscal 2003                 Increase               % Change
United States                      $ 7,317.6            $   7,530.9              $        (213.3)                (2.8%)
Canada                                 3,537.3              3,368.4                        168.9                  5.0
Total                              $ 10,854.9           $ 10,899.3               $         (44.4)                (0.4%)

       The following details the dollar impact of several items affecting the (decrease) increase in
sales by operating segment from fiscal 2003 to fiscal 2004:
                       Impact of        Impact of    Foreign    Comparable               Impact of
                         New             Closed     Exchange      Store                    53rd
                        Stores           Stores       Rate        Sales                    Week          Total

                                                          −
United States      $     252.5      $     (286.1)   $           $       (47.1)       $     (132.6)   $    (213.3)
Canada                   315.7            (330.7)       215.0            33.6               (64.7)         168.9
    Total          $     568.2      $     (616.8)   $   215.0   $       (13.5)       $     (197.3)   $     (44.4)

        The decrease in U.S. sales was attributable to the closing of 35 stores since the beginning
of fiscal 2003, of which 18 were closed in fiscal 2004, decreasing sales by $286.1 million, the
decrease in comparable store sales for fiscal 2004 of $47.1 million or -0.6% as compared with
fiscal 2003, and the unfavorable impact of the 53rd week included in fiscal 2003 which decreased
sales by $132.6 million. These decreases were partially offset by the opening or re-opening of 26
new stores since the beginning of fiscal 2003, of which 16 were opened or re-opened in fiscal
2004, increasing sales by $252.5 million. Included in the 35 stores closed since the beginning of
fiscal 2003 were 6 stores closed as part of the asset disposition initiative as discussed in Note 8 of
our Consolidated Financial Statements.

        The increase in Canadian sales was attributable to the opening or re-opening of 17 stores
since the beginning of fiscal 2003, of which 8 were opened or re-opened in fiscal 2004, increasing
sales by $315.7 million, the favorable effect of the Canadian exchange rate, which increased
sales by $215.0 million, and the increase in comparable store sales for fiscal 2004 of $33.6 million
or 1.0% for Company-operated stores and franchised stores combined, as compared to fiscal
2003. These increases were partially offset by the closure of 23 stores since the beginning of
2003, of which 13 were closed in fiscal 2004, decreasing sales by $330.7 million and the
unfavorable impact of the 53rd week included in fiscal 2003 which decreased sales by $64.7
million.

       Average weekly sales per supermarket for the U.S. were approximately $323,100 for fiscal
2004 versus $310,000 for the corresponding period of the prior year, an increase of 4.2%
primarily due to the impact of openings and closings with net higher average weekly sales.
Average weekly sales per supermarket for Canada were approximately $285,900 for fiscal 2004
versus $258,000 for the corresponding period of the prior year, an increase of 10.8%. This
increase was primarily due to the increase in the Canadian exchange rate and higher comparable
store sales.


                                                          22
The Great Atlantic & Pacific Tea Company, Inc.
                Management’s Discussion and Analysis – Continued

GROSS MARGIN

        The following table presents gross margin dollar results and gross margin as a percentage of
sales by operating segment for fiscal 2004 as compared to fiscal 2003. Gross margin as a
percentage of sales decreased 17 basis points to 28.02% for fiscal 2004 from 28.19% for fiscal
2003. This 17 basis point decrease was caused by the increase in Canadian sales (which has a
lower gross margin rate than the U.S. business) as a percentage of our total (approximately 10
basis points) and from the increase in U.S. Food Basics (which has the lowest gross margin rate of
all our banners) as a percentage of sales (approximately 7 basis points). We believe the impact on
margin for changes in costs and special reductions was not significant.
                                   Fiscal 2004                              Fiscal 2003

                        Gross Margin        Rate to Sales%      Gross Margin         Rate to Sales%

United States           $ 2,177.9                    29.76%      $ 2,256.1                      29.96%
Canada                      863.2                    24.40           816.0                      24.23
      Total             $ 3,041.1                    28.02%      $ 3,072.1                      28.19%


        The following table details the dollar impact of several items affecting the gross margin
dollar increase (decrease) from fiscal 2003 to fiscal 2004:

                       Sales Volume         Gross Margin Rate   Exchange Rate                 Total

                                                                          −
United States           $    (63.9)              $    (14.3)     $                        $    (78.2)
Canada                        (8.8)                     5.4            50.6                     47.2
Total                   $    (72.7)              $     (8.9)     $     50.6               $    (31.0)


STORE OPERATING, GENERAL AND ADMINISTRATIVE EXPENSE

        The following table presents SG&A by operating segment, in dollars and as a percentage
of sales for fiscal 2004 compared to fiscal 2003. SG&A expense was $3,114.1 million or 28.69%
for fiscal 2004 as compared to $3,214.9 million or 29.50% for fiscal 2003.
                                   Fiscal 2004                              Fiscal 2003
                            SG&A             Rate to Sales%          SG&A             Rate to Sales%

United States           $ 2,307.2                    31.53%      $ 2,464.0                      32.72%
Canada                      806.9                    22.81           750.9                      22.29
      Total             $ 3,114.1                    28.69%      $ 3,214.9                      29.50%

        The U.S. had overall favorability of 119 basis points. Part of the improvement in the U.S. is
due to gains on the sale of certain of our assets of $29.3 million, the absence of the Midwest
goodwill impairment charge of $27.0 million and a reduction in the vacation accrual of $8.6 million
due to a change in the vacation entitlement practice. Prior to the change in the vacation operating
policy, non-union employees were fully vested on the first day of the calendar year. As such
under SFAS No. 43, “Compensated Absences”, our Company accrued vacation as it was earned
by non-union employees (earned in the calendar year immediately preceeding the January 1
vesting date). Under the new vacation operating policy, non-union employees vest over the year
                                                      23
The Great Atlantic & Pacific Tea Company, Inc.
                   Management’s Discussion and Analysis – Continued

that vacation is earned, and accordingly, our Company recorded a one-time adjustment to reduce
the liability. Most of the favorability in the U.S. is due to very tight cost controls. Categories in
which the U.S. experienced cost reductions include advertising due to less spend ($26.4 million)
and labor ($36.2 million). The favorability in the U.S. was partially offset by $8.9 million of
severance and other charges relating to the previously noted administrative reorganization and a
$27.2 million increase in our workers’ compensation and general liability reserves in response to
both adverse development of prior year’s costs and other developments including a continuing
trend of rising costs.

       The increase in SG&A in Canada of $56.0 million is primarily due to the increase in the
Canadian exchange rate of $35.3 million, an increase in labor of $28.5 million due mainly to
increased sales, and an increase in occupancy of $17.9 million as a result of the opening of new
stores partially offset by a decrease in advertising costs of $13.1 million due to less spend.

      During fiscal 2004 and fiscal 2003, we recorded property impairment losses in SG&A in our
Consolidated Statements of Operations of $44.1 million and $43.8 million as follows:

                                           Fiscal 2004                           Fiscal 2003
                                  U.S.       Canada        Total        U.S.       Canada       Total
Impairments due to
  closure or conversion
  in the normal course
  of business (1) (2)            $ 6,000     $   709     $ 6,709      $ 4,439     $ 1,670      $ 6,109
Impairments due to
  unrecoverable assets (2)                          −                                    −
                                  34,688                   34,688      33,102                   33,102
Impairments related to
  the 2001 Asset
  Disposition (2) (3)                               −                                    −
                                   2,659                    2,659         422                      422
Impairments related to
  the Farmer Jack
  restructuring (2) (3)                            −                                    −
                                      90                      90        4,129                    4,129
Total impairments                $43,437     $   709     $44,146      $42,092     $ 1,670      $43,762

     (1) Consists primarily of amounts that were impaired as a result of stores that were or will be closed, converted
        or remodeled in the normal course of business.
     (2) Refer to Note 6 – Valuation of Goodwill and Long-Lived Assets.
     (3) Refer to Note 8 – Asset Disposition Initiatives.

      The effects of changes in estimates of useful lives were not material to ongoing
depreciation expense.


INTEREST EXPENSE

        Interest expense of $114.1 million for fiscal 2004 increased from the prior year amount of
$103.1 million due primarily to higher interest expense resulting from our on-balance sheet long-
term real estate liabilities, which includes sale leaseback of Company-owned properties entered
into in the fourth quarter of fiscal 2003 of approximately $15.6 million and sale leaseback of
locations for which we received landlord allowances of $3.6 million. This impact was partially
offset by lower interest from lower borrowings of approximately $6.5 million.

                                                          24
The Great Atlantic & Pacific Tea Company, Inc.
                 Management’s Discussion and Analysis – Continued


INCOME TAXES

        The provision for income taxes from continuing operations for fiscal 2004 was $0.5 million (a
$4.5 million provision for our U.S. operations and a $4.0 million benefit from our Canadian
operations) compared to a $30.6 million benefit from income taxes from continuing operations for
fiscal 2003 (a $42.3 million benefit from our U.S. operations and a $11.7 million provision for our
Canadian operations). Our U.S. tax benefit from continuing operations for fiscal 2003 was offset by
a tax provision provided on discontinued operations of $46.6 million in accordance with Statement
of Financial Accounting Standards 109, “Accounting for Income Taxes”. Consistent with prior year,
we continue to record a valuation allowance in an amount that would reduce our U.S. deferred tax
asset to the amount that is more likely than not to be realized.

        For fiscal 2004, our effective income tax rate of 0.3% changed from the effective income tax
rate of (12.5%) for fiscal 2003 as follows:

                                     Fiscal 2004                     Fiscal 2003

                             Tax (Provision)   Effective     Tax Benefit    Effective
                                Benefit        Tax Rate      (Provision)    Tax Rate
United States                $    (4,500)          2.5%    $     42,339       (17.3%)
Canada                             3,972          (2.2%)        (11,765)        4.8%
                             $      (528)          0.3%    $     30,574       (12.5%)

        The change in our effective tax rate was primarily due to the absence of a tax benefit
recorded on losses from continuing operations that was limited to the tax provision recorded on
income from discontinued operations in accordance with SFAS 109. As discussed above, $46.6
million of benefit was recognized for fiscal 2003 as compared to fiscal 2004, where no benefit was
recognized. The remaining provisions recorded in the U.S. of $4.5 million and $4.3 million for fiscal
2004 and fiscal 2003, respectively, represent state and local taxes. In addition, the change in our
effective tax rate was partially offset by the impact of the lower mix of Canadian income from
continuing operations as a percentage of our Company’s loss from continuing operations for fiscal
2004 as compared to fiscal 2003. Information regarding items included in the reconciliation of the
effective rate with the federal statutory rate is disclosed in Note 12 to the consolidated financial
statements.


DISCONTINUED OPERATIONS

        Beginning in the fourth quarter of fiscal year 2002 and in the early part of the first quarter of
fiscal 2003, we decided to sell our operations located in Northern New England and Wisconsin, as
well as our Eight O’Clock Coffee business. These asset sales are now complete.


                                                    25
The Great Atlantic & Pacific Tea Company, Inc.
                  Management’s Discussion and Analysis – Continued

        The loss from operations of discontinued businesses, net of tax, for fiscal 2004 was $1.4
million as compared to a loss from operations of discontinued businesses, net of tax, of $32.7
million for fiscal 2003 and is detailed by business as follows:

                                                        Fiscal 2004
                                                                   Eight
                                   Northern                       O’Clock
                                 New England       Kohl’s         Coffee         Total
Income (loss) from operations of
    discontinued businesses
                                           −             −              −              −
Sales                            $             $               $             $
Operating expenses                      292           (981)          (698)        (1,387)
Income (loss) from operations of
  discontinued businesses, before
  tax                                   292           (981)          (698)        (1,387)
                                           −             −              −              −
Tax provision
Income (loss) from operations of
  discontinued businesses, net of
  tax                            $      292    $      (981)    $     (698)   $    (1,387)

Disposal related costs included in operating expenses above:
                                                          −             −
Severance and benefits           $       (326) $               $             $      (326)
Reversal of previously accrued
                                             −                          −
  occupancy related costs                               354                          354
Non-accruable closing costs                626         (595)         (698)          (667)
Interest accretion on present value
                                                                        −
  of future occupancy costs                 (8)        (740)                        (748)
Total disposal related costs     $        292    $     (981)   $     (698)   $    (1,387)


                                                        26
The Great Atlantic & Pacific Tea Company, Inc.
                   Management’s Discussion and Analysis – Continued

                                                         Fiscal 2003
                                                                    Eight
                                  Northern                         O’Clock
                                New England         Kohl’s         Coffee           Total
(Loss) income from operations of
    discontinued businesses
Sales                           $   32,726      $    123,229    $    65,265    $    221,220
Operating expenses                 (42,536)         (174,890)       (60,179)       (277,605)
(Loss) income from operations of
  discontinued businesses, before
  tax                               (9,810)          (51,661)         5,086         (56,385)
Tax benefit (provision)              4,120            21,698         (2,136)         23,682
(Loss) income from operations of
  discontinued businesses, net of
  tax                           $   (5,690)     $    (29,963)   $    2,950     $    (32,703)

Disposal related costs included in operating expenses above:
                                            −                             −
Pension withdrawal liability     $               $    (6,500)   $              $     (6,500)
                                                                          −
Occupancy related costs                (3,993)      (28,387)                        (32,380)
Reversal of previously accrued
                                            −                             −
  occupancy related costs                              4,458                          4,458
                                                                          −
Non-accruable inventory costs            (175)        (2,511)                        (2,686)
Non-accruable closing costs           (2,555)         (2,890)       (12,275)        (17,720)
                                                           −              −
Gain on sale of inventory               1,645                                         1,645
                                                                          −
Severance and benefits                (2,670)         (6,562)                        (9,232)
Interest accretion on present value
                                                                          −
  of future occupancy costs                (6)          (353)                          (359)
Total disposal related costs     $     (7,754) $ (42,745)       $   (12,275)   $    (62,774)

      The loss on disposal of discontinued operations, net of tax, was $2.7 million for fiscal 2004
as compared to gain on disposal of discontinued operations, net of tax, of $97.0 million for fiscal
2003 and is detailed by business as follows:

                                                         Fiscal 2004
                                                                    Eight
                                   Northern                        O’Clock
                                 New England        Kohl’s         Coffee           Total
Loss on disposal of discontinued
    businesses
                                           −                              −
Property impairments            $               $       (602)   $              $       (602)
                                           −               −
Loss on sale of business                                             (2,100)         (2,100)
Loss on disposal of discontinued
                                           −
  businesses, before tax                                (602)        (2,100)         (2,702)
                                           −               −              −               −
Tax provision
Loss on disposal of discontinued
                                           −
  businesses, net of tax        $               $       (602)   $    (2,100)   $     (2,702)


                                                         27
The Great Atlantic & Pacific Tea Company, Inc.
                 Management’s Discussion and Analysis – Continued

                                                   Fiscal 2003
                                                                Eight
                               Northern                        O’Clock
                             New England        Kohl’s         Coffee           Total
Gain (loss) on disposal of
      discontinued businesses
Gain on sale of fixed assets $   85,983     $    15,272    $     85,000     $   186,255
                                      −                               −
Fixed asset impairments                         (18,968)                        (18,968)
Gain (loss) on disposal of
  discontinued businesses,
  before tax                      85,983         (3,696)          85,000        167,287
Tax (provision) benefit          (36,113)         1,552          (35,700)       (70,261)
Gain (loss) on disposal of
  discontinued businesses,
  net of tax                 $   49,870     $    (2,144)   $     49,300     $    97,026


ASSET DISPOSITION INITIATIVES

Overview
        In fiscal 1998 and fiscal 1999, we announced a plan to close two warehouse facilities and a
coffee plant in the U.S., a bakery plant in Canada and 166 stores including the exit of the
Richmond, Virginia and Atlanta, Georgia markets (Project Great Renewal). In addition, during
fiscal 2001, we announced that certain underperforming operations, including 39 stores (30 in the
United States and 9 in Canada) and 3 warehouses (2 in the United States and 1 in Canada) would
be closed and/or sold, and certain administrative streamlining would take place (2001 Asset
Disposition). During fiscal 2003, we announced an initiative to close 6 stores and convert 13
stores to our Food Basics banner in the Detroit, Michigan and Toledo, Ohio markets (Farmer Jack
Restructuring). In addition, through the first three quarters of fiscal 2005, we closed 35 stores in
the Midwest (Closure of Stores in the Midwest).

        Presented below is a reconciliation of the activities recorded on our Consolidated Balance
Sheets, Consolidated Statements of Operations and Consolidated Statements of Cash Flows for
fiscal 2005, fiscal 2004, and fiscal 2003. Present value (“PV”) interest represents interest
accretion on future occupancy costs which were recorded at present value at the time of the
original charge. Non-accruable items represent charges related to the restructuring that are
required to be expensed as incurred in accordance with SFAS 146 “Accounting for Costs
Associated with Exit or Disposal Activities”.


                                                    28
The Great Atlantic & Pacific Tea Company, Inc.
                    Management’s Discussion and Analysis – Continued
                                                      Fiscal 2005
                         Project           2001         Farmer      Closure of
                         Great             Asset         Jack        Stores in
                        Renewal         Disposition   Restructuring the Midwest         Total
Balance Sheet accruals
Vacancy                   $   (3,648) $     (2,089)   $     4,376    $ 97,596       $    96,235
PV interest                    1,548          2,170           710       1,582             6,010
                                   −              −             −
Severance                                                               2,666             2,666
Total accrued to
   balance sheets             (2,100)            81         5,086        101,844        104,911
Non-accruable items
   recorded on Statements
   of Operations
                                   −              −             −
Capital lease termination                                                  (588)           (588)
                                   −              −             −
Property writeoffs                                                         6,873           6,873
                                   −              −             −
Inventory related costs                                                    1,242           1,242
                                   −              −             −
Loss on sale of property                                                   1,640           1,640
Gain on sale of pharmacy
                                   −              −             −
   scripts                                                                 (870)          (870)
                                   −              −             −
Closing costs                                                              5,131          5,131
                                   −              −             −
Total non-accruable items                                                 13,428         13,428
      Less PV interest        (1,548)       (2,170)          (710)        (1,582)        (6,010)
Total amount recorded
   on Statements of
   Operations excluding
   PV interest                (3,648)       (2,089)         4,376        113,690        112,329
      Less Gain on sale
        of pharmacy
                                   −              −             −
        scripts                                                            870             870
                                   −              −             −
      Less closing costs                                                 (5,131)         (5,131)
   Total amount recorded
      On Statements of
      Cash Flows          $   (3,648) $     (2,089)   $     4,376    $ 109,429      $   108,068


                                               Fiscal 2004
                         Project           2001          Farmer
                         Great             Asset          Jack
                        Renewal         Disposition Restructuring        Total
Balance Sheet accruals
PV interest            $      1,922     $     2,456   $       687    $     5,065
Total accrued to
  balance sheets              1,922           2,456           687          5,065
                                  −                             −
Occupancy reversals                         (4,488)                      (4,488)
Adjustments to
                                   −                            −
  balance sheets                            (4,488)                      (4,488)

Non-accruable items
   recorded on Statements
   of Operations
                                −
Property writeoffs                            2,659            90          2,749
                                −                 −
Inventory related costs                                       291            291
                                −                 −
Closing costs                                                 689            689
                                −
Total non-accruable items                     2,659         1,070          3,729
      Less PV interest     (1,922)          (2,456)          (687)        (5,065)
Total amount recorded
   on Statements of
   Operations
                                −
   excluding PV interest                    (1,829)         1,070          (759)
                                −                 −
      Less closing costs                                    (689)          (689)
   Total amount recorded
      On Statements of
                                −$
      Cash Flows         $                  (1,829)   $       381    $ (1,448)


                                                                     29
The Great Atlantic & Pacific Tea Company, Inc.
                    Management’s Discussion and Analysis – Continued
                                           Fiscal 2003
                         Project       2001          Farmer
                         Great         Asset          Jack
                        Renewal     Disposition Restructuring       Total
 Balance Sheet accruals
 PV interest            $   2,638   $    2,850    $       56    $    5,544
                                −            −
 Occupancy                                            20,999        20,999
                                −            −
 Severance                                             8,930         8,930
 Total accrued to
   balance sheets           2,638         2,850       29,985        35,473
                                −                          −
 Occupancy reversals                    (6,778)                     (6,778)
 Additional occupancy
                               −                           −
   accrual                                 991                         991
                               −                           −
 Additional severance                    1,613                       1,613
 Adjustments to
                               −                           −
   balance sheets                       (4,174)                     (4,174)

 Non-accruable items
    recorded on Statements
    of Operations
                                 −
 Property writeoffs                         422        4,129          4,551
                                 −            −
 Inventory related costs                               2,244          2,244
                                 −
 Closing costs                               44        1,449          1,493
                                 −
 Total non-accruable items                  466        7,822          8,288
       Less PV interest     (2,638)     (2,850)          (56)        (5,544)
 Total amount recorded
    on Statements of
    Operations
                                 −
    excluding PV interes t              (3,708)       37,751        34,043
                                 −
       Less closing costs                  (44)       (1,449)       (1,493)
    Total amount recorded
       On Statements of
                                 −$
       Cash Flows         $             (3,752)   $   36,302    $ 32,550


Project Great Renewal
        In May 1998, we initiated an assessment of our business operations in order to identify the
factors that were impacting our performance. As a result of this assessment, in fiscal 1998 and
1999, we announced a plan to close two warehouse facilities and a coffee plant in the U.S., a
bakery plant in Canada and 166 stores (156 in the United States and 10 in Canada) including the
exit of the Richmond, Virginia and Atlanta, Georgia markets. As of February 25, 2006, we had
closed all stores and facilities related to this phase of the initiative.


                                                                30
The Great Atlantic & Pacific Tea Company, Inc.
                     Management’s Discussion and Analysis – Continued

        The following table summarizes the activity related to this phase of the initiative over the
last three fiscal years:
                                     Occupancy                    Severance and Benefits                    Total
                            U.S.      Canada       Total        U.S.     Canada       Total       U.S.     Canada      Total
   Balance at
                                                                                −
      February 22, 2003   $ 48,788 $      487 $ 49,275 $         2,446 $            $   2,446 $ 51,234 $        487 $ 51,721
             (1)
                                                                     −          −           −
   Addition                   2,276       372     2,648                                           2,276         372     2,648
                (2)
                                                                                −
   Utilization              (19,592)     (407)  (19,999)          (289)                  (289)  (19,881)       (407)  (20,288)
   Balance at
                                                                                −
      February 28, 2004   $ 31,472 $      452 $ 31,924 $         2,157 $            $   2,157 $ 33,629 $        452 $ 34,081
             (1)
                                                                     −          −           −
   Addition                  1,902         20    1,922                                           1,902           20    1,922
                (2)
                                                                                −
   Utilization              (5,410)      (222)  (5,632)           (497)                  (497)  (5,907)        (222)  (6,129)
   Balance at
                                                                                −
      February 26, 2005   $ 27,964 $      250 $ 28,214 $         1,660 $            $   1,660 $ 29,624 $        250 $ 29,874
             (1)
                                                                     −          −           −
   Addition                  1,541          7    1,548                                           1,541            7    1,548
                (2)
                                                                                −
   Utilization              (5,858)      (167)  (6,025)           (223)                  (223)  (6,081)        (167)  (6,248)
                    (3)
                                                                     −          −           −
   Adjustments              (3,648)       (90)  (3,738)                                         (3,648)         (90)  (3,738)
   Balance at
                                            −                                   −                                −
      February 25, 2006   $ 19,999   $           $ 19,999   $    1,437   $          $   1,437   $ 21,436   $         $ 21,436

   (1) The additions to store occupancy of $2.6 million, $1.9 million, and $1.5 million during fiscal 2003, 2004 and
       2005, respectively, represent the interest accretion on future occupancy costs which were recorded at
       present value at the time of the original charge.
   (2) Occupancy utilization of $20.0 million, $5.6 million, and $6.0 million for fiscal 2003, 2004 and 2005,
       respectively, represents payments made during those periods for costs such as rent, common area
       maintenance, real estate taxes and lease termination costs. Severance utilization of $0.3 million, $0.5
       million, and $0.2 million for fiscal 2003, 2004 and 2005, respectively, represents payments to individuals for
       severance and benefits, as well as payments to pension funds for early withdrawal from multi-employer union
       pension plans.
   (3) At each balance sheet date, we assess the adequacy of the balance to determine if any adjustments are
       required as a result of changes in circumstances and/or estimates. We have continued to make favorable
       progress in marketing and subleasing the closed stores. As a result, during fiscal 2005, we recorded an
       additional reduction of $3.6 million in occupancy accruals due to subleasing additional closed stores and
       converting a previously closed store to a store that will open in fiscal 2006. As discussed in Note 2 –
       Divestiture of Our Business in Canada and Stores in the Midwest, we sold our Canadian business and as a
       result, the Canadian occupancy accruals of $0.1 million are no longer consolidated in our Consolidated
       Balance Sheet at February 25, 2006.

         We paid $104.4 million of the total occupancy charges from the time of the original charges
through February 25, 2006 which was primarily for occupancy related costs such as rent, common
area maintenance, real estate taxes and lease termination costs. We paid $30.1 million of the total
net severance charges from the time of the original charges through February 25, 2006, which
resulted from the termination of approximately 3,400 employees. The remaining occupancy
liability of $20.0 million relates to expected future payments under long term leases and is
expected to be paid in full by 2020. The remaining severance liability of $1.4 million primarily
relates to expected future payments for early withdrawals from multi-employer union pension
plans and will be fully paid out in 2020.

       None of these stores were open during fiscal 2003, fiscal 2004 or fiscal 2005. As such,
there was no impact from store operations on the Statements of Consolidated Operations from
the 166 stores included in this phase of the initiative.

       At February 25, 2006 and February 26, 2005, approximately $5.1 million and $5.4 million,
respectively, of the reserve was included in “Other accruals” and the remaining amount was
included in “Other non-current liabilities” on the Company’s Consolidated Balance Sheets.


                                                                  31
great atlantic & pacific tea  Annual_Report_2005

More Related Content

What's hot

Denn investor presentation november & december
Denn investor presentation  november & decemberDenn investor presentation  november & december
Denn investor presentation november & decemberDenny2015ir
 
safeway 2006 Annual Report
safeway 2006 Annual Reportsafeway 2006 Annual Report
safeway 2006 Annual Reportfinance6
 
Target Annual Report 2005
Target Annual Report 2005Target Annual Report 2005
Target Annual Report 2005finance4
 
supervalu Proxy Statements Corporate Profile
supervalu Proxy Statements Corporate Profilesupervalu Proxy Statements Corporate Profile
supervalu Proxy Statements Corporate Profilefinance7
 
Denn investor presentation may & june 2018 final
Denn investor presentation  may & june 2018 finalDenn investor presentation  may & june 2018 final
Denn investor presentation may & june 2018 finalDenny2015ir
 
Bruce Fischer Resume 2015
Bruce Fischer Resume 2015       Bruce Fischer Resume 2015
Bruce Fischer Resume 2015 Bruce Fischer
 
Denn investor presentation bof a conference 03 15-16
Denn investor presentation bof a conference 03 15-16Denn investor presentation bof a conference 03 15-16
Denn investor presentation bof a conference 03 15-16Denny2015ir
 
bn annual2005
bn annual2005bn annual2005
bn annual2005finance38
 
Kingfisher annual report 2012
Kingfisher annual report 2012Kingfisher annual report 2012
Kingfisher annual report 2012Humberto Galasso
 
Q3 2015 Canadian Tire Corporation Earnings Conference Call Presentation
Q3 2015 Canadian Tire Corporation Earnings Conference Call PresentationQ3 2015 Canadian Tire Corporation Earnings Conference Call Presentation
Q3 2015 Canadian Tire Corporation Earnings Conference Call PresentationInvestorCanadianTire
 
Denn investor presentation february & march 2018 final
Denn investor presentation  february & march 2018   finalDenn investor presentation  february & march 2018   final
Denn investor presentation february & march 2018 finalDenny2015ir
 
campbell soup annual reports 2005
campbell soup annual reports 2005campbell soup annual reports 2005
campbell soup annual reports 2005finance29
 
Draft september 2017 investor deck
Draft september 2017 investor deckDraft september 2017 investor deck
Draft september 2017 investor deckchicosfasinvestor
 
campbell soup annual reports 2004
campbell soup annual reports 2004campbell soup annual reports 2004
campbell soup annual reports 2004finance29
 
Evine investor presentation september 2017 final
Evine investor presentation september 2017 finalEvine investor presentation september 2017 final
Evine investor presentation september 2017 finalevine2015
 
ameriprise TalkingPoints_1Q07_2
ameriprise TalkingPoints_1Q07_2ameriprise TalkingPoints_1Q07_2
ameriprise TalkingPoints_1Q07_2finance43
 

What's hot (19)

Denn investor presentation november & december
Denn investor presentation  november & decemberDenn investor presentation  november & december
Denn investor presentation november & december
 
safeway 2006 Annual Report
safeway 2006 Annual Reportsafeway 2006 Annual Report
safeway 2006 Annual Report
 
Target Annual Report 2005
Target Annual Report 2005Target Annual Report 2005
Target Annual Report 2005
 
supervalu Proxy Statements Corporate Profile
supervalu Proxy Statements Corporate Profilesupervalu Proxy Statements Corporate Profile
supervalu Proxy Statements Corporate Profile
 
Coast13 q1
Coast13 q1Coast13 q1
Coast13 q1
 
Denn investor presentation may & june 2018 final
Denn investor presentation  may & june 2018 finalDenn investor presentation  may & june 2018 final
Denn investor presentation may & june 2018 final
 
Bruce Fischer Resume 2015
Bruce Fischer Resume 2015       Bruce Fischer Resume 2015
Bruce Fischer Resume 2015
 
Annual Report Analysis Project
Annual Report Analysis ProjectAnnual Report Analysis Project
Annual Report Analysis Project
 
Denn investor presentation bof a conference 03 15-16
Denn investor presentation bof a conference 03 15-16Denn investor presentation bof a conference 03 15-16
Denn investor presentation bof a conference 03 15-16
 
bn annual2005
bn annual2005bn annual2005
bn annual2005
 
Kingfisher annual report 2012
Kingfisher annual report 2012Kingfisher annual report 2012
Kingfisher annual report 2012
 
Q3 2015 Canadian Tire Corporation Earnings Conference Call Presentation
Q3 2015 Canadian Tire Corporation Earnings Conference Call PresentationQ3 2015 Canadian Tire Corporation Earnings Conference Call Presentation
Q3 2015 Canadian Tire Corporation Earnings Conference Call Presentation
 
Denn investor presentation february & march 2018 final
Denn investor presentation  february & march 2018   finalDenn investor presentation  february & march 2018   final
Denn investor presentation february & march 2018 final
 
Earnings Release Report 3Q11
Earnings Release Report 3Q11Earnings Release Report 3Q11
Earnings Release Report 3Q11
 
campbell soup annual reports 2005
campbell soup annual reports 2005campbell soup annual reports 2005
campbell soup annual reports 2005
 
Draft september 2017 investor deck
Draft september 2017 investor deckDraft september 2017 investor deck
Draft september 2017 investor deck
 
campbell soup annual reports 2004
campbell soup annual reports 2004campbell soup annual reports 2004
campbell soup annual reports 2004
 
Evine investor presentation september 2017 final
Evine investor presentation september 2017 finalEvine investor presentation september 2017 final
Evine investor presentation september 2017 final
 
ameriprise TalkingPoints_1Q07_2
ameriprise TalkingPoints_1Q07_2ameriprise TalkingPoints_1Q07_2
ameriprise TalkingPoints_1Q07_2
 

Viewers also liked

owens & minor audit
owens & minor auditowens & minor audit
owens & minor auditfinance33
 
meadwestvaco 05/08Goldman_Presentation
 meadwestvaco 05/08Goldman_Presentation meadwestvaco 05/08Goldman_Presentation
meadwestvaco 05/08Goldman_Presentationfinance33
 
SNIA Emerald Introduction
SNIA Emerald IntroductionSNIA Emerald Introduction
SNIA Emerald Introductiondlarusso15
 
2008 OwensMinorOutlook
2008 OwensMinorOutlook2008 OwensMinorOutlook
2008 OwensMinorOutlookfinance33
 
meadwestvaco 09/08UBS_Pres
 meadwestvaco 09/08UBS_Pres meadwestvaco 09/08UBS_Pres
meadwestvaco 09/08UBS_Presfinance33
 
owens & minor 5FCF55D7-CA78-4EF3-9FDC-D3FD172BAD72_2009_Proxy_Statement
owens & minor  5FCF55D7-CA78-4EF3-9FDC-D3FD172BAD72_2009_Proxy_Statementowens & minor  5FCF55D7-CA78-4EF3-9FDC-D3FD172BAD72_2009_Proxy_Statement
owens & minor 5FCF55D7-CA78-4EF3-9FDC-D3FD172BAD72_2009_Proxy_Statementfinance33
 
meadwestvaco 3Q07EarningsSlidesvFINAL102307
 meadwestvaco 3Q07EarningsSlidesvFINAL102307 meadwestvaco 3Q07EarningsSlidesvFINAL102307
meadwestvaco 3Q07EarningsSlidesvFINAL102307finance33
 

Viewers also liked (7)

owens & minor audit
owens & minor auditowens & minor audit
owens & minor audit
 
meadwestvaco 05/08Goldman_Presentation
 meadwestvaco 05/08Goldman_Presentation meadwestvaco 05/08Goldman_Presentation
meadwestvaco 05/08Goldman_Presentation
 
SNIA Emerald Introduction
SNIA Emerald IntroductionSNIA Emerald Introduction
SNIA Emerald Introduction
 
2008 OwensMinorOutlook
2008 OwensMinorOutlook2008 OwensMinorOutlook
2008 OwensMinorOutlook
 
meadwestvaco 09/08UBS_Pres
 meadwestvaco 09/08UBS_Pres meadwestvaco 09/08UBS_Pres
meadwestvaco 09/08UBS_Pres
 
owens & minor 5FCF55D7-CA78-4EF3-9FDC-D3FD172BAD72_2009_Proxy_Statement
owens & minor  5FCF55D7-CA78-4EF3-9FDC-D3FD172BAD72_2009_Proxy_Statementowens & minor  5FCF55D7-CA78-4EF3-9FDC-D3FD172BAD72_2009_Proxy_Statement
owens & minor 5FCF55D7-CA78-4EF3-9FDC-D3FD172BAD72_2009_Proxy_Statement
 
meadwestvaco 3Q07EarningsSlidesvFINAL102307
 meadwestvaco 3Q07EarningsSlidesvFINAL102307 meadwestvaco 3Q07EarningsSlidesvFINAL102307
meadwestvaco 3Q07EarningsSlidesvFINAL102307
 

Similar to great atlantic & pacific tea Annual_Report_2005

great atlantic & pacific tea Annual_Report_2004
great atlantic & pacific tea  Annual_Report_2004great atlantic & pacific tea  Annual_Report_2004
great atlantic & pacific tea Annual_Report_2004finance33
 
ameriprise TalkingPoints_3Q06
ameriprise TalkingPoints_3Q06ameriprise TalkingPoints_3Q06
ameriprise TalkingPoints_3Q06finance43
 
ameriprise TalkingPoints_2Q06
ameriprise TalkingPoints_2Q06ameriprise TalkingPoints_2Q06
ameriprise TalkingPoints_2Q06finance43
 
home depot 2007 Annual Report
home depot 2007 Annual Reporthome depot 2007 Annual Report
home depot 2007 Annual Reportfinance2
 
Second cup 2013_annual_report
Second cup 2013_annual_reportSecond cup 2013_annual_report
Second cup 2013_annual_reportBalajick
 
TalkingPoints_4Q06_2
TalkingPoints_4Q06_2TalkingPoints_4Q06_2
TalkingPoints_4Q06_2finance43
 
whole food market ar08
whole food market ar08whole food market ar08
whole food market ar08finance44
 
ameriprise 1Q08%20AMP_TalkingPoints
ameriprise 1Q08%20AMP_TalkingPointsameriprise 1Q08%20AMP_TalkingPoints
ameriprise 1Q08%20AMP_TalkingPointsfinance43
 
GAP annual reports 2006
GAP annual reports 2006GAP annual reports 2006
GAP annual reports 2006finance17
 
metlife 2007 Annual Report
metlife 2007 Annual Reportmetlife 2007 Annual Report
metlife 2007 Annual Reportfinance5
 
united stationers 4_2USTRAR2006
united stationers 4_2USTRAR2006united stationers 4_2USTRAR2006
united stationers 4_2USTRAR2006finance50
 
united stationers 4_2USTRAR2006
united stationers 4_2USTRAR2006united stationers 4_2USTRAR2006
united stationers 4_2USTRAR2006finance50
 
Coca cola (annual report 2019)
Coca cola (annual report 2019)Coca cola (annual report 2019)
Coca cola (annual report 2019)Muhammad Badar
 
southern 2002 Questions & Answers
southern 2002 Questions & Answerssouthern 2002 Questions & Answers
southern 2002 Questions & Answersfinance17
 
Winn-DixieStoresIncInvestorDay
Winn-DixieStoresIncInvestorDayWinn-DixieStoresIncInvestorDay
Winn-DixieStoresIncInvestorDayfinance32
 
Winn-DixieStoresIncInvestorDay
Winn-DixieStoresIncInvestorDayWinn-DixieStoresIncInvestorDay
Winn-DixieStoresIncInvestorDayfinance32
 
supervalu annual report 2004
supervalu annual report 2004supervalu annual report 2004
supervalu annual report 2004finance7
 
supervalu annual report 2008
supervalu annual report 2008supervalu annual report 2008
supervalu annual report 2008finance7
 
CO2 Presentation - The Largest Profit Levers
CO2 Presentation - The Largest Profit LeversCO2 Presentation - The Largest Profit Levers
CO2 Presentation - The Largest Profit LeversCoalmarch
 

Similar to great atlantic & pacific tea Annual_Report_2005 (20)

great atlantic & pacific tea Annual_Report_2004
great atlantic & pacific tea  Annual_Report_2004great atlantic & pacific tea  Annual_Report_2004
great atlantic & pacific tea Annual_Report_2004
 
ameriprise TalkingPoints_3Q06
ameriprise TalkingPoints_3Q06ameriprise TalkingPoints_3Q06
ameriprise TalkingPoints_3Q06
 
ameriprise TalkingPoints_2Q06
ameriprise TalkingPoints_2Q06ameriprise TalkingPoints_2Q06
ameriprise TalkingPoints_2Q06
 
home depot 2007 Annual Report
home depot 2007 Annual Reporthome depot 2007 Annual Report
home depot 2007 Annual Report
 
Second cup 2013_annual_report
Second cup 2013_annual_reportSecond cup 2013_annual_report
Second cup 2013_annual_report
 
TalkingPoints_4Q06_2
TalkingPoints_4Q06_2TalkingPoints_4Q06_2
TalkingPoints_4Q06_2
 
whole food market ar08
whole food market ar08whole food market ar08
whole food market ar08
 
ameriprise 1Q08%20AMP_TalkingPoints
ameriprise 1Q08%20AMP_TalkingPointsameriprise 1Q08%20AMP_TalkingPoints
ameriprise 1Q08%20AMP_TalkingPoints
 
GAP annual reports 2006
GAP annual reports 2006GAP annual reports 2006
GAP annual reports 2006
 
metlife 2007 Annual Report
metlife 2007 Annual Reportmetlife 2007 Annual Report
metlife 2007 Annual Report
 
united stationers 4_2USTRAR2006
united stationers 4_2USTRAR2006united stationers 4_2USTRAR2006
united stationers 4_2USTRAR2006
 
united stationers 4_2USTRAR2006
united stationers 4_2USTRAR2006united stationers 4_2USTRAR2006
united stationers 4_2USTRAR2006
 
Coca cola (annual report 2019)
Coca cola (annual report 2019)Coca cola (annual report 2019)
Coca cola (annual report 2019)
 
southern 2002 Questions & Answers
southern 2002 Questions & Answerssouthern 2002 Questions & Answers
southern 2002 Questions & Answers
 
Winn-DixieStoresIncInvestorDay
Winn-DixieStoresIncInvestorDayWinn-DixieStoresIncInvestorDay
Winn-DixieStoresIncInvestorDay
 
Winn-DixieStoresIncInvestorDay
Winn-DixieStoresIncInvestorDayWinn-DixieStoresIncInvestorDay
Winn-DixieStoresIncInvestorDay
 
Parker Hannifin 2015 Annual Report
Parker Hannifin 2015 Annual ReportParker Hannifin 2015 Annual Report
Parker Hannifin 2015 Annual Report
 
supervalu annual report 2004
supervalu annual report 2004supervalu annual report 2004
supervalu annual report 2004
 
supervalu annual report 2008
supervalu annual report 2008supervalu annual report 2008
supervalu annual report 2008
 
CO2 Presentation - The Largest Profit Levers
CO2 Presentation - The Largest Profit LeversCO2 Presentation - The Largest Profit Levers
CO2 Presentation - The Largest Profit Levers
 

More from finance33

mcgraw-hill ar2006
mcgraw-hill ar2006mcgraw-hill ar2006
mcgraw-hill ar2006finance33
 
mcgraw-hill ar_2007
mcgraw-hill ar_2007mcgraw-hill ar_2007
mcgraw-hill ar_2007finance33
 
mcgraw-hill ar2008
mcgraw-hill ar2008mcgraw-hill ar2008
mcgraw-hill ar2008finance33
 
owens & minor bylaws2
owens & minor bylaws2owens & minor bylaws2
owens & minor bylaws2finance33
 
owens & minor bylaws2
owens & minor bylaws2owens & minor bylaws2
owens & minor bylaws2finance33
 
owens & minor codeofhonor1
owens & minor codeofhonor1owens & minor codeofhonor1
owens & minor codeofhonor1finance33
 
owens & minor codeofhonor1
owens & minor codeofhonor1owens & minor codeofhonor1
owens & minor codeofhonor1finance33
 
owens & minor guidelines
owens & minor guidelinesowens & minor guidelines
owens & minor guidelinesfinance33
 
owens & minor guidelines
owens & minor guidelinesowens & minor guidelines
owens & minor guidelinesfinance33
 
owens & minor audit
owens & minor auditowens & minor audit
owens & minor auditfinance33
 
owens & minor GOVERNANCE
owens & minor GOVERNANCEowens & minor GOVERNANCE
owens & minor GOVERNANCEfinance33
 
owens & minor GOVERNANCE
owens & minor GOVERNANCEowens & minor GOVERNANCE
owens & minor GOVERNANCEfinance33
 
owens & minor compcommittee
owens & minor compcommitteeowens & minor compcommittee
owens & minor compcommitteefinance33
 
owens & minor compcommittee
owens & minor compcommitteeowens & minor compcommittee
owens & minor compcommitteefinance33
 
Owens_Minor1Q07_EarningsReleaseSlidesvfinal
Owens_Minor1Q07_EarningsReleaseSlidesvfinalOwens_Minor1Q07_EarningsReleaseSlidesvfinal
Owens_Minor1Q07_EarningsReleaseSlidesvfinalfinance33
 
Owens_MinorQ307slides
Owens_MinorQ307slidesOwens_MinorQ307slides
Owens_MinorQ307slidesfinance33
 
Owens_MinorAfternoonSession
Owens_MinorAfternoonSessionOwens_MinorAfternoonSession
Owens_MinorAfternoonSessionfinance33
 
Owens_MinorLunchKeynote
Owens_MinorLunchKeynoteOwens_MinorLunchKeynote
Owens_MinorLunchKeynotefinance33
 
Owens_MinorMorningSession
Owens_MinorMorningSessionOwens_MinorMorningSession
Owens_MinorMorningSessionfinance33
 
Owens_slides
Owens_slidesOwens_slides
Owens_slidesfinance33
 

More from finance33 (20)

mcgraw-hill ar2006
mcgraw-hill ar2006mcgraw-hill ar2006
mcgraw-hill ar2006
 
mcgraw-hill ar_2007
mcgraw-hill ar_2007mcgraw-hill ar_2007
mcgraw-hill ar_2007
 
mcgraw-hill ar2008
mcgraw-hill ar2008mcgraw-hill ar2008
mcgraw-hill ar2008
 
owens & minor bylaws2
owens & minor bylaws2owens & minor bylaws2
owens & minor bylaws2
 
owens & minor bylaws2
owens & minor bylaws2owens & minor bylaws2
owens & minor bylaws2
 
owens & minor codeofhonor1
owens & minor codeofhonor1owens & minor codeofhonor1
owens & minor codeofhonor1
 
owens & minor codeofhonor1
owens & minor codeofhonor1owens & minor codeofhonor1
owens & minor codeofhonor1
 
owens & minor guidelines
owens & minor guidelinesowens & minor guidelines
owens & minor guidelines
 
owens & minor guidelines
owens & minor guidelinesowens & minor guidelines
owens & minor guidelines
 
owens & minor audit
owens & minor auditowens & minor audit
owens & minor audit
 
owens & minor GOVERNANCE
owens & minor GOVERNANCEowens & minor GOVERNANCE
owens & minor GOVERNANCE
 
owens & minor GOVERNANCE
owens & minor GOVERNANCEowens & minor GOVERNANCE
owens & minor GOVERNANCE
 
owens & minor compcommittee
owens & minor compcommitteeowens & minor compcommittee
owens & minor compcommittee
 
owens & minor compcommittee
owens & minor compcommitteeowens & minor compcommittee
owens & minor compcommittee
 
Owens_Minor1Q07_EarningsReleaseSlidesvfinal
Owens_Minor1Q07_EarningsReleaseSlidesvfinalOwens_Minor1Q07_EarningsReleaseSlidesvfinal
Owens_Minor1Q07_EarningsReleaseSlidesvfinal
 
Owens_MinorQ307slides
Owens_MinorQ307slidesOwens_MinorQ307slides
Owens_MinorQ307slides
 
Owens_MinorAfternoonSession
Owens_MinorAfternoonSessionOwens_MinorAfternoonSession
Owens_MinorAfternoonSession
 
Owens_MinorLunchKeynote
Owens_MinorLunchKeynoteOwens_MinorLunchKeynote
Owens_MinorLunchKeynote
 
Owens_MinorMorningSession
Owens_MinorMorningSessionOwens_MinorMorningSession
Owens_MinorMorningSession
 
Owens_slides
Owens_slidesOwens_slides
Owens_slides
 

Recently uploaded

Quantitative Analysis of Retail Sector Companies
Quantitative Analysis of Retail Sector CompaniesQuantitative Analysis of Retail Sector Companies
Quantitative Analysis of Retail Sector Companiesprashantbhati354
 
House of Commons ; CDC schemes overview document
House of Commons ; CDC schemes overview documentHouse of Commons ; CDC schemes overview document
House of Commons ; CDC schemes overview documentHenry Tapper
 
Classical Theory of Macroeconomics by Adam Smith
Classical Theory of Macroeconomics by Adam SmithClassical Theory of Macroeconomics by Adam Smith
Classical Theory of Macroeconomics by Adam SmithAdamYassin2
 
AfRESFullPaper22018EmpiricalPerformanceofRealEstateInvestmentTrustsandShareho...
AfRESFullPaper22018EmpiricalPerformanceofRealEstateInvestmentTrustsandShareho...AfRESFullPaper22018EmpiricalPerformanceofRealEstateInvestmentTrustsandShareho...
AfRESFullPaper22018EmpiricalPerformanceofRealEstateInvestmentTrustsandShareho...yordanosyohannes2
 
(办理原版一样)QUT毕业证昆士兰科技大学毕业证学位证留信学历认证成绩单补办
(办理原版一样)QUT毕业证昆士兰科技大学毕业证学位证留信学历认证成绩单补办(办理原版一样)QUT毕业证昆士兰科技大学毕业证学位证留信学历认证成绩单补办
(办理原版一样)QUT毕业证昆士兰科技大学毕业证学位证留信学历认证成绩单补办fqiuho152
 
fca-bsps-decision-letter-redacted (1).pdf
fca-bsps-decision-letter-redacted (1).pdffca-bsps-decision-letter-redacted (1).pdf
fca-bsps-decision-letter-redacted (1).pdfHenry Tapper
 
Andheri Call Girls In 9825968104 Mumbai Hot Models
Andheri Call Girls In 9825968104 Mumbai Hot ModelsAndheri Call Girls In 9825968104 Mumbai Hot Models
Andheri Call Girls In 9825968104 Mumbai Hot Modelshematsharma006
 
VIP Call Girls LB Nagar ( Hyderabad ) Phone 8250192130 | ₹5k To 25k With Room...
VIP Call Girls LB Nagar ( Hyderabad ) Phone 8250192130 | ₹5k To 25k With Room...VIP Call Girls LB Nagar ( Hyderabad ) Phone 8250192130 | ₹5k To 25k With Room...
VIP Call Girls LB Nagar ( Hyderabad ) Phone 8250192130 | ₹5k To 25k With Room...Suhani Kapoor
 
Instant Issue Debit Cards - High School Spirit
Instant Issue Debit Cards - High School SpiritInstant Issue Debit Cards - High School Spirit
Instant Issue Debit Cards - High School Spiritegoetzinger
 
SBP-Market-Operations and market managment
SBP-Market-Operations and market managmentSBP-Market-Operations and market managment
SBP-Market-Operations and market managmentfactical
 
Interimreport1 January–31 March2024 Elo Mutual Pension Insurance Company
Interimreport1 January–31 March2024 Elo Mutual Pension Insurance CompanyInterimreport1 January–31 March2024 Elo Mutual Pension Insurance Company
Interimreport1 January–31 March2024 Elo Mutual Pension Insurance CompanyTyöeläkeyhtiö Elo
 
Independent Lucknow Call Girls 8923113531WhatsApp Lucknow Call Girls make you...
Independent Lucknow Call Girls 8923113531WhatsApp Lucknow Call Girls make you...Independent Lucknow Call Girls 8923113531WhatsApp Lucknow Call Girls make you...
Independent Lucknow Call Girls 8923113531WhatsApp Lucknow Call Girls make you...makika9823
 
How Automation is Driving Efficiency Through the Last Mile of Reporting
How Automation is Driving Efficiency Through the Last Mile of ReportingHow Automation is Driving Efficiency Through the Last Mile of Reporting
How Automation is Driving Efficiency Through the Last Mile of ReportingAggregage
 
Q3 2024 Earnings Conference Call and Webcast Slides
Q3 2024 Earnings Conference Call and Webcast SlidesQ3 2024 Earnings Conference Call and Webcast Slides
Q3 2024 Earnings Conference Call and Webcast SlidesMarketing847413
 
Log your LOA pain with Pension Lab's brilliant campaign
Log your LOA pain with Pension Lab's brilliant campaignLog your LOA pain with Pension Lab's brilliant campaign
Log your LOA pain with Pension Lab's brilliant campaignHenry Tapper
 
Call Girls Service Nagpur Maya Call 7001035870 Meet With Nagpur Escorts
Call Girls Service Nagpur Maya Call 7001035870 Meet With Nagpur EscortsCall Girls Service Nagpur Maya Call 7001035870 Meet With Nagpur Escorts
Call Girls Service Nagpur Maya Call 7001035870 Meet With Nagpur Escortsranjana rawat
 
Authentic No 1 Amil Baba In Pakistan Authentic No 1 Amil Baba In Karachi No 1...
Authentic No 1 Amil Baba In Pakistan Authentic No 1 Amil Baba In Karachi No 1...Authentic No 1 Amil Baba In Pakistan Authentic No 1 Amil Baba In Karachi No 1...
Authentic No 1 Amil Baba In Pakistan Authentic No 1 Amil Baba In Karachi No 1...First NO1 World Amil baba in Faisalabad
 
Monthly Market Risk Update: April 2024 [SlideShare]
Monthly Market Risk Update: April 2024 [SlideShare]Monthly Market Risk Update: April 2024 [SlideShare]
Monthly Market Risk Update: April 2024 [SlideShare]Commonwealth
 
The Triple Threat | Article on Global Resession | Harsh Kumar
The Triple Threat | Article on Global Resession | Harsh KumarThe Triple Threat | Article on Global Resession | Harsh Kumar
The Triple Threat | Article on Global Resession | Harsh KumarHarsh Kumar
 

Recently uploaded (20)

Quantitative Analysis of Retail Sector Companies
Quantitative Analysis of Retail Sector CompaniesQuantitative Analysis of Retail Sector Companies
Quantitative Analysis of Retail Sector Companies
 
House of Commons ; CDC schemes overview document
House of Commons ; CDC schemes overview documentHouse of Commons ; CDC schemes overview document
House of Commons ; CDC schemes overview document
 
Classical Theory of Macroeconomics by Adam Smith
Classical Theory of Macroeconomics by Adam SmithClassical Theory of Macroeconomics by Adam Smith
Classical Theory of Macroeconomics by Adam Smith
 
AfRESFullPaper22018EmpiricalPerformanceofRealEstateInvestmentTrustsandShareho...
AfRESFullPaper22018EmpiricalPerformanceofRealEstateInvestmentTrustsandShareho...AfRESFullPaper22018EmpiricalPerformanceofRealEstateInvestmentTrustsandShareho...
AfRESFullPaper22018EmpiricalPerformanceofRealEstateInvestmentTrustsandShareho...
 
(办理原版一样)QUT毕业证昆士兰科技大学毕业证学位证留信学历认证成绩单补办
(办理原版一样)QUT毕业证昆士兰科技大学毕业证学位证留信学历认证成绩单补办(办理原版一样)QUT毕业证昆士兰科技大学毕业证学位证留信学历认证成绩单补办
(办理原版一样)QUT毕业证昆士兰科技大学毕业证学位证留信学历认证成绩单补办
 
fca-bsps-decision-letter-redacted (1).pdf
fca-bsps-decision-letter-redacted (1).pdffca-bsps-decision-letter-redacted (1).pdf
fca-bsps-decision-letter-redacted (1).pdf
 
Andheri Call Girls In 9825968104 Mumbai Hot Models
Andheri Call Girls In 9825968104 Mumbai Hot ModelsAndheri Call Girls In 9825968104 Mumbai Hot Models
Andheri Call Girls In 9825968104 Mumbai Hot Models
 
VIP Call Girls LB Nagar ( Hyderabad ) Phone 8250192130 | ₹5k To 25k With Room...
VIP Call Girls LB Nagar ( Hyderabad ) Phone 8250192130 | ₹5k To 25k With Room...VIP Call Girls LB Nagar ( Hyderabad ) Phone 8250192130 | ₹5k To 25k With Room...
VIP Call Girls LB Nagar ( Hyderabad ) Phone 8250192130 | ₹5k To 25k With Room...
 
Instant Issue Debit Cards - High School Spirit
Instant Issue Debit Cards - High School SpiritInstant Issue Debit Cards - High School Spirit
Instant Issue Debit Cards - High School Spirit
 
SBP-Market-Operations and market managment
SBP-Market-Operations and market managmentSBP-Market-Operations and market managment
SBP-Market-Operations and market managment
 
Interimreport1 January–31 March2024 Elo Mutual Pension Insurance Company
Interimreport1 January–31 March2024 Elo Mutual Pension Insurance CompanyInterimreport1 January–31 March2024 Elo Mutual Pension Insurance Company
Interimreport1 January–31 March2024 Elo Mutual Pension Insurance Company
 
Independent Lucknow Call Girls 8923113531WhatsApp Lucknow Call Girls make you...
Independent Lucknow Call Girls 8923113531WhatsApp Lucknow Call Girls make you...Independent Lucknow Call Girls 8923113531WhatsApp Lucknow Call Girls make you...
Independent Lucknow Call Girls 8923113531WhatsApp Lucknow Call Girls make you...
 
How Automation is Driving Efficiency Through the Last Mile of Reporting
How Automation is Driving Efficiency Through the Last Mile of ReportingHow Automation is Driving Efficiency Through the Last Mile of Reporting
How Automation is Driving Efficiency Through the Last Mile of Reporting
 
Commercial Bank Economic Capsule - April 2024
Commercial Bank Economic Capsule - April 2024Commercial Bank Economic Capsule - April 2024
Commercial Bank Economic Capsule - April 2024
 
Q3 2024 Earnings Conference Call and Webcast Slides
Q3 2024 Earnings Conference Call and Webcast SlidesQ3 2024 Earnings Conference Call and Webcast Slides
Q3 2024 Earnings Conference Call and Webcast Slides
 
Log your LOA pain with Pension Lab's brilliant campaign
Log your LOA pain with Pension Lab's brilliant campaignLog your LOA pain with Pension Lab's brilliant campaign
Log your LOA pain with Pension Lab's brilliant campaign
 
Call Girls Service Nagpur Maya Call 7001035870 Meet With Nagpur Escorts
Call Girls Service Nagpur Maya Call 7001035870 Meet With Nagpur EscortsCall Girls Service Nagpur Maya Call 7001035870 Meet With Nagpur Escorts
Call Girls Service Nagpur Maya Call 7001035870 Meet With Nagpur Escorts
 
Authentic No 1 Amil Baba In Pakistan Authentic No 1 Amil Baba In Karachi No 1...
Authentic No 1 Amil Baba In Pakistan Authentic No 1 Amil Baba In Karachi No 1...Authentic No 1 Amil Baba In Pakistan Authentic No 1 Amil Baba In Karachi No 1...
Authentic No 1 Amil Baba In Pakistan Authentic No 1 Amil Baba In Karachi No 1...
 
Monthly Market Risk Update: April 2024 [SlideShare]
Monthly Market Risk Update: April 2024 [SlideShare]Monthly Market Risk Update: April 2024 [SlideShare]
Monthly Market Risk Update: April 2024 [SlideShare]
 
The Triple Threat | Article on Global Resession | Harsh Kumar
The Triple Threat | Article on Global Resession | Harsh KumarThe Triple Threat | Article on Global Resession | Harsh Kumar
The Triple Threat | Article on Global Resession | Harsh Kumar
 

great atlantic & pacific tea Annual_Report_2005

  • 1. annual report to stockholders fiscal 2005 the great atlantic & pacific tea co., inc.
  • 2. Table of Contents Executive Chairman Letter to Stockholders................................................. 3 President and Chief Executive Officer Letter to Stockholders ..................... 5 Management’s Discussion and Analysis...................................................... 8 Consolidated Statements of Operations ...................................................... 52 Consolidated Statements of Stockholders’ Equity and Comprehensive (Loss) Income ..................................................... 53 Consolidated Balance Sheets...................................................................... 54 Consolidated Statements of Cash Flows ..................................................... 55 Notes to Consolidated Financial Statements ............................................... 56 Management’s Annual Report on Internal Control over Financial Reporting 122 Report of Independent Registered Public Accounting Firm ......................... 123 Five Year Summary of Selected Financial Data .......................................... 125 Executive Officers........................................................................................ 127 Board of Directors........................................................................................ 127 Stockholder Information............................................................................... 128 2
  • 3. Company Profile The Great Atlantic & Pacific Tea Company, Inc. (“We,” “Our,” “Us” or “our Company”), based in Montvale, New Jersey, operates conventional supermarkets, combination food and drug stores, and limited assortment food stores in 9 U.S. states and the District of Columbia under the A&P, Waldbaum’s, The Food Emporium, Super Foodmart, Super Fresh, Farmer Jack, Sav-A- Center and Food Basics trade names. EXECUTIVE CHAIRMAN LETTER TO STOCKHOLDERS To Our Stockholders: Fiscal 2005 was a year of momentous and positive change for A&P, as we took decisive actions to strengthen our financial position, reduce operating costs, and launch dynamic retail strategies to restore profitability and stimulate growth. • Through the successful divestiture of our Canadian operations completed in August to Metro, Inc., we realized the substantial value of that business, built over the past decade. In addition to the cash proceeds that transformed our balance sheet, we gained a significant investment position in the new combined entity, giving A&P a meaningful stake in one of the most profitable and growth-oriented retail enterprises in North America. • We moved to upgrade the quality and lower the cost of logistical support of our U.S. store network, by extending our business relationship with C&S Wholesale Grocers, Inc. to encompass virtually all distribution activity and large scale volume purchasing of goods. • We reviewed our organization and administration, producing substantial reductions that aligned our cost structure to the revenue base of the new A&P, following the Canadian sale and the strategic closure of underperforming U.S. stores during the year. The sale of A&P Canada also fostered a positive change in our leadership structure. Effective August 15, 2005, I became Executive Chairman of the Board, fully assuming long-range strategic leadership of the Company; and former A&P Canada CEO Eric Claus became President and Chief Executive Officer, with full responsibility for the day to day operation of A&P. Operating through his new Executive Management Team, Eric completed the administrative reductions initiated earlier in the year; centralized direction of the business at the headquarters level, and took immediate steps to upgrade operations and merchandising, and improve our every-day pricing and promotional appeal. The combined impact of these cost reduction, reorganization and operating measures turned the tide of our results during the second half of Fiscal 2005, as we posted our best identical stores sales increases in many quarters, and a corresponding improvement in profit from store operations. In December 2005, our Board of Directors endorsed a comprehensive strategic operating plan submitted by the new Executive Management Team. 3
  • 4. That plan combines dynamic retail strategies with strict cost management, to return A&P to sustainable profitability by Fiscal 2007, steadily grow our consumer franchise and market share, and position the business to take advantage of suitable growth opportunities going forward. Specific elements of the strategic plan, our ongoing results and future goals for the Company will be addressed by Eric Claus in the accompanying letter that follows. Early in Fiscal 2006, our Board of Directors approved the payment of a special dividend in the amount of $300 million which was distributed to all our stockholders in April. This sharing of proceeds from the Canadian divestiture with investors reflected both our appreciation of their ongoing support, and growing confidence in our turnaround and growth prospects. By virtue of our decisive actions in the past year, our new leadership and our exciting retail strategies, it is my belief that we are better positioned than ever to embrace the developing sea changes in both the nature and structure of our industry, and convert them to profitable opportunities for A&P in North America. Finally, I want to pay special tribute to our Sav-A-Center management team and associates in New Orleans. As the result of their commitment and fortitude in the wake of Hurricane Katrina’s terrible devastation last fall, we now have 23 stores open and serving grateful customers who remained in their hard-hit communities, and those returning to them. I cannot overstate our admiration for this intrepid team, whose amazing accomplishment has truly inspired us all. In closing, my thanks to all of our key stakeholders – our customers, employees, suppliers and stockholders – for their ongoing support through challenging times of change, as we work to realize both our immediate objectives and the long-range success of the New A&P. I also want to express my thanks to our Board of Directors for their diligent participation and strong support throughout the planning and execution of our strategic restructuring. Sincerely, Christian Haub, Executive Chairman 4
  • 5. PRESIDENT AND CHIEF EXECUTIVE OFFICER LETTER TO STOCKHOLDERS To Our Stockholders: This is my first year-end address as Chief Executive Officer of A&P, and I’m honored to be entrusted with leadership at such an exciting time for our Company. Many difficult decisions and much hard work created the opportunity we have at A&P today, and my thanks go to Christian Haub and our Board of Directors for their courageous and determined actions, and for their vote of confidence in our new Executive Management Team. I commend our new team and all of our associates, who despite significant organizational changes following our midyear transition, remained focused on the business and revitalized our key operating results in the second half. This was a tall order for our people, and they responded admirably. In those months, we rapidly enforced fundamental operating, purchasing and merchandising disciplines, and curtailed activities and attached costs that had no direct bearing on the retail business. The Road Ahead Our Strategic Plan is designed to significantly improve our results to meet stockholders’ expectations through Fiscal 2007. We are focused on growth and expansion – rooted in three overarching objectives – build sales profitably, reduce costs, and by Fiscal 2008, improve at least 75% of our store base to prototype standards in three retail formats: Fresh, Discount and Gourmet. Build Sales Profitably • Our new senior management team understands and is committed to its accountability for top and bottom line results. • We are negotiating more vigorously with product vendors, both directly and through C&S Wholesale Grocers, to significantly lower our cost of goods across the board. Our goal is to increase sales and direct product profitability, by serving as the most efficient purchasing agent for our customers. The lower cost of goods will also support more aggressive pricing and sharper ad specials on popular items without suppressing margins – to build profitable sales. 5
  • 6. We will support those efforts on the Operations side by stressing the fundamental best practices – clean, well organized stores, courteous and professional associates, and store managers visible to employees and customers on the sales floor. • Comprehensive training will be delivered to the majority of our store associates in Fiscal 2006, as we roll out our “Make It Personal” customer service program across the Company. Reduce Costs • We lowered overheads by approximately $50 million in Fiscal 2005 through the reduction of administrative and certain operating positions and other expenses. • In addition to the vigorous actions we are taking with vendors to continue to lower our costs on behalf of our customers, we will likewise continue in fiscal year 2006 to be dedicated to lowering our store operating, general and administrative overheads. Bring Store Base to Standard • Our Board of Directors has approved a three-year capital development plan providing the funds necessary to develop our Fresh, Discount and Gourmet store formats in appropriate locations. • Our innovative Fresh store prototype – which sets our new standards for natural, organic, prepared and specialty foods along with everyday grocery, general merchandise and pharmacy offerings – combines the best elements of our former profitable Canadian format with those of our initial U.S. examples. It was launched in March in Midland Park, N.J. to a very positive customer and media response, and has maintained a consistent double-digit year-over-year sales increase. We will convert a significant number of stores to this format from Fiscal 2006 through Fiscal 2008. • We have totally revamped the look, product assortment and merchandising of our discount Food Basics format. We are convinced of the ability of this attractive, well-maintained, rewarding-to-shop discount supermarket to succeed in many U.S. markets as our original Food Basics operation did in Canada. We recently opened our totally new Food Basics prototype in Glassboro, N.J., and the shopper response and sales performance have borne out our confidence in the concept. As with our Fresh concept, we will convert the appropriate number of stores to this prototype Discount format from Fiscal 2006 through Fiscal 2008. • Later this year, we will begin elevating our Food Emporium business to world class levels in New York City by taking our menu, services and store design to an entirely new level. Our vision is to distinguish this venerable gourmet brand as the premier destination for fine foods. • At this writing, we are in the process of unveiling an aggressive, value-oriented marketing initiative for our Farmer Jack operations in Michigan, underlining our renewed commitment to that marketplace. Recalling prior tradition and success as Detroit’s Home Town Grocer, our “Jack is Back” launch will rekindle the “Farmer Jack Savings Time” aura that still resonates with the area’s quality-and-value-conscious shoppers. We have already seen financial improvement at Farmer Jack, due in part to the cost benefits of our amended labor agreement 6
  • 7. there. We thank our union associates for demonstrating their commitment in that way, and are joining with them to usher in a great new era for customers and workers alike. The fresh thinking now transforming our business also includes exciting marketing developments that we are applying across A&P formats and store banners. In New York City, its outer boroughs and on Long Island, customers of The Food Emporium, and more recently our Waldbaum’s stores, are now enjoying the added convenience of online shopping. This is a popular and growing element of our customer service offer that we intend to expand across operations over time. These, and the additional improvements and innovations to come, are aimed at recreating the unshakeable bond with consumers that John and George Hartford forged so many decades ago, along the way to building in A&P the greatest retail enterprise of their era. Our go-to-market strategies, and the backstage efforts supporting them, are aligned behind that traditional yet ever- timely principle. Despite the many challenges ahead of us, I am confident about what’s in store for A&P and proud to be part of it. Our assets include a strong balance sheet, improving results, irreplaceable locations, talented and committed leadership, dedicated associates, and targeted retail formats appealing to specific and profitable customer segments. Our plan is simple yet strategically sound. It has been communicated throughout the Company, as has our determination to see it through. Our ultimate vision is to restore The Great A&P to its rightful position as a leader – where “Fresh Thinking Since 1859” not only defines an illustrious past, but ensures a promising future. With the essential ingredients for success in place, it’s all up to us, and I look forward to working with my team, and all of our associates, in achieving it. Sincerely, Eric Claus President and Chief Executive Officer 7
  • 8. The Great Atlantic & Pacific Tea Company, Inc. Management’s Discussion and Analysis INTRODUCTION The following Management’s Discussion and Analysis is intended to help the reader understand the financial position, operating results, and cash flows of The Great Atlantic and Pacific Tea Company, Inc. It should be read in conjunction with our financial statements and the accompanying notes (“Notes”). It discusses matters that Management considers relevant to understanding the business environment, financial position, results of operations and our Company’s liquidity and capital resources. These items are presented as follows: • Basis of Presentation – a discussion of our Company’s fiscal year-end. • Overview — a general description of our business; the value drivers of our business; measurements; opportunities; challenges and risks; and initiatives. • 2006 Outlook — a discussion of certain trends or business initiatives for the upcoming year that Management wishes to share with the reader to assist in understanding the business. • Review of Continuing Operations and Liquidity and Capital Resources – a discussion of results for fiscal 2005 and 2004, significant business initiatives, current and expected future liquidity and the impact of various market risks on our Company. • Market Risk – a discussion of the impact of market changes on our consolidated financial statements. • Critical Accounting Estimates – a discussion of significant estimates made by Management. • Impact of New Accounting Pronouncements – a discussion of authoritative pronouncements that have been or will be adopted by our Company. BASIS OF PRESENTATION Our fiscal year ends on the last Saturday in February. Fiscal 2005 ended February 25, 2006, fiscal 2004 ended February 26, 2005, and fiscal 2003 ended February 28, 2004. Fiscal 2005 and fiscal 2004 were each comprised of 52 weeks, and fiscal 2003 was comprised of 53 weeks. Except where noted, all amounts are presented in millions, and all net income (loss) per share data presented is both basic and diluted. 8
  • 9. The Great Atlantic & Pacific Tea Company, Inc. Management’s Discussion and Analysis – Continued OVERVIEW The Great Atlantic & Pacific Tea Company, Inc., based in Montvale, New Jersey, operates conventional supermarkets, combination food and drug stores and discount food stores in 9 U.S. states and the District of Columbia. Our Company’s business consists strictly of our retail operations, which totaled 405 stores as of February 25, 2006. Commencing in the second half of fiscal 2005, our United States retail operations are now organized in three regions: North Region, operating A&P supermarkets in New York and Northern New Jersey, The Food Emporium in Westchester County, N.Y, A&P/Super Foodmart stores in Connecticut, and all Food Basics discount stores; Central Region, operating all Waldbaum’s supermarkets, The Food Emporium in Manhattan, and the Farmer Jack supermarkets in Michigan; and South Region, operating Super Fresh supermarkets in Baltimore and Philadelphia, A&P supermarkets in Central New Jersey and Sav-A-Center supermarkets in the greater New Orleans market. Focused operating and merchandising improvements combined with the continued reduction of operating costs resulted in further progress for A&P. Alongside these systemic improvements that remain under way, our Company launched outstanding examples of our future fresh stores to enthusiastic customer responses in New Jersey and Baltimore as well as in New Orleans, where we, at the end of March 2006, have 23 stores fully operative and thriving as they serve that recovering marketplace. Perhaps most notable as an indicator of our retail future was the unveiling in February of our new-generation fresh store, in Midland Park, New Jersey. Combining the best Fresh product and service elements previously introduced in the U.S. with those applied so successfully in our former Canadian operations, this formula has produced spectacular sales gains at that location, while generating considerable word-of-mouth and media attention in the market. The success of our newest Fresh remodels validates the prototype Midland Park design as the general baseline for our future Fresh store rollout, which combined with our gourmet and discount strategies, will result in a comprehensive and profitable three-tier marketing thrust to be rolled out over the next three years. We are on track with an aggressive capital development program that is consistent with our three-year strategic plan. Across the business, we continued driving intensive improvements – in merchandising, we upgraded, re-priced and fine-tuned product assortments to combine customer appeal with greater efficiency; while in operations, we continued to standardize best practices and improve our service levels. We are making significant progress in improving our price and value image with consumers, through more aggressive and strategic weekly ad features; and the steady improvement of pricing levels, through our Temporary Price Reduction (“TPR”) program. The careful balance of operating and merchandising improvements, expense control measures and retail pricing adjustments is monitored closely by senior management, to ensure 9
  • 10. The Great Atlantic & Pacific Tea Company, Inc. Management’s Discussion and Analysis – Continued both steadily improving results, and a more appealing and satisfying shopping experience for customers. We are aggressively reducing our cost of goods through auctioning, strategic purchasing changes with our vendors and volume buying with our supply and logistics provider, C&S Wholesale Grocers. On the administrative side, the personnel reduction and reorganization initiative begun earlier in the year was essentially completed in the fourth quarter, as we further consolidated management and administration, and completed the conversion of our field operations from the previous banner orientation to a more centralized framework. This action dovetailed with the consolidation of our headquarters management and support personnel in Montvale, New Jersey. In addition to the significant cost savings generated, our business will now realize the clear benefit of a cohesive team under one roof. 2006 OUTLOOK The ongoing improvement of our results, via the key actions described in our strategic plan, remains management’s principal focus and objective for the first half of Fiscal 2006 and beyond. The resolution of previous organizational and logistical issues has positioned the company to sustain sales and earnings improvement, with full emphasis on executing our marketing and retail development plans, augmented by ongoing cost control disciplines throughout the company. Key elements are as follows: • Move forward with the conversion of appropriate locations to the Fresh format prototype successfully launched in Midland Park, New Jersey in the fourth quarter; • Launch the first example of our upgraded discount Food Basics concept; • Complete development of our new generation Gourmet concept, for introduction later in the year under our Food Emporium Gourmet banner in New York City; • Successfully complete the introduction of our new merchandising strategy for Farmer Jack in Michigan, reiterating our commitment to the market, and a new freshness and value proposition for area food shoppers. • Continue to improve our every-day grocery pricing and value image, through more efficient buying and distribution practices, promotional programs, and the expansion of our TPR program. Supporting those development efforts is ongoing adherence to cost control, and further reduction wherever possible without compromising the growth and quality of our business. We will continue to seek additional means of improving labor productivity in cooperation with our 10
  • 11. The Great Atlantic & Pacific Tea Company, Inc. Management’s Discussion and Analysis – Continued people and their labor unions, and by seeking all reasonable opportunities to lower administrative, advertising, occupancy and other operating expenses. In summary, we are encouraged by the progress we have generated over the past two quarters. More importantly, we are confident that the strategies we are executing provide ample potential for continued and hopefully accelerated improvement. We fully believe that our improving operations, merchandising and store development will enable us to continue elevating our competitive profile and operating performance in Fiscal 2006 and beyond. Various factors could cause us to fail to achieve these goals. These include, among others, the following: • Actions of competitors could adversely affect our sales and future profits. The grocery retailing industry continues to experience fierce competition from other food retailers, super-centers, mass merchandisers, warehouse clubs, drug stores, dollar stores and restaurants. Our continued success is dependent upon our ability to effectively compete in this industry and to reduce operating expenses, including managing health care and pension costs contained in our collective bargaining agreements. The competitive practices and pricing in the food industry generally and particularly in our principal markets may cause us to reduce our prices in order to gain or maintain share of sales, thus reducing margins. • Changes in the general business and economic conditions in our operating regions, including the rate of inflation, population growth, the rising prices of oil and gas, the nature and extent of continued consolidation in the food industry and employment and job growth in the markets in which we operate, may affect our ability to hire and train qualified employees to operate our stores. This would negatively affect earnings and sales growth. General economic changes may also affect the shopping habits and buying patterns of our customers, which could affect sales and earnings. We have assumed economic and competitive situations will not worsen in fiscal 2006 and 2007. However, we cannot fully foresee the effects of changes in economic conditions, inflation, population growth, the rising prices of oil and gas, customer shopping habits and the consolidation of the food industry on our business. • Our capital expenditures could differ from our estimate if we are unsuccessful in acquiring suitable sites for new stores, or if development and remodel costs vary from those budgeted. • Our ability to achieve our profit goals will be affected by (i.) our success in executing category management and purchasing programs that we have underway, which are designed to improve our gross margins and reduce product costs while making our product selection more attractive to consumers, (ii.) our ability to achieve productivity improvements and shrink reduction in our stores, (iii.) our success in generating efficiencies in our supporting activities, and (iv.) our ability to eliminate or maintain a minimum level of supply and/or quality control problems with our vendors. • The vast majority of our employees are members of labor unions. While we believe that our relationships with union leaderships and our employees are satisfactory, we operate under collective bargaining agreements which periodically must be renegotiated. In the coming year, 11
  • 12. The Great Atlantic & Pacific Tea Company, Inc. Management’s Discussion and Analysis – Continued we have several contracts expiring and under negotiation. In each of these negotiations rising health care and pension costs will be an important issue, as will the nature and structure of work rules. We are hopeful, but cannot be certain, that we can reach satisfactory agreements without work stoppages in these markets. However, the actual terms of the renegotiated collective bargaining agreements, our future relationships with our employees and/or a prolonged work stoppage affecting a substantial number of stores could have a material effect on our results. • The amount of contributions made to our pension and multi-employer plans will be affected by the performance of investments made by the plans and the extent to which trustees of the plans reduce the costs of future service benefits. • Our Company currently acquires a significant amount of our saleable inventory from one supplier, C&S Wholesale Grocers, Inc. Although there are a limited number of distributors that can supply our stores, we believe that other suppliers could provide similar product on comparable terms. However, a change in suppliers could cause a delay in distribution and a possible loss of sales, which would affect operating results adversely. • We have estimated our exposure to claims, administrative proceedings and litigation and believe we have made adequate provisions for them, where appropriate. Unexpected outcomes in both the costs and effects of these matters could result in an adverse effect on our earnings. Other factors and assumptions not identified above could also cause actual results to differ materially from those set forth in the forward-looking information. Accordingly, actual events and results may vary significantly from those included in or contemplated or implied by forward-looking statements made by us or our representatives. REVIEW OF CONTINUING OPERATIONS AND LIQUIDITY AND CAPITAL RESOURCES Our consolidated financial information presents the results related to our operations of discontinued businesses separate from the results of our continuing operations. Both the discussion and analysis that follows focus on continuing operations. As further discussed in Note 2- Divestiture of Our Business in Canada and Stores in the Midwest, we sold our Canadian operations to Metro, Inc. at the close of business on August 13, 2005. Therefore, comparative information relating to our Canadian business that follows was comprised of 24 weeks and 52 weeks during fiscal years 2005 and 2004, respectively. 12
  • 13. The Great Atlantic & Pacific Tea Company, Inc. Management’s Discussion and Analysis – Continued FISCAL 2005 COMPARED WITH FISCAL 2004 Sales for fiscal 2005 were $8.7 billion, compared with $10.9 billion for fiscal 2004; comparable store sales, which includes stores that have been in operation for two full fiscal years and replacement stores, increased 0.5%. Loss from continuing operations reversed from $184.0 million for fiscal 2004 to income from continuing operations of $390.4 million for fiscal 2005 primarily due to the gain on sale of our Canadian operations of $912.1 million. Net income per share – basic and diluted for fiscal 2005 was $9.74 and $9.64, respectively, compared to a net loss per share – basic and diluted of $4.88 for fiscal 2004. Favorable / Fiscal 2005 Fiscal 2004 (Unfavorable) % Change Sales $ 8,740.3 $ 10,854.9 $(2,114.6) (19.5%) Increase in comparable store sales 0.5% 0.1% NA NA − Gain on sale of Canadian operations 912.1 912.1 100.0 Income (loss) from continuing operations 390.4 (184.0) 574.4 >100.0 Income (loss) from discontinued operations 2.2 (4.1) 6.3 >100.0 Net income (loss) 392.6 (188.1) 580.7 >100.0 Net income (loss) per share – basic 9.74 (4.88) 14.62 >100.0 Net income (loss) per share - diluted 9.64 (4.88) 14.52 >100.0 SALES Sales for fiscal 2005 of $8,740.3 million decreased $2,114.6 million or 19.5% from sales of $10,854.9 million for fiscal 2004. The lower sales were due to a decrease in U.S. sales of $301.2 million and a decrease in Canadian sales of $1,813.4 million. The following table presents sales for each of our reportable operating segments for fiscal 2005 and fiscal 2004: Fiscal 2005 Fiscal 2004 Decrease % Change United States $ 7,016.4 $ 7,317.6 $ (301.2) (4.1%) Canada 1,723.9 3,537.3 (1,813.4) (51.3) Total $ 8,740.3 $ 10,854.9 $ (2,114.6) (19.5%) The following details the dollar impact of several items affecting the decrease in sales by reportable operating segment from fiscal 2004 to fiscal 2005: Impact of Impact of Foreign Comparable Impact of New Closed Exchange Store Hurricane Stores Stores Rate Sales Katrina Other Total − United States $ 25.2 $ (330.0) $ $ 30.7 $ (36.3) $ 9.2 $ (301.2) − Canada 47.6 (65.1) 162.0 1.6 (1,959.5) (1,813.4) Total $ 72.8 $ (395.1) $ 162.0 $ 32.3 $ (36.3)_ $ (1,950.3) $ (2,114.6) The decrease in U.S. sales was primarily attributable to the closing of 67 stores since the beginning of fiscal 2004, of which 49 were closed in fiscal 2005 primarily in the Midwest, decreasing sales by $330.0 million, and the decrease in sales caused by the overall impact of Hurricane Katrina of $36.3 million. These decreases were partially offset by the opening or re- 13
  • 14. The Great Atlantic & Pacific Tea Company, Inc. Management’s Discussion and Analysis – Continued opening of 18 new stores since the beginning of fiscal 2004, of which 2 were opened or re-opened in fiscal 2005, increasing sales by $25.2 million, the increase in comparable store sales for fiscal 2005 of $30.7 million or 0.5% as compared with fiscal 2004, and the increase in sales relating to an information technology services agreement with Metro, Inc. of $9.2 million. The decrease in Canadian sales was primarily attributable to the sale of our Canadian operations that resulted in the inclusion of 24 weeks of sales during fiscal 2005 as compared to 52 weeks during fiscal 2004, decreasing sales by $1,959.5 million, and the closure of 14 stores since the beginning of fiscal 2004, of which 1 was closed in fiscal 2005, decreasing sales by $65.1 million. These decreases were partially offset by the opening or re-opening of 9 stores since the beginning of fiscal 2004, of which 1 was opened or re-opened in fiscal 2005, increasing sales by $47.6 million, the favorable effect of the Canadian exchange rate, which increased sales by $162.0 million, and the increase in comparable store sales for fiscal 2005 of $1.6 million or 0.1% for Company-operated stores and franchised stores combined, as compared to fiscal 2004. Average weekly sales per supermarket for the U.S. were approximately $330,000 for fiscal 2005 versus $323,100 for the corresponding period of the prior year, an increase of 2.1% primarily due to the impact of closing smaller stores and positive comparable store sales. Average weekly sales per supermarket for Canada were approximately $298,600 for fiscal 2005 versus $285,900 for the corresponding period of the prior year, an increase of 4.4%. This increase was primarily due to the increase in the Canadian exchange rate and higher comparable store sales. GROSS MARGIN The following table presents gross margin dollar results and gross margin as a percentage of sales by reportable operating segment for fiscal 2005 as compared to fiscal 2004. Gross margin as a percentage of sales increased 65 basis points to 28.67% for fiscal 2005 from 28.02% for fiscal 2004 primarily caused by the sale of our Canadian operations which had a lower gross margin rate. We believe the impact on margin for changes in costs and special reductions was not significant. Fiscal 2005 Fiscal 2004 Gross Margin Rate to Sales% Gross Margin Rate to Sales% United States $ 2,084.4 29.71% $ 2,177.9 29.76% Canada 420.7 24.40 863.2 24.40 Total $ 2,505.1 28.67% $ 3,041.1 28.02% The following table details the dollar impact of several items affecting the gross margin dollar decrease from fiscal 2004 to fiscal 2005: 14
  • 15. The Great Atlantic & Pacific Tea Company, Inc. Management’s Discussion and Analysis – Continued Gross Margin Sales Volume Rate Exchange Rate Other Total − − United States $ (89.6) $ (3.9) $ $ $ (93.5) Canada (58.8) 4.5 32.9 (421.1) (442.5) Total $ (148.4) $ 0.6 $ 32.9 $ (421.1) $ (536.0) STORE OPERATING, GENERAL AND ADMINISTRATIVE EXPENSE The following table presents store operating, general and administrative expense (“SG&A”) by reportable operating segment, in dollars and as a percentage of sales for fiscal 2005 compared with fiscal 2004. SG&A expense was $2,825.7 million or 32.33% for fiscal 2005 as compared to $3,114.1 million or 28.69% for fiscal 2004. Fiscal 2005 Fiscal 2004 SG&A Rate to Sales% SG&A Rate to Sales% United States $ 2,462.2 35.09% $ 2,307.2 31.53% Canada 363.5 21.09 806.9 22.81 Total $ 2,825.7 32.33% $ 3,114.1 28.69% Included in SG&A in the U.S. for fiscal 2005 were certain charges as follows: • costs relating to the closing of our owned warehouses in Edison, New Jersey and Bronx, New York of $83.2 million (119 basis points) that will not be sold as part of the sale of our U.S. distribution operations and some warehouse facilities and related assets to C&S Wholesale Grocers as discussed in Note 3 – Sale of Our U.S. Distribution Operations and Warehouses; • costs relating to the closure of stores in the Midwest as discussed in Note 8 – Asset Disposition Initiatives of $114.0 million (163 basis points); • costs relating to future occupancy costs for four stores closed in connection with Hurricane Katrina, the write-off of an asset for a favorable lease that was recorded for one of these stores that is now closed, our insurance deductible, and other related hurricane costs as discussed in Note 4 – Hurricane Katrina and Impact on U.S. Business of $19.0 million (27 basis points); • costs relating to the impairment of unrecoverable assets of $17.7 million (25 basis points) as discussed in Note 6 – Valuation of Long-Lived Assets; • costs relating to an administrative reorganization during fiscal 2005 of $17.6 million (25 basis points); • costs relating to the consolidation of our operating offices in line with our smaller operations in the U.S. of $14.8 million (21 basis points); • costs relating to the cash tender offer completed during fiscal 2005 as discussed in Note 9 – Indebtedness of $33.0 million (47 basis points); • costs relating to the settlement of our net investment hedge as discussed in Note 17 – Hedge of Net Investment in Foreign Operations of $15.4 million (22 basis points); and • costs relating to workers compensation state assessment charges as discussed in Note 1 – Summary of Significant Accounting Policies of $9.7 million (14 basis points). 15
  • 16. The Great Atlantic & Pacific Tea Company, Inc. Management’s Discussion and Analysis – Continued Partially offset by: • recoveries from our VISA/Mastercard antitrust class action litigation as discussed in Note 18 – Commitments and Contingencies of $1.5 million (2 basis points). • net gains on real estate activity of $14.9 million (21 basis points) during fiscal 2005. SG&A in the U.S. for fiscal 2004 also included certain charges as follows: • costs relating to the impairment of unrecoverable assets of $34.7 million (47 basis points); • costs relating to severance and other charges of $10.7 million (15 basis points) relating to an administrative reorganization; and • costs relating to an increase in our workers’ compensation and general liability reserves of $27.2 million (37 basis points) in response to both adverse development of prior years’ costs and other developments including a continuing trend of rising costs. Partially offset by: • a reduction in the vacation accrual of $8.6 million (12 basis points) due to a change in the vacation entitlement practice. Prior to the change in the vacation operating policy, non-union employees were fully vested on the first day of the calendar year. As such under SFAS No. 43, “Compensated Absences”, our Company accrued vacation as it was earned by non-union employees (earned in the calendar year immediately preceeding the January 1 vesting date). Under the new vacation operating policy, non-union employees vest over the year that vacation is earned, and accordingly, our Company recorded a one-time adjustment to reduce the liability. • net gains on real estate activity of $22.5 million (31 basis points) during fiscal 2005. Excluding the items listed above, SG&A within our core U.S. operations as a percentage of sales decreased by 26 basis points during fiscal 2005 as compared to fiscal 2004 primarily due to a reduction in administrative expenses of $49.5 million, a reduction in advertising costs of $9.9 million, and a reduction in depreciation expense of $9.9 million partially offset by an increase in utilities expense of $15.9 million due to rising costs of oil and gas. The decrease in SG&A in Canada of $443.4 million (172 basis points) is primarily due to the inclusion of 24 weeks of costs during fiscal 2005 as compared to 52 weeks of costs during fiscal 2004, in addition to (i.) lower depreciation expense of $21.6 million as the Canadian assets were sold during fiscal 2005 as discussed in Note 2 - Divestiture of Our Business in Canada and Stores in the Midwest, and (ii.) the absence of costs relating to the settlement of the Canadian lawsuit of $24.9 million which were included in fiscal 2004. 16
  • 17. The Great Atlantic & Pacific Tea Company, Inc. Management’s Discussion and Analysis – Continued During fiscal 2005 and fiscal 2004, we recorded impairment losses on long-lived assets as follows: Fiscal 2005 Fiscal 2004 U.S. Canada Total U.S. Canada Total Impairments due to closure or conversion in the normal course of business $ 9,851 $ 506 $10,357 $ 6,000 $ 709 $ 6,709 − 17,728 34,688 − 34,688 Impairments due to unrecoverable assets 17,728 Impairments due to closure of stores impacted by Hurricane Katrina (1) − − − − 6,090 6,090 Impairments related to the closure of stores in the Midwest (2) − − − − 6,873 6,873 Impairments related to the sale of U.S. distribution operations and warehouses (3) − − − − 8,590 8,590 Impairments related to property held as part of the 2001 Asset Disposition (2) − − − − 2,659 2,659 Impairments related to the Farmer Jack restructuring (2) − − − − 90 90 Total impairments $49,132 $ 506 $49,638 $43,437 $ 709 $44,146 (1) Refer to Note 4 – Hurricane Katrina and Impact on U.S. Business (2) Refer to Note 8 – Asset Disposition Initiatives (3) Refer to Note 3 – Sale of our U.S. Distribution Operations and Warehouses The effects of changes in estimates of useful lives were not material to ongoing depreciation expense. If current operating levels do not improve, there may be additional future impairments on long-lived assets, including the potential for impairment of assets that are held and used. GAIN ON SALE OF CANADIAN OPERATIONS As further discussed in Note 2 - Divestiture of Our Business in Canada and Stores in the Midwest, we sold our Canadian operations to Metro, Inc. at the close of business on August 13, 2005. As a result of this sale, we recorded a pretax gain of $912.1 million (gain of $805.3 million after tax) during fiscal 2005. INTEREST EXPENSE Interest expense of $92.2 million for fiscal 2005 decreased from the prior year amount of $114.1 million due primarily to (i.) the repurchase of the majority of our 7.75% Notes due April 15, 2007 and our 9.125% Senior Notes due December 15, 2011 resulting in a reduction in interest expense of $15.8 million, (ii.) a decrease in capitalized interest expense of $1.0 million due to mainly a reduction in new store builds, and (iii.) lower interest expense of $8.8 million relating to our Canadian operations due to the inclusion of its operating results for 24 weeks for fiscal 2005 as compared to 52 weeks for fiscal 2004 as a result of its sale, partially offset by higher interest expense resulting from our on-balance sheet long-term real estate liabilities, which includes sale leaseback of Company-owned properties entered into in the fourth quarter of fiscal 2003, of approximately $1.4 million and sale leaseback of locations for which we received landlord allowances of $0.5 million. 17
  • 18. The Great Atlantic & Pacific Tea Company, Inc. Management’s Discussion and Analysis – Continued INCOME TAXES The provision for income taxes from continuing operations for fiscal 2005 was $128.9 million (a $110.4 million provision for our U.S. operations and a $18.5 million provision for our Canadian operations) compared to a provision for income taxes from continuing operations for fiscal 2004 of $0.5 million (a $4.5 million provision for our U.S. operations and a $4.0 million benefit for our Canadian operations). Consistent with prior year, we continue to record a valuation allowance against our U.S. net deferred tax assets. For fiscal 2005, our effective income tax rate of 24.8% changed from the effective income tax rate of 0.3% for fiscal 2004 as follows: Fiscal 2005 Fiscal 2004 Effective Effective Tax Provision Tax Rate Tax Provision Tax Rate United States $ (110,388) 21.3% $ (4,500) 2.5% Canada (18,539) 3.5% 3,972 (2.2%) $ (128,927) 24.8% $ (528) 0.3% The change in our effective tax rate was primarily due to the tax provisions we recorded in the U.S. in connection with (i.) our Company’s Domestic Reinvestment Plan as discussed in Note 12 – Income Taxes and (ii.) the sale of our Canadian operations that occurred during fiscal 2005. DISCONTINUED OPERATIONS Beginning in the fourth quarter of fiscal year 2002 and in the early part of the first quarter of fiscal 2003, we decided to sell our operations located in Northern New England and Wisconsin, as well as our Eight O’Clock Coffee business. These asset sales are now complete. Although the Canadian operations have been sold as of February 25, 2006, the criteria necessary to classify the Canadian operations as discontinued have not been satisfied as our Company has retained significant continuing involvement in the operations of this business upon its sale. 18
  • 19. The Great Atlantic & Pacific Tea Company, Inc. Management’s Discussion and Analysis – Continued The income from operations of discontinued businesses, net of tax, for fiscal 2005 was $1.6 million as compared to a loss from operations of discontinued businesses, net of tax, of $1.4 million for fiscal 2004 and is detailed by business as follows: Fiscal 2005 Eight Northern O’Clock New England Kohl’s Coffee Total (Loss) income from operations of discontinued businesses − − − − Sales $ $ $ $ Operating expenses (58) 3,049 (187) 2,804 (Loss) income from operations of discontinued businesses, before tax (58) 3,049 (187) 2,804 Tax benefit (provision) 24 (1,281) 79 (1,178) (Loss) income from operations of discontinued businesses, net of tax $ (34) $ 1,768 $ (108) $ 1,626 Disposal related costs included in operating expenses above: Non-accruable closing costs $ (58) $ (62) $ (187) $ (307) Reversal of previously accrued − − occupancy related costs 3,717 3,717 Interest accretion on present value of future occupancy and − − severance costs (606) (606) Total disposal related costs $ (58) $ 3,049 $ (187) $ 2,804 19
  • 20. The Great Atlantic & Pacific Tea Company, Inc. Management’s Discussion and Analysis – Continued Fiscal 2004 Eight Northern O’Clock New England Kohl’s Coffee Total Income (loss) from operations of discontinued businesses − − − − Sales $ $ $ $ Operating expenses 292 (981) (698) (1,387) Income (loss) from operations of discontinued businesses, before tax 292 (981) (698) (1,387) − − − − Tax provision Income (loss) from operations of discontinued businesses, net of tax $ 292 $ (981) $ (698) $ (1,387) Disposal related costs included in operating expenses above: − − Severance and benefits $ (326) $ $ $ (326) Reversal of previously accrued − − occupancy related costs 354 354 Non-accruable closing costs 626 (595) (698) (667) Interest accretion on present value of future occupancy and − severance costs (8) (740) (748) Total disposal related costs $ 292 $ (981) $ (698) $ (1,387) The gain on disposal of discontinued operations, net of tax, was $0.6 million for fiscal 2005 as compared to a loss on disposal of discontinued operations, net of tax, of $2.7 million for fiscal 2004 and is detailed by business as follows: Fiscal 2005 Eight Northern O’Clock New England Kohl’s Coffee Total Gain on disposal of discontinued businesses − − Gain on sale of property $ $ 1,002 $ $ 1,002 Gain on disposal of discontinued − − businesses, before tax 1,002 1,002 − − Tax provision (421) (421) Gain on disposal of discontinued − − businesses, net of tax $ $ 581 $ $ 581 20
  • 21. The Great Atlantic & Pacific Tea Company, Inc. Management’s Discussion and Analysis – Continued Fiscal 2004 Eight Northern O’Clock New England Kohl’s Coffee Total Loss on disposal of discontinued businesses − − Property impairments $ $ (602) $ $ (602) − Loss on sale of business (2,100) (2,100) Loss on disposal of discontinued − businesses, before tax (602) (2,100) (2,702) − − − − Tax provision Loss on disposal of discontinued − businesses, net of tax $ $ (602) $ (2,100) $ (2,702) FISCAL 2004 COMPARED WITH FISCAL 2003 Sales for fiscal 2004 were $10.9 billion compared with $10.9 billion for fiscal 2003, which was a 53-week year; comparable store sales, which includes stores that have been in operation for two full fiscal years and replacement stores, increased 0.1%. Loss from continuing operations decreased from $213.2 million in fiscal 2003 to $184.0 million in fiscal 2004. Net loss per share – basic and diluted for fiscal 2004 was $4.88 compared to $4.08 for fiscal 2003, an increase of $0.80 per share. Favorable / Fiscal 2004 Fiscal 2003 (Unfavorable) % Change Sales $ 10,854.9 $ 10,899.3 $ (44.4) (0.4%) Increase in comparable store sales for Company-operated stores 0.1% 0.9% NA NA Loss from continuing operations (184.0) (213.2) 29.2 13.7 (Loss) income from discontinued operations (4.1) 64.3 (68.4) (106.4) Cumulative effect of a change in − accounting principle – FIN 46-R (8.0) 8.0 100.0 Net loss (188.1) (156.9) (31.2) (19.9) Net loss per share (4.88) (4.08) (0.80) (19.6) SALES Sales for fiscal 2004 of $10,854.9 million decreased $44.4 million or -0.4% from sales of $10,899.3 million for fiscal 2003. The lower sales were due to a decrease in U.S. sales of $213.3 million partially offset by an increase in Canadian sales of $168.9 million. The increase in Canadian sales was primarily due to the favorable impact of the Canadian exchange rate. The following table presents sales for each of our operating segments for fiscal 2004 and fiscal 2003: 21
  • 22. The Great Atlantic & Pacific Tea Company, Inc. Management’s Discussion and Analysis – Continued (Decrease) Fiscal 2004 Fiscal 2003 Increase % Change United States $ 7,317.6 $ 7,530.9 $ (213.3) (2.8%) Canada 3,537.3 3,368.4 168.9 5.0 Total $ 10,854.9 $ 10,899.3 $ (44.4) (0.4%) The following details the dollar impact of several items affecting the (decrease) increase in sales by operating segment from fiscal 2003 to fiscal 2004: Impact of Impact of Foreign Comparable Impact of New Closed Exchange Store 53rd Stores Stores Rate Sales Week Total − United States $ 252.5 $ (286.1) $ $ (47.1) $ (132.6) $ (213.3) Canada 315.7 (330.7) 215.0 33.6 (64.7) 168.9 Total $ 568.2 $ (616.8) $ 215.0 $ (13.5) $ (197.3) $ (44.4) The decrease in U.S. sales was attributable to the closing of 35 stores since the beginning of fiscal 2003, of which 18 were closed in fiscal 2004, decreasing sales by $286.1 million, the decrease in comparable store sales for fiscal 2004 of $47.1 million or -0.6% as compared with fiscal 2003, and the unfavorable impact of the 53rd week included in fiscal 2003 which decreased sales by $132.6 million. These decreases were partially offset by the opening or re-opening of 26 new stores since the beginning of fiscal 2003, of which 16 were opened or re-opened in fiscal 2004, increasing sales by $252.5 million. Included in the 35 stores closed since the beginning of fiscal 2003 were 6 stores closed as part of the asset disposition initiative as discussed in Note 8 of our Consolidated Financial Statements. The increase in Canadian sales was attributable to the opening or re-opening of 17 stores since the beginning of fiscal 2003, of which 8 were opened or re-opened in fiscal 2004, increasing sales by $315.7 million, the favorable effect of the Canadian exchange rate, which increased sales by $215.0 million, and the increase in comparable store sales for fiscal 2004 of $33.6 million or 1.0% for Company-operated stores and franchised stores combined, as compared to fiscal 2003. These increases were partially offset by the closure of 23 stores since the beginning of 2003, of which 13 were closed in fiscal 2004, decreasing sales by $330.7 million and the unfavorable impact of the 53rd week included in fiscal 2003 which decreased sales by $64.7 million. Average weekly sales per supermarket for the U.S. were approximately $323,100 for fiscal 2004 versus $310,000 for the corresponding period of the prior year, an increase of 4.2% primarily due to the impact of openings and closings with net higher average weekly sales. Average weekly sales per supermarket for Canada were approximately $285,900 for fiscal 2004 versus $258,000 for the corresponding period of the prior year, an increase of 10.8%. This increase was primarily due to the increase in the Canadian exchange rate and higher comparable store sales. 22
  • 23. The Great Atlantic & Pacific Tea Company, Inc. Management’s Discussion and Analysis – Continued GROSS MARGIN The following table presents gross margin dollar results and gross margin as a percentage of sales by operating segment for fiscal 2004 as compared to fiscal 2003. Gross margin as a percentage of sales decreased 17 basis points to 28.02% for fiscal 2004 from 28.19% for fiscal 2003. This 17 basis point decrease was caused by the increase in Canadian sales (which has a lower gross margin rate than the U.S. business) as a percentage of our total (approximately 10 basis points) and from the increase in U.S. Food Basics (which has the lowest gross margin rate of all our banners) as a percentage of sales (approximately 7 basis points). We believe the impact on margin for changes in costs and special reductions was not significant. Fiscal 2004 Fiscal 2003 Gross Margin Rate to Sales% Gross Margin Rate to Sales% United States $ 2,177.9 29.76% $ 2,256.1 29.96% Canada 863.2 24.40 816.0 24.23 Total $ 3,041.1 28.02% $ 3,072.1 28.19% The following table details the dollar impact of several items affecting the gross margin dollar increase (decrease) from fiscal 2003 to fiscal 2004: Sales Volume Gross Margin Rate Exchange Rate Total − United States $ (63.9) $ (14.3) $ $ (78.2) Canada (8.8) 5.4 50.6 47.2 Total $ (72.7) $ (8.9) $ 50.6 $ (31.0) STORE OPERATING, GENERAL AND ADMINISTRATIVE EXPENSE The following table presents SG&A by operating segment, in dollars and as a percentage of sales for fiscal 2004 compared to fiscal 2003. SG&A expense was $3,114.1 million or 28.69% for fiscal 2004 as compared to $3,214.9 million or 29.50% for fiscal 2003. Fiscal 2004 Fiscal 2003 SG&A Rate to Sales% SG&A Rate to Sales% United States $ 2,307.2 31.53% $ 2,464.0 32.72% Canada 806.9 22.81 750.9 22.29 Total $ 3,114.1 28.69% $ 3,214.9 29.50% The U.S. had overall favorability of 119 basis points. Part of the improvement in the U.S. is due to gains on the sale of certain of our assets of $29.3 million, the absence of the Midwest goodwill impairment charge of $27.0 million and a reduction in the vacation accrual of $8.6 million due to a change in the vacation entitlement practice. Prior to the change in the vacation operating policy, non-union employees were fully vested on the first day of the calendar year. As such under SFAS No. 43, “Compensated Absences”, our Company accrued vacation as it was earned by non-union employees (earned in the calendar year immediately preceeding the January 1 vesting date). Under the new vacation operating policy, non-union employees vest over the year 23
  • 24. The Great Atlantic & Pacific Tea Company, Inc. Management’s Discussion and Analysis – Continued that vacation is earned, and accordingly, our Company recorded a one-time adjustment to reduce the liability. Most of the favorability in the U.S. is due to very tight cost controls. Categories in which the U.S. experienced cost reductions include advertising due to less spend ($26.4 million) and labor ($36.2 million). The favorability in the U.S. was partially offset by $8.9 million of severance and other charges relating to the previously noted administrative reorganization and a $27.2 million increase in our workers’ compensation and general liability reserves in response to both adverse development of prior year’s costs and other developments including a continuing trend of rising costs. The increase in SG&A in Canada of $56.0 million is primarily due to the increase in the Canadian exchange rate of $35.3 million, an increase in labor of $28.5 million due mainly to increased sales, and an increase in occupancy of $17.9 million as a result of the opening of new stores partially offset by a decrease in advertising costs of $13.1 million due to less spend. During fiscal 2004 and fiscal 2003, we recorded property impairment losses in SG&A in our Consolidated Statements of Operations of $44.1 million and $43.8 million as follows: Fiscal 2004 Fiscal 2003 U.S. Canada Total U.S. Canada Total Impairments due to closure or conversion in the normal course of business (1) (2) $ 6,000 $ 709 $ 6,709 $ 4,439 $ 1,670 $ 6,109 Impairments due to unrecoverable assets (2) − − 34,688 34,688 33,102 33,102 Impairments related to the 2001 Asset Disposition (2) (3) − − 2,659 2,659 422 422 Impairments related to the Farmer Jack restructuring (2) (3) − − 90 90 4,129 4,129 Total impairments $43,437 $ 709 $44,146 $42,092 $ 1,670 $43,762 (1) Consists primarily of amounts that were impaired as a result of stores that were or will be closed, converted or remodeled in the normal course of business. (2) Refer to Note 6 – Valuation of Goodwill and Long-Lived Assets. (3) Refer to Note 8 – Asset Disposition Initiatives. The effects of changes in estimates of useful lives were not material to ongoing depreciation expense. INTEREST EXPENSE Interest expense of $114.1 million for fiscal 2004 increased from the prior year amount of $103.1 million due primarily to higher interest expense resulting from our on-balance sheet long- term real estate liabilities, which includes sale leaseback of Company-owned properties entered into in the fourth quarter of fiscal 2003 of approximately $15.6 million and sale leaseback of locations for which we received landlord allowances of $3.6 million. This impact was partially offset by lower interest from lower borrowings of approximately $6.5 million. 24
  • 25. The Great Atlantic & Pacific Tea Company, Inc. Management’s Discussion and Analysis – Continued INCOME TAXES The provision for income taxes from continuing operations for fiscal 2004 was $0.5 million (a $4.5 million provision for our U.S. operations and a $4.0 million benefit from our Canadian operations) compared to a $30.6 million benefit from income taxes from continuing operations for fiscal 2003 (a $42.3 million benefit from our U.S. operations and a $11.7 million provision for our Canadian operations). Our U.S. tax benefit from continuing operations for fiscal 2003 was offset by a tax provision provided on discontinued operations of $46.6 million in accordance with Statement of Financial Accounting Standards 109, “Accounting for Income Taxes”. Consistent with prior year, we continue to record a valuation allowance in an amount that would reduce our U.S. deferred tax asset to the amount that is more likely than not to be realized. For fiscal 2004, our effective income tax rate of 0.3% changed from the effective income tax rate of (12.5%) for fiscal 2003 as follows: Fiscal 2004 Fiscal 2003 Tax (Provision) Effective Tax Benefit Effective Benefit Tax Rate (Provision) Tax Rate United States $ (4,500) 2.5% $ 42,339 (17.3%) Canada 3,972 (2.2%) (11,765) 4.8% $ (528) 0.3% $ 30,574 (12.5%) The change in our effective tax rate was primarily due to the absence of a tax benefit recorded on losses from continuing operations that was limited to the tax provision recorded on income from discontinued operations in accordance with SFAS 109. As discussed above, $46.6 million of benefit was recognized for fiscal 2003 as compared to fiscal 2004, where no benefit was recognized. The remaining provisions recorded in the U.S. of $4.5 million and $4.3 million for fiscal 2004 and fiscal 2003, respectively, represent state and local taxes. In addition, the change in our effective tax rate was partially offset by the impact of the lower mix of Canadian income from continuing operations as a percentage of our Company’s loss from continuing operations for fiscal 2004 as compared to fiscal 2003. Information regarding items included in the reconciliation of the effective rate with the federal statutory rate is disclosed in Note 12 to the consolidated financial statements. DISCONTINUED OPERATIONS Beginning in the fourth quarter of fiscal year 2002 and in the early part of the first quarter of fiscal 2003, we decided to sell our operations located in Northern New England and Wisconsin, as well as our Eight O’Clock Coffee business. These asset sales are now complete. 25
  • 26. The Great Atlantic & Pacific Tea Company, Inc. Management’s Discussion and Analysis – Continued The loss from operations of discontinued businesses, net of tax, for fiscal 2004 was $1.4 million as compared to a loss from operations of discontinued businesses, net of tax, of $32.7 million for fiscal 2003 and is detailed by business as follows: Fiscal 2004 Eight Northern O’Clock New England Kohl’s Coffee Total Income (loss) from operations of discontinued businesses − − − − Sales $ $ $ $ Operating expenses 292 (981) (698) (1,387) Income (loss) from operations of discontinued businesses, before tax 292 (981) (698) (1,387) − − − − Tax provision Income (loss) from operations of discontinued businesses, net of tax $ 292 $ (981) $ (698) $ (1,387) Disposal related costs included in operating expenses above: − − Severance and benefits $ (326) $ $ $ (326) Reversal of previously accrued − − occupancy related costs 354 354 Non-accruable closing costs 626 (595) (698) (667) Interest accretion on present value − of future occupancy costs (8) (740) (748) Total disposal related costs $ 292 $ (981) $ (698) $ (1,387) 26
  • 27. The Great Atlantic & Pacific Tea Company, Inc. Management’s Discussion and Analysis – Continued Fiscal 2003 Eight Northern O’Clock New England Kohl’s Coffee Total (Loss) income from operations of discontinued businesses Sales $ 32,726 $ 123,229 $ 65,265 $ 221,220 Operating expenses (42,536) (174,890) (60,179) (277,605) (Loss) income from operations of discontinued businesses, before tax (9,810) (51,661) 5,086 (56,385) Tax benefit (provision) 4,120 21,698 (2,136) 23,682 (Loss) income from operations of discontinued businesses, net of tax $ (5,690) $ (29,963) $ 2,950 $ (32,703) Disposal related costs included in operating expenses above: − − Pension withdrawal liability $ $ (6,500) $ $ (6,500) − Occupancy related costs (3,993) (28,387) (32,380) Reversal of previously accrued − − occupancy related costs 4,458 4,458 − Non-accruable inventory costs (175) (2,511) (2,686) Non-accruable closing costs (2,555) (2,890) (12,275) (17,720) − − Gain on sale of inventory 1,645 1,645 − Severance and benefits (2,670) (6,562) (9,232) Interest accretion on present value − of future occupancy costs (6) (353) (359) Total disposal related costs $ (7,754) $ (42,745) $ (12,275) $ (62,774) The loss on disposal of discontinued operations, net of tax, was $2.7 million for fiscal 2004 as compared to gain on disposal of discontinued operations, net of tax, of $97.0 million for fiscal 2003 and is detailed by business as follows: Fiscal 2004 Eight Northern O’Clock New England Kohl’s Coffee Total Loss on disposal of discontinued businesses − − Property impairments $ $ (602) $ $ (602) − − Loss on sale of business (2,100) (2,100) Loss on disposal of discontinued − businesses, before tax (602) (2,100) (2,702) − − − − Tax provision Loss on disposal of discontinued − businesses, net of tax $ $ (602) $ (2,100) $ (2,702) 27
  • 28. The Great Atlantic & Pacific Tea Company, Inc. Management’s Discussion and Analysis – Continued Fiscal 2003 Eight Northern O’Clock New England Kohl’s Coffee Total Gain (loss) on disposal of discontinued businesses Gain on sale of fixed assets $ 85,983 $ 15,272 $ 85,000 $ 186,255 − − Fixed asset impairments (18,968) (18,968) Gain (loss) on disposal of discontinued businesses, before tax 85,983 (3,696) 85,000 167,287 Tax (provision) benefit (36,113) 1,552 (35,700) (70,261) Gain (loss) on disposal of discontinued businesses, net of tax $ 49,870 $ (2,144) $ 49,300 $ 97,026 ASSET DISPOSITION INITIATIVES Overview In fiscal 1998 and fiscal 1999, we announced a plan to close two warehouse facilities and a coffee plant in the U.S., a bakery plant in Canada and 166 stores including the exit of the Richmond, Virginia and Atlanta, Georgia markets (Project Great Renewal). In addition, during fiscal 2001, we announced that certain underperforming operations, including 39 stores (30 in the United States and 9 in Canada) and 3 warehouses (2 in the United States and 1 in Canada) would be closed and/or sold, and certain administrative streamlining would take place (2001 Asset Disposition). During fiscal 2003, we announced an initiative to close 6 stores and convert 13 stores to our Food Basics banner in the Detroit, Michigan and Toledo, Ohio markets (Farmer Jack Restructuring). In addition, through the first three quarters of fiscal 2005, we closed 35 stores in the Midwest (Closure of Stores in the Midwest). Presented below is a reconciliation of the activities recorded on our Consolidated Balance Sheets, Consolidated Statements of Operations and Consolidated Statements of Cash Flows for fiscal 2005, fiscal 2004, and fiscal 2003. Present value (“PV”) interest represents interest accretion on future occupancy costs which were recorded at present value at the time of the original charge. Non-accruable items represent charges related to the restructuring that are required to be expensed as incurred in accordance with SFAS 146 “Accounting for Costs Associated with Exit or Disposal Activities”. 28
  • 29. The Great Atlantic & Pacific Tea Company, Inc. Management’s Discussion and Analysis – Continued Fiscal 2005 Project 2001 Farmer Closure of Great Asset Jack Stores in Renewal Disposition Restructuring the Midwest Total Balance Sheet accruals Vacancy $ (3,648) $ (2,089) $ 4,376 $ 97,596 $ 96,235 PV interest 1,548 2,170 710 1,582 6,010 − − − Severance 2,666 2,666 Total accrued to balance sheets (2,100) 81 5,086 101,844 104,911 Non-accruable items recorded on Statements of Operations − − − Capital lease termination (588) (588) − − − Property writeoffs 6,873 6,873 − − − Inventory related costs 1,242 1,242 − − − Loss on sale of property 1,640 1,640 Gain on sale of pharmacy − − − scripts (870) (870) − − − Closing costs 5,131 5,131 − − − Total non-accruable items 13,428 13,428 Less PV interest (1,548) (2,170) (710) (1,582) (6,010) Total amount recorded on Statements of Operations excluding PV interest (3,648) (2,089) 4,376 113,690 112,329 Less Gain on sale of pharmacy − − − scripts 870 870 − − − Less closing costs (5,131) (5,131) Total amount recorded On Statements of Cash Flows $ (3,648) $ (2,089) $ 4,376 $ 109,429 $ 108,068 Fiscal 2004 Project 2001 Farmer Great Asset Jack Renewal Disposition Restructuring Total Balance Sheet accruals PV interest $ 1,922 $ 2,456 $ 687 $ 5,065 Total accrued to balance sheets 1,922 2,456 687 5,065 − − Occupancy reversals (4,488) (4,488) Adjustments to − − balance sheets (4,488) (4,488) Non-accruable items recorded on Statements of Operations − Property writeoffs 2,659 90 2,749 − − Inventory related costs 291 291 − − Closing costs 689 689 − Total non-accruable items 2,659 1,070 3,729 Less PV interest (1,922) (2,456) (687) (5,065) Total amount recorded on Statements of Operations − excluding PV interest (1,829) 1,070 (759) − − Less closing costs (689) (689) Total amount recorded On Statements of −$ Cash Flows $ (1,829) $ 381 $ (1,448) 29
  • 30. The Great Atlantic & Pacific Tea Company, Inc. Management’s Discussion and Analysis – Continued Fiscal 2003 Project 2001 Farmer Great Asset Jack Renewal Disposition Restructuring Total Balance Sheet accruals PV interest $ 2,638 $ 2,850 $ 56 $ 5,544 − − Occupancy 20,999 20,999 − − Severance 8,930 8,930 Total accrued to balance sheets 2,638 2,850 29,985 35,473 − − Occupancy reversals (6,778) (6,778) Additional occupancy − − accrual 991 991 − − Additional severance 1,613 1,613 Adjustments to − − balance sheets (4,174) (4,174) Non-accruable items recorded on Statements of Operations − Property writeoffs 422 4,129 4,551 − − Inventory related costs 2,244 2,244 − Closing costs 44 1,449 1,493 − Total non-accruable items 466 7,822 8,288 Less PV interest (2,638) (2,850) (56) (5,544) Total amount recorded on Statements of Operations − excluding PV interes t (3,708) 37,751 34,043 − Less closing costs (44) (1,449) (1,493) Total amount recorded On Statements of −$ Cash Flows $ (3,752) $ 36,302 $ 32,550 Project Great Renewal In May 1998, we initiated an assessment of our business operations in order to identify the factors that were impacting our performance. As a result of this assessment, in fiscal 1998 and 1999, we announced a plan to close two warehouse facilities and a coffee plant in the U.S., a bakery plant in Canada and 166 stores (156 in the United States and 10 in Canada) including the exit of the Richmond, Virginia and Atlanta, Georgia markets. As of February 25, 2006, we had closed all stores and facilities related to this phase of the initiative. 30
  • 31. The Great Atlantic & Pacific Tea Company, Inc. Management’s Discussion and Analysis – Continued The following table summarizes the activity related to this phase of the initiative over the last three fiscal years: Occupancy Severance and Benefits Total U.S. Canada Total U.S. Canada Total U.S. Canada Total Balance at − February 22, 2003 $ 48,788 $ 487 $ 49,275 $ 2,446 $ $ 2,446 $ 51,234 $ 487 $ 51,721 (1) − − − Addition 2,276 372 2,648 2,276 372 2,648 (2) − Utilization (19,592) (407) (19,999) (289) (289) (19,881) (407) (20,288) Balance at − February 28, 2004 $ 31,472 $ 452 $ 31,924 $ 2,157 $ $ 2,157 $ 33,629 $ 452 $ 34,081 (1) − − − Addition 1,902 20 1,922 1,902 20 1,922 (2) − Utilization (5,410) (222) (5,632) (497) (497) (5,907) (222) (6,129) Balance at − February 26, 2005 $ 27,964 $ 250 $ 28,214 $ 1,660 $ $ 1,660 $ 29,624 $ 250 $ 29,874 (1) − − − Addition 1,541 7 1,548 1,541 7 1,548 (2) − Utilization (5,858) (167) (6,025) (223) (223) (6,081) (167) (6,248) (3) − − − Adjustments (3,648) (90) (3,738) (3,648) (90) (3,738) Balance at − − − February 25, 2006 $ 19,999 $ $ 19,999 $ 1,437 $ $ 1,437 $ 21,436 $ $ 21,436 (1) The additions to store occupancy of $2.6 million, $1.9 million, and $1.5 million during fiscal 2003, 2004 and 2005, respectively, represent the interest accretion on future occupancy costs which were recorded at present value at the time of the original charge. (2) Occupancy utilization of $20.0 million, $5.6 million, and $6.0 million for fiscal 2003, 2004 and 2005, respectively, represents payments made during those periods for costs such as rent, common area maintenance, real estate taxes and lease termination costs. Severance utilization of $0.3 million, $0.5 million, and $0.2 million for fiscal 2003, 2004 and 2005, respectively, represents payments to individuals for severance and benefits, as well as payments to pension funds for early withdrawal from multi-employer union pension plans. (3) At each balance sheet date, we assess the adequacy of the balance to determine if any adjustments are required as a result of changes in circumstances and/or estimates. We have continued to make favorable progress in marketing and subleasing the closed stores. As a result, during fiscal 2005, we recorded an additional reduction of $3.6 million in occupancy accruals due to subleasing additional closed stores and converting a previously closed store to a store that will open in fiscal 2006. As discussed in Note 2 – Divestiture of Our Business in Canada and Stores in the Midwest, we sold our Canadian business and as a result, the Canadian occupancy accruals of $0.1 million are no longer consolidated in our Consolidated Balance Sheet at February 25, 2006. We paid $104.4 million of the total occupancy charges from the time of the original charges through February 25, 2006 which was primarily for occupancy related costs such as rent, common area maintenance, real estate taxes and lease termination costs. We paid $30.1 million of the total net severance charges from the time of the original charges through February 25, 2006, which resulted from the termination of approximately 3,400 employees. The remaining occupancy liability of $20.0 million relates to expected future payments under long term leases and is expected to be paid in full by 2020. The remaining severance liability of $1.4 million primarily relates to expected future payments for early withdrawals from multi-employer union pension plans and will be fully paid out in 2020. None of these stores were open during fiscal 2003, fiscal 2004 or fiscal 2005. As such, there was no impact from store operations on the Statements of Consolidated Operations from the 166 stores included in this phase of the initiative. At February 25, 2006 and February 26, 2005, approximately $5.1 million and $5.4 million, respectively, of the reserve was included in “Other accruals” and the remaining amount was included in “Other non-current liabilities” on the Company’s Consolidated Balance Sheets. 31