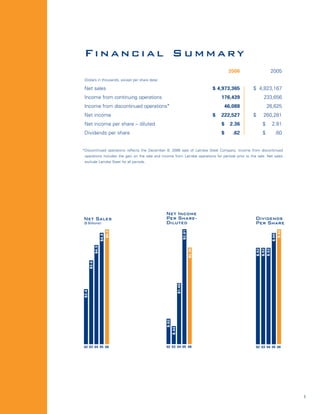
The document is Timken's 2006 annual report which discusses the company's vision for profitable growth through transforming the company. Some key points:
- In 2006, Timken embarked on significant changes including investing in growth markets, improving its portfolio through divesting non-strategic businesses, and restructuring.
- Financially, net sales reached $5 billion and net income per share was $2.36, among the highest in Timken's history.
- The company increased manufacturing capacity in aerospace and heavy industry and expanded its presence in Asia. It also acquired businesses and developed new capabilities to better serve customers.
- Timken improved its portfolio through selling businesses and pursuing restructuring activities to improve
This annual report summarizes The Home Depot's performance in fiscal year 2005. Some key points:
- Sales reached a record $81.5 billion, up from $73.1 billion the previous year. Net earnings increased 16.7% to a record $5.8 billion.
- The company continued pursuing its strategy of enhancing its core business, extending into new areas like services, and expanding into new markets like the professional contractor segment.
- 21 acquisitions were completed in 2005 to help serve professional contractors better. The largest acquisition was Hughes Supply, to expand the company's presence in the professional market.
- Internationally, the company remains the top home improvement retailer in Canada
The document summarizes The Home Depot's 2004 annual report. It discusses that in 2004, The Home Depot had record sales of $73.1 billion and saw increases in net earnings, earnings per share, total assets, and store count. Key accomplishments included comparable store sales growth of 5.4%, operating margin reaching 10.8%, and returning $4 billion to shareholders through stock buybacks and dividends. The company focused on enhancing its core business through merchandising resets and new products, extending into new store formats, and investing in its employees.
The document is The Home Depot's 2002 Annual Report. It provides the following key information:
1) The Home Depot is the world's largest home improvement retailer with fiscal 2002 sales of $58.2 billion. It operates various store formats across the US, Canada, and Mexico.
2) In 2002, The Home Depot achieved net earnings of $3.7 billion, earnings per share growth of 21%, and a return on invested capital of 18.8%. It ended the year with $2.3 billion in cash after repurchasing $2 billion in stock.
3) The Home Depot made significant investments in 2002 to transform the business through technology upgrades, merchandising
1) The Home Depot is focused on enhancing its core business through improving the shopping experience in its stores, delivering more distinctive products, and offering new services.
2) In 2003, the company invested in store transformations and new signage to improve product visibility and selection. It also upgraded technology with new POS terminals, scanning guns, and self-checkout registers to make shopping more convenient.
3) These enhancements to the in-store experience and technology are supporting sales growth and allowing associates to focus more on customer service.
The 2006 annual report summarizes the company's financial performance for the year. Total revenues increased significantly to $3.042 billion in 2006 from $1.733 billion in 2005. Net income also increased substantially to $41.536 million in 2006 from $4.049 million in 2005. Backlog reached a record high of $8.451 billion at the end of 2006, up from $7.898 billion in 2005. The company experienced growth in its building segment due to work on several large hospitality and gaming projects.
The document is MGM MIRAGE's 2007 annual report detailing their CityCenter project in Las Vegas. It describes the various components of CityCenter, including hotels, condo towers, retail space, and financial highlights. Some key points:
- CityCenter is a 76-acre, $18 billion privately funded project, the largest in US history. It includes multiple hotels, condo towers, and retail space designed by renowned architects.
- ARIA is a 61-story, 4,000 room hotel and conference center. Vdara is a 57-story condo-hotel tower with over 1,500 units. Other components include condo towers, hotels, retail space, and entertainment venues.
The document provides a summary of The Home Depot's annual report for fiscal year 2006. It discusses the company's performance highlights for 2006 including net sales of $90.8 billion and net earnings of $5.8 billion. It also lists the company's priorities going forward which include improving customer service, driving product innovation and value, improving product availability, enhancing the store environment, and serving professional contractors. Finally, it provides an overview of the company's community involvement efforts in 2006 which included responding to natural disasters and contributing to affordable housing projects.
Hormel Foods reported record net earnings of $139 million in fiscal 1998, up 27% from the previous year. This was due to strong performances across its core business groups, with all major product categories achieving record or near-record growth. Net earnings excluding a one-time gain were still the second highest in company history at $122 million, up 11% from the previous year. Total sales reached a record $3.26 billion, though tonnage grew more strongly at 10% as the company emphasized higher-value, branded products. Challenging conditions in the turkey industry suppressed Jennie-O's results despite sales and tonnage gains.
Holly Corporation is an oil refining and marketing company operating refineries in Montana and New Mexico. In its 2002 annual report, Holly Corporation reported a net income of $32 million on sales of $889 million, down from $73 million in net income the previous year. Holly Corporation also discussed ongoing litigation, expansion projects at its Navajo Refinery in New Mexico, and continued implementation of cost reduction initiatives.
The document is the 2003 annual report of The Timken Company. It summarizes key events and financial results from 2003, a year marked by the largest acquisition in company history with the purchase of The Torrington Company. The acquisition expanded Timken's product lines, services, and global reach but integration challenges impacted financial performance. Top priorities for 2004 include improving performance in the automotive group and addressing high costs in the steel business. The report outlines strategies around customer-driven innovation, performance focus, and adaptive management to take advantage of growing opportunities.
Henry Schein is the largest distributor of healthcare products and services to office-based healthcare practitioners in North America and Europe. In 2002, Henry Schein achieved record financial results with net sales of $2.8 billion, operating income of $196 million, and net income of $117 million. The company expects continued growth through increasing penetration of existing customers, gaining new customers, and cross-selling between its business groups that serve the dental, medical, veterinary, and technology markets.
Dover's annual report outlines its consistent business philosophy of achieving and maintaining market leadership in every market it serves. The report discusses Dover's goals of perceiving customers' needs, providing better products/services than competitors, investing to maintain competitive advantages, and expecting a fair price. It emphasizes focusing on quality, innovation, service, and long-term orientation. Dover enhances leadership through acquisitions that strengthen existing markets or offer new ones. Intrinsic to Dover's success is decentralized management that gives autonomy to company presidents.
Holly Corporation's 2007 annual report summarizes the company's financial and operating highlights for the year. Key highlights include record sales and other revenues of $4.79 billion, net income of $334.1 million, and net cash provided by operating activities of $422.7 million. The report also provides an overview of Holly Corporation's business as an independent petroleum refiner and marketer, including details on its two refineries in New Mexico and Utah.
This annual report summarizes the financial highlights and strategic goals of Quest Diagnostics for 2007. Some key points:
- Revenues increased 7% to $6.7 billion, operating income was $1.1 billion, and net earnings per share were $2.84.
- The company aims to grow revenues above industry rates, expand operating margins to 20% of revenues, and derive 10% of revenues internationally within 5 years.
- The strategy focuses on putting patients first, driving growth, and investing in people. Diversification efforts include expanding offerings in cancer diagnostics, gene-based testing, and point-of-care testing.
- Information technology is highlighted as a key differentiator
The Pantry, Inc. 2001 Annual Report summarizes the company's strategic moves in fiscal 2001 to strengthen its future. Despite challenges from rising gas prices and economic downturn, the company streamlined processes, enhanced efficiency, and implemented technology initiatives like new reporting and inventory systems. It acquired 45 stores to strengthen its market position but curtailed aggressive expansion. The Pantry focused on cost cuts, improving merchandise sales, and leveraging new fuel pricing systems to balance profits and volume in a volatile gas market. It positioned itself to capitalize on future growth opportunities once market conditions improve.
plains all american pipeline Annual Reports 2003finance13
Plains All American Pipeline (PAA) achieved its goals for 2003, exceeding operating and financial guidance, strengthening its balance sheet, increasing distributions to unitholders by 4.7%, and completing $160 million in acquisitions. PAA is positioned for continued growth in 2004 by meeting similar goals and expanding through $200-300 million in annual acquisitions. As North American crude oil supply and demand converge and inventories decline, PAA's stable fee-based assets and balanced business model are well-suited for increasing volatility in crude oil markets.
Dollar General Corporation is the largest small-box retailer in the US, operating 6,700 stores across 27 states. In fiscal year 2003, Dollar General saw record results with $6.87 billion in sales and $301 million in net income. Dollar General plans to continue its rapid growth by opening 675 new stores in 2004, including entering 3 new states. The company aims to become a leading provider of consumable basic products for underserved customers through conveniently located small stores offering unique products at low prices.
This document provides an overview of Constellation Brands, Inc., a leading producer and marketer of beverage alcohol. It discusses Constellation's financial highlights, major acquisitions, product portfolio breakdown, and growth strategies. Constellation has achieved strong growth through focus on higher-margin categories like imported beer, fine wine, and U.K. wholesale operations. The company aims to continue expanding in fast-growing segments and meet long-term sales and earnings targets through strategic acquisitions and execution of proven strategies.
- Yahoo reported Q2'08 financial highlights, with revenue ex-TAC of $1.346 billion, an 8% increase year-over-year but flat quarter-over-quarter.
- Operating cash flow was $427 million in Q2'08, a 10% decrease year-over-year due to costs related to strategic initiatives and a 1% decrease quarter-over-quarter.
- For full-year 2008, Yahoo expects revenue of $7.35-7.85 billion, operating cash flow of $1.825-1.975 billion, and free cash flow of $900 million to $1.05 billion.
Monsanto reported record third quarter sales and net income. Sales increased 15% compared to the previous year's third quarter due to increased corn and soybean seed and traits sales in the US and the inclusion of sales from the recently acquired Seminis vegetable seed business. Net income increased significantly due to higher revenues and a prior year write-off related to acquisitions. For the first nine months of the year, sales increased 19% and net income increased significantly, driven by growth in US corn and soybean seed and traits and herbicide sales. Monsanto also confirmed its full year earnings per share guidance.
Atlas Energy Barnett Shale Acquisition PresentationCompany Spotlight
The document discusses Atlas Resource Partners' acquisition of Barnett Shale assets from Carrizo Oil and Gas for $190 million. The acquisition is expected to be 6-12% accretive to distributions in 2012 and 7-15% accretive in 2013. ARP acquired 277 billion cubic feet equivalent of proved reserves located in the core of the Barnett Shale. If ARP makes similar future acquisitions totaling $1 billion, distributions could grow 191% over multiple years. The acquisition strengthens ARP's asset base and is expected to enhance distribution growth going forward.
Fortune Minerals Limited is a Canadian mineral development company focused on advancing its two late-stage projects: the NICO gold-cobalt-bismuth-copper project in Northwest Territories and the Mount Klappan anthracite coal project in British Columbia. Mount Klappan contains the largest and most advanced Canadian deposit of high quality anthracite coal, representing 1% of global coal reserves. There is significant future demand growth expected for metallurgical coal due to new steelmaking technologies and emerging economies, yet insufficient supply of high quality coals to meet this demand over the next decade.
Ecolab is a leading global developer and marketer of cleaning, sanitizing, pest elimination, maintenance and repair products and services. It serves the hospitality, foodservice, institutional and industrial markets. In 2003, Ecolab reported net sales of $3.76 billion, net income of $277 million, and diluted net income per share of $1.06. Ecolab is headquartered in St. Paul, Minnesota and employs over 20,000 associates worldwide serving customers in hotels, restaurants, healthcare facilities, grocery stores, and other industries.
This document is Ecolab's 2003 Annual Report. It provides details about Ecolab's business including its description, markets served, products/services provided, financial highlights for 2003, and stock performance. It summarizes that Ecolab had record sales of $3.8 billion in 2003, up 11% from 2002. Net income increased 32% to $277 million and diluted earnings per share grew 33% to $1.06. The CEO highlights strong financial results and growth despite economic uncertainties.
MeadWestvaco Corporation provides concise summaries of its annual report in 3 sentences or less:
MeadWestvaco is focused on improving productivity, innovation, and customer focus to drive profitable growth. The company achieved over $400 million in annual cost savings through consolidation and efficiency gains. MeadWestvaco remains committed to safety, environmental stewardship, and good governance as it transforms its business and sets the goal of a minimum 10% annual return on capital.
This annual report summarizes MeadWestvaco Corporation's financial performance and operations in 2003. The report discusses the company's vision, values, and business segments. It highlights that 2003 was challenging due to market weakness and high costs, but that the company responded with discipline and positioned itself for future profitability. The letter to shareholders indicates a focus on rewarding investors with profitable growth and a minimum annual return of 10% on capital.
This annual report summarizes MGM MIRAGE CityCenter's projects in Las Vegas in 2007. It includes details on six construction projects that were part of CityCenter: ARIA Resort-Casino, Vdara Condo Hotel, Veer Towers, The Harmon Hotel, Spa & Residences, Mandarin Oriental Las Vegas, and The Crystals. It also provides financial highlights for MGM MIRAGE and notes that CityCenter is the largest privately financed project in the United States at 76 acres and 18 million square feet.
Ecolab is the leading global provider of cleaning, sanitizing, pest elimination, and maintenance products and services. It serves customers in over 160 countries across various industries including hospitality, foodservice, healthcare, retail, and industrial markets. Ecolab employs over 21,000 people worldwide and had net sales of $4.2 billion in 2004, an 11% increase from 2003. Ecolab common stock is traded on the New York Stock Exchange under the symbol ECL.
This annual report summarizes Dole's financial performance from 1998-2002. It shows that while revenues have remained relatively steady, income from continuing operations increased substantially in 2002 after declining in 2001. Total shareholders' equity also increased steadily over this period. The report discusses Dole's continued focus on expanding its value-added packaged foods business and improving costs. It highlights new product introductions in fruit bowls and salad blends that have contributed to revenue growth. Messages from the Chairman and President emphasize their commitment to improving health and nutrition worldwide through Dole's products and the new Dole Nutrition Institute.
Ecolab is a leading global provider of cleaning, sanitizing, maintenance and repair products and services. It serves customers in over 160 countries across various industries such as hospitality, foodservice, healthcare, retail and industrial markets. In 2004, Ecolab reported net sales of $4.2 billion, an 11% increase over 2003. It continues to invest in innovative products and services to help customers improve their operations and protect their reputations.
Group 1 Automotive is a leading automotive retailer that has experienced significant growth since its IPO in 1997. In 2002, Group 1 achieved record financial results for the fifth consecutive year, with revenues increasing 5.5% to $4.2 billion and net income growing 21% to $67.1 million. The company attributes its success to its diverse business model across brands, geographies, and revenue streams. Group 1 aims to continue its acquisition strategy in 2003 to further augment its portfolio and leverage its operating platform.
The Timken Company had a strong year in 2002, delivering improved financial results and positioning itself for future growth through a transformation strategy. A key part of the transformation was the acquisition of The Torrington Company, which closed in early 2003, increasing Timken's sales by 50% and expected to increase earnings per share by at least 10%. In 2002, Timken achieved earnings of $53 million excluding restructuring charges, up from $0.01 in 2001, and its share price increased over 20%. Timken continued to invest in innovation, expanding its product lines and technology centers around the world to better serve customers. The acquisition of Torrington and continued focus on innovation, cost reductions and customer service have established a solid foundation
The document is the 2002 annual report for The Timken Company. It discusses how the company's ongoing transformation has positioned it for strong future growth and profitability. In 2002, the company delivered improved financial results including net income of $53.3 million, excluding restructuring charges. It also completed a major acquisition of The Torrington Company in early 2003, significantly increasing the company's size and expected to boost earnings per share by at least 10%. The acquisition supports the company's transformation into a global leader in tapered roller bearings, needle roller bearings, and alloy steels.
- Alltel Corporation completed the spin-off of its wireline business and merger with Valor Communications in July 2006, forming Windstream Corporation.
- Alltel agreed to divest certain wireless operations in Minnesota and from the Western Wireless acquisition to comply with regulatory approvals.
- For the third quarter of 2007, Alltel reported service revenues of $2.07 billion, operating income of $433.9 million, and net income of $282.6 million.
Holly Corporation is an independent petroleum refiner that produces gasoline, diesel fuel, and jet fuel. It owns two refineries - the Navajo Refinery in New Mexico with a capacity of 60,000 barrels per day, and the Montana Refinery near Great Falls, Montana with a capacity of 7,000 barrels per day. These refineries process high sulfur crude oils and serve markets in the southwestern U.S., northern Mexico, and Montana. In fiscal year 2001, Holly Corporation achieved record levels of revenue, earnings, and cash flow due to high industry margins and initiatives to improve efficiency and expand marketing efforts.
The document summarizes the company's annual report for 2001. It discusses how the company transformed its operations to create more value for customers and shareholders during a difficult economic period. Key points of the transformation included strengthening core businesses, driving lean manufacturing, forming new partnerships, introducing new products and services, and developing new skills. The summary also highlights challenges faced like reduced sales and losses, but notes the company was still able to generate cash flow and reduce debt through aggressive cost-cutting measures.
SYNNEX Corporation is one of the largest IT supply chain services companies in the world. It provides distribution, contract assembly, and logistics management services to IT OEMs and resellers. In fiscal year 2003, SYNNEX generated over $4.1 billion in revenue with net income of $30 million. The company aims to maximize supply chain economics for its clients by building efficient operations and delivering value through transparency and seamless services. Looking ahead, SYNNEX seeks to continue innovating its operations and delivering the highest efficiency in the industry through strategic growth opportunities.
Campbell Soup Company launched a five-year plan in 2001 to transform the company. In 2002, the first year of the plan, Campbell began implementing initiatives to revitalize its core U.S. Soup business, strengthen its broader portfolio, build new growth avenues, drive quality and productivity improvements, and improve organizational excellence. While investments reduced net earnings, Campbell made progress in nearly every part of the company and expects benefits to increase in future years as the transformation plan continues.
- Cummins has doubled revenue over the past 5 years and achieved the highest 3-year period of net earnings as a percent of sales in over 40 years.
- The company has diversified globally and by end markets to reduce cyclicality, aggressively pursued low cost leadership, and built greater earnings stability.
- Cummins is investing in new engine platforms and technologies to capitalize on growth opportunities from evolving global emission standards.
The document summarizes the annual report of The Timken Company for 2001. It discusses how the company transformed its manufacturing operations to reduce costs and form new affiliations while introducing new products and services. While sales declined from $2.6 billion to $2.4 billion due to a weakened global economy, the company aggressively worked to stem losses. The net loss was $41.7 million including special charges. The company focused on reducing debt, costs, and inventory while generating over $100 million in free cash flow. Looking ahead, the company aims to continue its transformation priorities and strengthen performance as the economic recovery progresses.
United Health Group [PDF Document] UnitedHealth Group Financial Reviewfinance3
This document provides an overview of UnitedHealth Group's financial performance in 2004. Key points include:
- Revenues increased 29% to $37.2 billion, driven by acquisitions as well as 8% organic revenue growth.
- Net earnings increased 42% to $2.6 billion and operating cash flows grew 38% to $4.1 billion.
- The medical care ratio improved slightly to 80.6% due to premium rate increases slightly outpacing medical cost growth.
- Earnings from operations grew 40% to over $4.1 billion, with all business segments showing growth.
1) Constellation Brands is a leading producer and marketer of beverage alcohol brands in North America and the UK.
2) In 2002, Constellation Brands reported gross sales of $3.6 billion, net sales of $2.8 billion, operating income of $342 million, and net income of $136 million.
3) As the second largest supplier of wine, beer, and distilled spirits in the US, Constellation Brands has a broad portfolio of brands that provides opportunities to satisfy consumer preferences across multiple categories of beverage alcohol.
Constellation Brands had strong financial performance in fiscal year 2003. Net sales increased 5% to $2.7 billion and net income grew 22% to $192 million. Earnings per share also increased 16% to $2.07. The company has a broad portfolio of over 200 wine, beer, and spirits brands that makes it unique among global beverage alcohol companies. Its acquisition of BRL Hardy in 2003 is expected to further accelerate sales and earnings growth going forward.
Constellation Brands experienced strong growth in fiscal year 2004. Net sales increased 30% to $3.5 billion and net income grew 39% to $266 million. Operating profit margins improved by 80 basis points. The acquisition of BRL Hardy expanded Constellation's portfolio of wines, particularly Australian wines, and strengthened its global distribution network. Constellation reorganized its global wine operations into six regional companies to better leverage its broader portfolio and drive financial results.
Constellation Brands is a leading international producer and marketer of beverage alcohol brands across wine, spirits, and imported beer. In FY2005, Constellation Brands achieved record sales, net income, earnings per share and other financial metrics. Net sales surpassed $4 billion for the first time, representing a 15% increase over the prior year. Net income grew 25% compared to the prior year. The last three quarters of FY2005 each exceeded $1 billion in net sales. The company's strategy focuses on using its broad product portfolio, geographic diversity, and operational scale to deliver long-term value and growth for shareholders.
Constellation Brands is a leading international marketer of beverage alcohol brands with a broad portfolio across wine, spirits and imported beer categories. It has a portfolio of more than 200 well-known and iconic brands. It has 10,000 employees located across various locations globally including its corporate offices near Rochester, New York. It leverages innovation, dedication, insight and vision to strengthen its brands and business through product development, partnerships, consumer insights and strategic focus.
Constellation Brands had a dynamic fiscal 2007 with strategic changes including acquiring Vincor, forming a joint venture with Grupo Modelo, and announcing the acquisition of SVEDKA vodka. While most business segments performed as expected, growth in the UK was slowed by an Australian wine surplus. Constellation revised its long-term organic growth targets due to changes in accounting and potential higher interest and tax rates. The company believes opportunities remain to create shareholder value through efficiency gains, product development, infrastructure investment, and small acquisitions.
Constellation Brands has cultivated its business over 63 years, evolving into one of the world's leading producers and marketers of beverage alcohol. In fiscal 2008, Constellation enhanced its portfolio focus on higher-growth premium categories through acquisitions like SVEDKA vodka and the Clos du Bois wine portfolio. Constellation also realigned business units and sold lower-margin brands to improve its competitive position and financial performance.
Expeditors International of Washington, Inc. announced a 20% increase in their semi-annual cash dividend from $0.10 per share to $0.12 per share. The increased dividend will be payable on June 17, 2002 to shareholders of record as of June 3, 2002. Expeditors is a global logistics company headquartered in Seattle, Washington that employs professionals in 167 offices worldwide to provide freight forwarding, customs clearance, and other international logistics services.
Expeditors International of Washington, Inc. announced a 38% increase in their semi-annual cash dividend from $0.08 per share to $0.11 per share. The increased dividend will be payable on June 15, 2004 to shareholders of record as of June 1, 2004. Expeditors is a global logistics company headquartered in Seattle, Washington that employs trained professionals in offices and international service centers around the world to provide freight forwarding, customs clearance, and other value added logistics services.
Expeditors International of Washington, Inc. announced a semi-annual cash dividend of $0.11 per share payable on December 15, 2004 to shareholders of record as of December 1, 2004. Expeditors is a global logistics company headquartered in Seattle, Washington that employs trained professionals in 170 offices and 12 international service centers located on six continents linked through an integrated information management system to provide air and ocean freight forwarding, vendor consolidation, customs clearance, marine insurance, distribution and other value added international logistics services.
Expeditors International of Washington, Inc. announced a 36% increase in their semi-annual cash dividend from $0.11 per share to $0.15 per share. The increased dividend will be payable on June 15, 2005 to shareholders of record as of June 1, 2005. Expeditors is a global logistics company headquartered in Seattle, Washington that employs trained professionals in 159 offices worldwide to provide freight forwarding, customs clearance, and other international logistics services.
Expeditors International of Washington, Inc. announced a 46% increase in their semi-annual cash dividend from $0.15 per share to $0.22 per share. The increased dividend will be payable on June 15, 2006 to shareholders of record as of June 1, 2006. Expeditors is a global logistics company headquartered in Seattle, Washington that employs trained professionals in offices worldwide to provide freight forwarding, customs clearance, and other international logistics services.
Glenn M. Alger, President and Chief Operating Officer of Expeditors International of Washington, Inc., a global logistics company, announced his plans to retire in 2007 after 25 years with the company. Alger expressed pride in helping grow Expeditors from 20 employees to over 11,000 worldwide. Peter J. Rose, Chairman and CEO, thanked Alger for his dedication and integral role in the company's success, though noted regional presidents and other leaders are prepared to continue Expeditors' operations and standards without disruption.
Expeditors International of Washington, Inc. announced a 27% increase in their semi-annual cash dividend from $0.11 per share to $0.14 per share. The increased dividend will be payable on June 15, 2007 to shareholders of record as of June 1, 2007. Expeditors is a global logistics company headquartered in Seattle, Washington with over 172 offices worldwide providing freight forwarding, customs clearance, and other international logistics services.
Expeditors International has been named as a defendant along with seven other global logistics companies in a federal antitrust class action lawsuit filed in New York. The lawsuit alleges that the defendants engaged in anti-competitive practices. Expeditors believes the allegations have no merit and will vigorously defend itself against the claims.
Expeditors International of Washington, Inc. appoints Bradley S. Powell as their new Chief Financial Officer. Powell has over 20 years of finance experience including roles as CFO at two other publicly-traded companies. Expeditors' President and COO Jordan Gates says Powell was the right person for the role given his demonstrated experience and attitude. Powell will start on October 1st and focus on training in Expeditors' operations and financial departments to understand their business practices and culture.
The Board of Directors of Expeditors International of Washington, Inc. voted to modify the company's Equal Employment Opportunity (EEO) policy statement to expressly include the words "sexual orientation". This change was in response to a shareholder proposal requesting this modification in the company's proxy statement for the last three years. After reviewing voting results from their most recent proxy statement in light of a recent bylaw change, the Board determined the proposal had passed and unanimously approved the requested change to the EEO statement.
Expeditors International of Washington, 1st97qerfinance39
The document summarizes Expeditors International's financial results for the first quarter of 1997. Net earnings increased 48% to $5.6 million compared to $3.8 million in the first quarter of 1996. Net revenues increased 42% to $57.7 million. Operating income rose 55% to $8.6 million. Same store net revenues and operating income increased 30% and 50% respectively.
Expeditors International of Washington, 05/14/97divfinance39
Expeditors International announced a 25% increase in their semi-annual cash dividend to $0.05 per share. For the first quarter of 1997, the company's net earnings increased 48% compared to the previous year and net earnings per share increased 47%. Expeditors is a global logistics company headquartered in Seattle that saw revenues of $730 million and net earnings of $24 million for the year 1996.
Expeditors International of Washington, 2nd97qerfinance39
Expeditors International of Washington, Inc. announced record financial results for the second quarter and first half of 1997, with significant increases in key metrics compared to the same periods in 1996. Net earnings increased 52% for the quarter and 50% year-to-date, driven by 45% and 43% increases in net revenues, respectively. The company opened new offices in Ireland and India during the quarter and saw continued growth across all business segments and regions. Chairman and CEO Peter Rose attributed the strong results to the company's global network and ability to gain market share while maintaining profitability and cost control.
Storytelling is an incredibly valuable tool to share data and information. To get the most impact from stories there are a number of key ingredients. These are based on science and human nature. Using these elements in a story you can deliver information impactfully, ensure action and drive change.
Part 2 Deep Dive: Navigating the 2024 Slowdownjeffkluth1
Introduction
The global retail industry has weathered numerous storms, with the financial crisis of 2008 serving as a poignant reminder of the sector's resilience and adaptability. However, as we navigate the complex landscape of 2024, retailers face a unique set of challenges that demand innovative strategies and a fundamental shift in mindset. This white paper contrasts the impact of the 2008 recession on the retail sector with the current headwinds retailers are grappling with, while offering a comprehensive roadmap for success in this new paradigm.
B2B payments are rapidly changing. Find out the 5 key questions you need to be asking yourself to be sure you are mastering B2B payments today. Learn more at www.BlueSnap.com.
How MJ Global Leads the Packaging Industry.pdfMJ Global
MJ Global's success in staying ahead of the curve in the packaging industry is a testament to its dedication to innovation, sustainability, and customer-centricity. By embracing technological advancements, leading in eco-friendly solutions, collaborating with industry leaders, and adapting to evolving consumer preferences, MJ Global continues to set new standards in the packaging sector.
Structural Design Process: Step-by-Step Guide for BuildingsChandresh Chudasama
The structural design process is explained: Follow our step-by-step guide to understand building design intricacies and ensure structural integrity. Learn how to build wonderful buildings with the help of our detailed information. Learn how to create structures with durability and reliability and also gain insights on ways of managing structures.
Recruiting in the Digital Age: A Social Media MasterclassLuanWise
In this masterclass, presented at the Global HR Summit on 5th June 2024, Luan Wise explored the essential features of social media platforms that support talent acquisition, including LinkedIn, Facebook, Instagram, X (formerly Twitter) and TikTok.
Unveiling the Dynamic Personalities, Key Dates, and Horoscope Insights: Gemin...my Pandit
Explore the fascinating world of the Gemini Zodiac Sign. Discover the unique personality traits, key dates, and horoscope insights of Gemini individuals. Learn how their sociable, communicative nature and boundless curiosity make them the dynamic explorers of the zodiac. Dive into the duality of the Gemini sign and understand their intellectual and adventurous spirit.
3 Simple Steps To Buy Verified Payoneer Account In 2024SEOSMMEARTH
Buy Verified Payoneer Account: Quick and Secure Way to Receive Payments
Buy Verified Payoneer Account With 100% secure documents, [ USA, UK, CA ]. Are you looking for a reliable and safe way to receive payments online? Then you need buy verified Payoneer account ! Payoneer is a global payment platform that allows businesses and individuals to send and receive money in over 200 countries.
If You Want To More Information just Contact Now:
Skype: SEOSMMEARTH
Telegram: @seosmmearth
Gmail: seosmmearth@gmail.com
Company Valuation webinar series - Tuesday, 4 June 2024FelixPerez547899
This session provided an update as to the latest valuation data in the UK and then delved into a discussion on the upcoming election and the impacts on valuation. We finished, as always with a Q&A
Event Report - SAP Sapphire 2024 Orlando - lots of innovation and old challengesHolger Mueller
Holger Mueller of Constellation Research shares his key takeaways from SAP's Sapphire confernece, held in Orlando, June 3rd till 5th 2024, in the Orange Convention Center.
Understanding User Needs and Satisfying ThemAggregage
https://www.productmanagementtoday.com/frs/26903918/understanding-user-needs-and-satisfying-them
We know we want to create products which our customers find to be valuable. Whether we label it as customer-centric or product-led depends on how long we've been doing product management. There are three challenges we face when doing this. The obvious challenge is figuring out what our users need; the non-obvious challenges are in creating a shared understanding of those needs and in sensing if what we're doing is meeting those needs.
In this webinar, we won't focus on the research methods for discovering user-needs. We will focus on synthesis of the needs we discover, communication and alignment tools, and how we operationalize addressing those needs.
Industry expert Scott Sehlhorst will:
• Introduce a taxonomy for user goals with real world examples
• Present the Onion Diagram, a tool for contextualizing task-level goals
• Illustrate how customer journey maps capture activity-level and task-level goals
• Demonstrate the best approach to selection and prioritization of user-goals to address
• Highlight the crucial benchmarks, observable changes, in ensuring fulfillment of customer needs
At Techbox Square, in Singapore, we're not just creative web designers and developers, we're the driving force behind your brand identity. Contact us today.
The 10 Most Influential Leaders Guiding Corporate Evolution, 2024.pdfthesiliconleaders
In the recent edition, The 10 Most Influential Leaders Guiding Corporate Evolution, 2024, The Silicon Leaders magazine gladly features Dejan Štancer, President of the Global Chamber of Business Leaders (GCBL), along with other leaders.
The 10 Most Influential Leaders Guiding Corporate Evolution, 2024.pdf
Timken2006AnnualReport
1. C h a rt i n g t h e C o u r s e f o r
P r o f i ta b l e G r o w t h
2006 A n n ua l Re p o rt
2. Our Vision
Our sights are set
on profitable growth.
We are dedicated
As we take actions to
to improving our customers' performance
transform the company,
by applying our knowledge
we are targeting growth
of friction management and power transmission
in specific industrial
to deliver unparalleled value and innovation
markets and reducing
the cyclicality of our all around the world.
business. The course
we are charting will
O u r C o r e Va l u e s
create value for both
Ethics & Integrity
our customers and
Quality
shareholders.
Innovation
Independence
Contents 2 Letter To Shareholders 6 Feature 14 Directors 16 Officers & Executives 17 Form 10-K
3. F i n a n c i a l S u m m a ry
2006 2005
(Dollars in thousands, except per share data)
$ 4,973,365
Net sales $ 4,823,167
176,439
Income from continuing operations 233,656
46,088
Income from discontinued operations* 26,625
$ 222,527
Net income $ 260,281
$ 2.36
Net income per share – diluted $ 2.81
$ .62
Dividends per share $ .60
* iscontinued operations reflects the December 8, 2006 sale of Latrobe Steel Company. Income from discontinued
D
operations includes the gain on the sale and income from Latrobe operations for periods prior to the sale. Net sales
exclude Latrobe Steel for all periods.
Net Income
Per Share- Dividends
Net Sales
Diluted Per Share
($ Billions)
$2.81
$.62
$5.0
$.60
$4.8
$4.3
$2.36
$.52
$.52
$.52
$3.6
$1.49
$2.4
$.62
$.44
02 03 04 05 06
02 03 04 05 06 02 03 04 05 06
1
4. To O u r S h a r e h o l d e r s
In 2006, we embarked on one of the most sweeping series of
changes in the history of The Timken Company. The path we have
charted is intended to improve the creation and delivery of both
customer and shareholder value – and enhance our leadership
position in selected market spaces. With the assistance of strong
markets and dedicated associates, we have made meaningful
progress in transforming our company and value proposition.
We delivered a strong financial performance
in 2006, despite rapidly declining demand
from North American automotive customers.
We entered 2007 better positioned to grow
and to consistently achieve stronger
profits.
James W. Griffith,
President and
Chief Executive Officer, left,
and Ward J. Timken, Jr.,
Chairman
2
5. In 2006, we set a number of performance records and improved our balance sheet.
• Net sales reached $5 billion, reflecting continued high demand in energy, aerospace,
heavy industrial and aftermarket sectors.
• Net income per diluted share was $2.36, among the highest in Timken’s 107-year history.
Supporting this result was exceptional performance in our steel business with record
sales, profits and productivity.
• Our actions strengthened the balance sheet significantly, with the net debt-to-capital ratio
dropping to 25.2 percent, down from 30.5 percent. We improved leverage even with
significant capital expenditures to support our growth initiatives and contributions of
$243 million to fund our domestic pension plans.
• Across the company, we made major changes in our portfolio, growing in focused areas,
exiting non-strategic businesses and restructuring to improve effectiveness.
• Around the world, Timken employees rededicated themselves to improving execution,
achieving record levels of safety performance and making significant advances in
customer service.
Timken is becoming a better company. We have a more balanced portfolio, and we are
better positioned to proceed with the next step in our transformation. We are moving forward
confidently, focused on increasing shareholder value by strengthening our leadership in chosen
markets.
Investing in growth
Our growth efforts are focused in Asia and in specific markets where we have a
demonstrated ability to create customer value and, therefore, expand profitably. These include
investments in our core businesses and in extending the Timken brand into new markets
where we can leverage our capabilities to improve customers’ performance.
We added manufacturing capacity in the aerospace and heavy industry segments of our
business, with the most comprehensive program of new plant investments in our history. We
expanded bearing capacity at five North American and European sites, opened a new spherical
bearing facility in China and broke ground on three more Asian facilities. We expect these
investments to position us for leadership in these markets.
More than capacity, we are building additional capabilities in our aerospace business,
which is growing at a compound annual rate exceeding 25 percent. We completed two small
acquisitions and opened a new Aftermarket Solutions headquarters in Mesa, Arizona, as we
strive to better serve customers over the lifecycle of our products. We expect to continue to
look for acquisitions that create value for customers and shareholders.
In Asia, our presence continues to grow. In addition to manufacturing facilities, we have
opened new distribution facilities, sales offices and training centers across the region. We
ended the year with 4,400 associates in Asia, nearly 18 percent of our worldwide total and up
25 percent from the prior year.
3
6. Improving Our Portfolio
In 2006, we made a concerted effort to improve our corporate portfolio, shifting our
emphasis to segments where we can provide differentiated value for our customers. We
divested businesses with sales totaling $482 million, freeing management attention and
financial resources to pursue important strategic initiatives.
By selling our Latrobe Steel subsidiary in December and our European precision steel
components business earlier in the year, we exited segments where we have been unable
to achieve consistent levels of profitability. This allows us to focus our steel investments
in places where we can provide differentiated capabilities. We also divested our automo-
tive steering business in December, as part of the automotive structural changes aimed at
focusing in areas where we can be rewarded for customer value creation. We thank our
associates in those businesses for their efforts over the years and wish them well with their
new companies.
We made solid progress on restructuring activities across the corporation, as we transform
ourselves to be more effective and more consistently profitable.
• In our automotive business, we are on track to achieve $40 million in savings by 2008 through
our restructuring program, with closures complete at two facilities and closure or downsizing
under way at three more facilities. An additional workforce reduction program begun in 2006
is on target to deliver $35 million more in savings by 2008. Actions taken in 2006 reduced
Automotive Group employment by approximately 16 percent.
• In our steel business, in addition to the divestitures previously described, we announced plans
to exit steel tube manufacturing in the United Kingdom.
• In our industrial business, we have continued to benefit from strong market demand, which
has slowed our efforts to rationalize our Canton, Ohio, bearing facilities as we respond to this
favorable market dynamic.
These actions are critical steps in improving the ongoing profitability of the company.
Increasing Differentiation
Across the company, we are investing significantly in the capability to create unique value
for our customers:
• Steel investments will increase the size range of our engineered alloy forging bar to the
widest range in the industry – from one inch to 15 inches. We also expanded our capability
for specialized heat-treating and extended our range of precision steel components.
• In our automotive business, we launched new value-added applications worth more than
$170 million, while exiting other applications that were not profitable.
• We extended the range of our industrial aftermarket products and services, adding a new
line of large bore seals and multipoint lubricators.
Improving Capabilities
Beyond our investments to leverage specific market opportunities are a series of initiatives
that are all aimed at constructing a foundation for the company’s future. Technology is the
lifeblood of Timken, and we spend nearly $60 million annually for research and development in
areas where we can create real value.
4
7. Of more immediate impact is Project O.N.E. (Our New Enterprise), an initiative aimed at
redefining how business will be conducted in the future – and employing an IT infrastructure
that better supports our business systems. We completed a pilot launch in our Canadian
operations in July 2006 and plan to complete our first major U.S. implementation in 2007.
During 2006, we added valuable expertise to the governance of the company. John P. Reilly
was elected to Timken’s board in July and brings extensive experience in both industrial and
automotive sectors. We welcome him and value his counsel.
Boldly Moving Forward
The pace of change at Timken is intense. Our investments in new capacity, growth
opportunities and restructuring initiatives, when combined with the fall in demand from
North American automakers, had an impact on our 2006 financial results. Taking the longer-
term view, we believe we made the right choices for redefining Timken to provide better
prospects for growth and consistent profitability.
The considerable equity we have built in the Timken brand continues to differentiate us
from our competitors. We are leveraging the strength of our brand to grow the business, both
organically and through acquisitions. We believe Timken is well-positioned for the challenges
ahead. The course we have charted is shaped by an unyielding commitment to managing
for value creation. It is a transformational course that we believe will lead to a stronger focus
on industrial markets, a more global presence and to unprecedented levels of sustainable and
profitable growth.
We thank you for your continued confidence and investment in The Timken Company, and
we look forward to crossing new territory together in 2007.
Ward J. Timken, Jr. James W. Griffith
Chairman President and Chief Executive Officer March 1, 2007
1899 1940 1950 1960 1970 1980 1990 2006
2000
$59 $144 $245 $389 $1,223 $1,582 $4,973
$2,438
Net Sales*
(Dollars in Millions)
As Timken continues to
grow, the course we have
charted is shaped by an
unyielding commitment
to managing for value
creation.
* Excludes sales from
discontinued operations.
5
8. C h a rt i n g
Solutions
Air Logistics operates a fleet of more than 170 helicopters from air bases
along the Gulf of Mexico and in Alaska, providing flight services to the oil
and gas industry. “Whether we’re flying large crew changes from offshore
platforms, or supporting day-to-day operation of the Trans Alaska Pipeline
System, our aircraft must be ready to go whenever and wherever our customers
need to fly,” says Doug Forslund, general manager.
Air Logistics relies on the components and services provided by Timken’s
Aftermarket Solutions unit to keep its operations running smoothly. For
example, a helicopter gear that Timken developed specifically for Air Logistics
uses proprietary casting and coating technology to improve wear and
fatigue resistance. “Timken provides the things that are important to me in
a supplier: quality products and services, supported by strong engineering
and technology, and the flexibility to react and change with the market,” says
Forslund.
Additionally, Timken’s 2006 acquisition of Turbo Engines, a leading provider
of engine overhaul and repair services, has expanded services for aftermar-
ket customers like Air Logistics. “We’re unique in our ability to be a single
source supplier for a broad range of aftermarket products and services,” says
Barry Stonehouse, general manager, Timken Aftermarket Solutions. “We
rework engines and transmissions, and we also have the ability to engineer,
manufacture and refurbish gears, bearings and other components to improve
performance. Basically, we help keep our customers flying.”
6
10. Tra c k i n g
critical needs
Timken is helping to meet the global demand for energy through critical
products and services used for wind turbines, drilling equipment, mining
trucks, draglines, cable shovels, continuous mining equipment, coal crushers,
conveyors and other heavy equipment. In 2006, energy-related applications
accounted for approximately 10 percent of Timken’s industrial product
sales and 20 percent of steel sales. We expect even more penetration in this
market as energy needs grow.
Wind energy currently generates less than 1 percent of the world’s
electricity. By 2015, it is expected to generate 3 percent. Timken is currently
working on 20 wind energy projects in six countries with leading manufac-
turers of wind turbines and transmissions. We are engineering specific
solutions for customized gearboxes, focused especially on the performance
and reliability of multi-megawatt wind turbines that will be critical to the
future growth of wind energy.
As a leading bearing supplier for mining operations, we continue to expand
our reach. In 2006, one of China’s largest manufacturers of underground
mining machinery, Jixi Coal Mine Machinery Company, turned to Timken to
increase equipment reliability. Timken engineers advised a bearing change,
8
11. design modifications and bearing maintenance programs for the electric
haulage shearers that cut into the earth and extract coal. As a result of these
improvements, mine operators are experiencing less downtime and Timken
earned substantial new business.
In the German Rhineland, one of the largest electricity producers in
Europe, RWE Power, relies on Timken products to help transport lignite ore
within mine operations. Under a five-year supply agreement signed in 2006,
Timken will be providing about 30 percent of the bearings needed for mine
conveyor operations in Germany.
In 2006, sales of Timken steel for oil and gas drilling grew nearly 25 per-
cent, helped by rising export sales for drilling applications in new markets,
including China. Julong PetroMaterials, one of the largest manufacturers and
distributors of drilling equipment for China’s energy market, turned to Timken
in 2006 for help in developing a higher-performing yet cost-effective drill
collar – the heavy tubular connector between a drill pipe and a drill bit.
Timken has one of the few mills that can produce the long, heavy-walled tubes
needed in such applications, and we are leveraging this and other differentiated
capabilities to increase our participation in the energy market.
9
12. Positioning
Fo r G r o w t h
China, India and Southeast Asia are expected to continue their rapid
economic growth through the next decade. That means within the next 10
years, Asian markets will be consuming nearly half of the world’s supply of
bearings. They also will provide additional opportunities for Timken steel
products, which are sold in China for demanding applications such as oil
exploration. Timken sales in Asia increased 16 percent in 2006, and Timken is
investing aggressively in this region to drive future growth.
Customer-focused teams are key to firmly establishing the Timken brand
in Asia. At the new engineering training center in Wuxi, China, our sales,
application and service engineers go through a rigorous program of instruc-
tion on Timken products and technologies. As a result, they are able to win
new business by matching innovative products and technical solutions with
the needs of a growing base of Chinese customers. In 2006, our business
in China grew in a number of segments, including mining, heavy industries,
energy and aerospace. As relationships grow, Timken expects to increase
market share in this region as it does throughout the world – by applying
its extensive knowledge of friction management and power transmission to
solutions that improve customers’ performance.
10
14. Ta r g e t i n g
O p p o rt u n i t i e s
As engines and transmissions become more powerful and fuel-efficient,
Timken is seizing opportunities for profitable growth through differenti-
ated products. We are working with Daido Steel Company, a major supplier
to Japanese automakers, in expanding our steel rolling mill operations to
produce small steel bars, down to one-inch diameter, for a variety of
customers, including automotive transplant customers. One advantage of
these smaller steel bars is the ability to forge them into near-net shaped
components, thus reducing machining costs. Their premium quality also
helps in designing components with longer life and increased reliability.
As a result of this project, with its cost efficiencies and Timken’s advanced
“clean steel” technologies, we intend to lead North American production of
competitively priced, special bar-quality steels in this size range.
Beyond high-performance automotive small bar applications, Timken’s
differentiated steel products are able to meet demanding requirements in
energy and industrial markets. In 2006, we began two projects focused
on high-performance applications in these markets. The first increased the
capacity and efficiency of heat-treating operations, which has resulted in
new business. The second expanded our product range to take advantage
of attractive growth markets in the energy and industrial sectors. This
project increased our rolled carbon and alloy steel round bar capabilities to
a maximum diameter of 15 inches, making Timken the only U.S. manufacturer
capable of rolling these large high-quality bars to a length of up to 26 feet.
With these expanded capabilities, Timken steel products are ideally suited for
many high-performance applications.
12
16. Board of Directors
Ward J. Timken, Jr. Jacqueline F. Woods Frank C. Sullivan John M. Timken, Jr.
Director since 2002 Director since 2000 (C, N) Director since 2003 (A, F) Director since 1986 (A, F)
Chairman – Retired President President and Private Investor
Board of Directors SBC / AT&T Chief Executive Officer
The Timken Company RPM International Inc.
James W. Griffith John A. Luke, Jr. Jerry J. Jasinowski
Director since 1999 Director since 1999 (C, N) Director since 2004 (C, N)
President and Chairman and Retired President and
Chief Executive Officer Chief Executive Officer Chief Executive Officer
The Timken Company MeadWestvaco National Association of
Manufacturers and
Retired President
The Manufacturing
Institute
14
17. (A) Member of Audit Committee
(C) Member of Compensation
Committee
(F) Member of Finance Committee
(N) Member of Nominating
and Corporate Governance
Committee
Phillip R. Cox Robert W. Mahoney Ward J. Timken
Director since 2004 (A, C, F) Director since 1992 (A, N) Director since 1971
President and Chief Chairman Emeritus President
Executive Officer Diebold, Incorporated Timken Foundation
Cox Financial Corporation
Joseph W. Ralston
Joseph F. Toot, Jr. John P. Reilly
Director since 2003 (C, N)
Director since 1968 (F, N) Director since 2006 (A, C)
Vice Chairman
Retired President and Chairman
The Cohen Group
Chief Executive Officer Exide Technologies
The Timken Company
15
18. Officers and Executives
Ward J. Timken, Jr.* Automotive Group
Chairman – Board of Directors
Jacqueline A. Dedo*
James W. Griffith* President – Automotive Group
President and Chief Executive Officer
Charles M. Byrnes, Jr.
Glenn A. Eisenberg* Vice President – Automotive – Americas
Executive Vice President –
H. Roger Ellis
Finance and Administration
Vice President – Operations
Jerry C. Begue
Kenneth L. Hopkins
Managing Director – Europe
Vice President – Automotive – Europe
William R. Burkhart*
Peter M. Sproson
Senior Vice President and General Counsel
Vice President – Automotive Business
Christopher A. Coughlin Development
Senior Vice President – Project O.N.E.
Marc A. Weston
Alastair R. Deane* Vice President – Automotive – Asia
Senior Vice President – Technology
Industrial Group
Donna J. Demerling
Senior Vice President – Quality Michael C. Arnold*
and Lean Six Sigma President – Industrial Group
Jon T. Elsasser Michael J. Connors
Senior Vice President Vice President – Industrial Equipment
and Chief Information Officer
Thomas O. Dwyer
Philip D. Fracassa Vice President – Off-Highway
Senior Vice President – Tax and Treasury
Mathew W. Happach
Michael J. Hill Vice President – Rail
Senior Vice President – Supply Chain
Richard G. Kyle
Management
Vice President – Manufacturing – Industrial
Robert J. Lapp
J. Ron Menning
Vice President – Government Affairs
Vice President – Aerospace, Consumer
Roger W. Lindsay and Super Precision
Senior Vice President – Asia Pacific
Daniel E. Muller
J. Ted Mihaila* Vice President – Distribution
Senior Vice President and Controller Management
Debra L. Miller
Steel Group
Senior Vice President – Communications
and Community Affairs
Salvatore J. Miraglia, Jr.*
Mark J. Samolczyk President – Steel Group
Senior Vice President – Corporate Planning
Robert N. Keeler
and Development
Vice President – Sales – Steel
Scott A. Scherff
Cengiz S. Kurkcu
Corporate Secretary
Vice President – Steel Business
and Assistant General Counsel
Development and President – Precision
John C. Skurek Steel Components
Vice President – Treasury
Thomas D. Moline
Dennis R. Vernier Vice President – Steel Manufacturing
Vice President – Auditing
Donald L. Walker
Senior Vice President – Human Resources *Required to file reports under Section 16 of the
and Organizational Advancement Securities Exchange Act of 1934.
16
19. UNITED STATES
SECURITIES AND EXCHANGE COMMISSION
WASHINGTON, D.C. 20549
FORM 10-K
x ANNUAL REPORT PURSUANT TO SECTION 13 OR 15(d) OF THE SECURITIES EXCHANGE ACT OF 1934
For the fiscal year ended December 31, 2006
OR
TRANSITION REPORT PURSUANT TO SECTION 13 OR 15(d) OF THE
SECURITIES EXCHANGE ACT OF 1934
For the transition period from ____________ to ____________
Commission file number: 1-1169
THE TIMKEN COMPANY
(Exact name of registrant as specified in its charter)
Ohio 34-0577130
(State or other jurisdiction of (I.R.S. Employer
incorporation or organization) Identification No.)
1835 Dueber Avenue, S.W., Canton, Ohio 44706
(Address of principal executive offices) (Zip Code)
(330) 438-3000
(Registrant’s telephone number, including area code)
Securities registered pursuant to Section 12(b) of the Act:
Title of each class Name of each exchange on which registered
Common Stock, without par value New York Stock Exchange
Securities registered pursuant to Section 12(g) of the Act: None
Indicate by check mark if the registrant is a well-known seasoned issuer, as defined in Rule 405 of the Securities Act.
YES x NO
Indicate by check mark if the registrant is not required to file reports pursuant to Section 13 or Section 15(d) of the Exchange Act.
NO x
YES
Indicate by check mark whether the registrant (1) has filed all reports required to be filed by Section 13 or 15(d) of the Securities
Exchange Act of 1934 during the preceding 12 months (or for such shorter period that the registrant was required to file such reports),
and (2) has been subject to such filing requirements for the past 90 days.
YES x NO
Indicate by check mark if disclosure of delinquent filers pursuant to Item 405 of Regulation S-K is not contained herein, and will not be
contained, to the best of registrant's knowledge, in definitive proxy or information statements incorporated by reference in Part III of
this Form 10-K or any amendment to this Form 10-K.
Indicate by check mark whether the registrant is a large accelerated filer, an accelerated filer, or a non-accelerated filer. See definition of
“accelerated filer and large accelerated filer” in Rule 12b-2 of the Exchange Act.
Large accelerated filer x Accelerated filer Non-accelerated filer
Indicate by check mark whether the registrant is a shell company (as defined in Rule 12b-2 of the Exchange Act).
No x
Yes
As of June 30, 2006, the aggregate market value of the registrant’s common shares held by non-affiliates of the registrant was
$2,836,362,258 based on the closing sale price as reported on the New York Stock Exchange.
Indicate the number of shares outstanding of each of the issuer’s classes of common stock, as of the latest practicable date.
Class Outstanding at January 31, 2007
Common Shares, without par value 94,174,971 shares
DOCUMENTS INCORPORATED BY REFERENCE
Document Parts Into Which Incorporated
Proxy Statement for the Annual Meeting of Shareholders Part III
to be held May 1, 2007 (Proxy Statement)
20. The Timken Company
Index to Form 10-K Report
I. PART I. PAGE
Item 1. Business 1
General 1
Products 1
Geographical Financial Information 2
Industry Segments 3
Sales and Distribution 4
Competition 4
Trade Law Enforcement 5
Joint Ventures 6
Backlog 6
Raw Materials 6
Research 7
Environmental Matters 7
Patents, Trademarks and Licenses 8
Employment 8
Available Information 8
Item 1A. Risk Factors 8
Item 1B. Unresolved Staff Comments 12
Item 2. Properties 13
Item 3. Legal Proceedings 13
Item 4. Submission of Matters to a Vote of Security Holders 13
Item 4A. Executive Officers of the Registrant 14
II. PART II.
Item 5. Market for Registrant’s Common Equity, Related Stockholder Matters and
Issuer Purchases of Equity Securities 15
Item 6. Selected Financial Data 18
Item 7. Management’s Discussion and Analysis of Financial Condition and Results of Operations 19
Item 7A. Quantitative and Qualitative Disclosures about Market Risk 41
Item 8. Financial Statements and Supplementary Data 42
Item 9. Changes in and Disagreements with Accountants on Accounting and Financial Disclosure 73
Item 9A. Controls and Procedures 73
Item 9B. Other Information 75
III. Part III.
Item 10. Directors, Executive Officers and Corporate Governance 75
Item 11. Executive Compensation 75
Item 12. Security Ownership of Certain Beneficial Owners and Management and
Related Stockholder Matters 75
Item 13. Certain Relationships and Related Transactions, and Director Independence 75
Item 14. Principal Accountant Fees and Services 75
IV. Part IV.
Item 15. Exhibits and Financial Statement Schedules 76
T H E T I M K E N C O M PA N Y
21. Part I
Item 1. Business
General
As used herein, the term quot;Timkenquot; or the quot;companyquot; refers to The Timken Company and its subsidiaries unless the context otherwise
requires. Timken, an outgrowth of a business originally founded in 1899, was incorporated under the laws of the state of Ohio in 1904.
Timken is a leading global manufacturer of highly engineered bearings, alloy and specialty steel and related components. The company
is the world's largest manufacturer of tapered roller bearings and alloy seamless mechanical steel tubing and the largest North
American-based bearings manufacturer. Timken had facilities in 26 countries on six continents and employed approximately 25,000
people as of December 31, 2006.
Products
The Timken Company manufactures two basic product lines: anti-friction bearings and steel products. Differentiation in these two
product lines comes in two different ways: (1) differentiation by bearing type or steel type, and (2) differentiation in the applications
of bearings and steel.
Tapered Roller Bearings. In the bearing industry, Timken is best known for the tapered roller bearing, which was originally patented
by the company founder, Henry Timken. The tapered roller bearing is Timken's principal product in the anti-friction industry segment.
It consists of four components: (1) the cone or inner race, (2) the cup or outer race, (3) the tapered rollers, which roll between the cup
and cone, and (4) the cage, which serves as a retainer and maintains proper spacing between the rollers. Timken manufactures or
purchases these four components and then sells them in a wide variety of configurations and sizes.
The tapered rollers permit ready absorption of both radial and axial load combinations. For this reason, tapered roller bearings are
particularly well-adapted to reducing friction where shafts, gears or wheels are used. The uses for tapered roller bearings are diverse
and include applications on passenger cars, light and heavy trucks and trains, as well as a wide variety of industrial applications,
ranging from very small gear drives to bearings over two meters in diameter for wind energy machines. A number of applications
utilize bearings with sensors to measure parameters such as speed, load, temperature or overall bearing condition.
Matching bearings to the specific requirements of customers' applications requires engineering and often sophisticated analytical
techniques. The design of Timken's tapered roller bearing permits distribution of unit pressures over the full length of the roller. This
design, combined with high precision tolerances, proprietary internal geometry and premium quality material, provides Timken
bearings with high load-carrying capacity, excellent friction-reducing qualities and long life.
Precision Cylindrical and Ball Bearings. Timken's aerospace and super precision facilities produce high-performance ball and
cylindrical bearings for ultra high-speed and/or high-accuracy applications in the aerospace, medical and dental, computer and other
industries. These bearings utilize ball and straight rolling elements and are in the super precision end of the general ball and straight
roller bearing product range in the bearing industry. A majority of Timken's aerospace and super precision bearings products are
custom-designed bearings and spindle assemblies. They often involve specialized materials and coatings for use in applications that
subject the bearings to extreme operating conditions of speed and temperature.
Spherical and Cylindrical Bearings. Timken produces spherical and cylindrical roller bearings for large gear drives, rolling mills
and other process industry and infrastructure development applications. Timken's cylindrical and spherical roller bearing capability was
significantly enhanced with the acquisition of Torrington's broad range of spherical and heavy-duty cylindrical roller bearings for
standard industrial and specialized applications. These products are sold worldwide to original equipment manufacturers and industri-
al distributors serving major industries, including construction and mining, natural resources, defense, pulp and paper production,
rolling mills and general industrial goods.
T H E T I M K E N C O M PA N Y 1
22. Products (continued)
Needle Bearings. With the acquisition of the Engineered Solutions business of Ingersoll-Rand Company Limited (referred to as
“Torrington”) in February 2003, the company became a leading global manufacturer of highly engineered needle roller bearings.
Timken produces a broad range of radial and thrust needle roller bearings, as well as bearing assemblies, which are sold to original
equipment manufacturers and industrial distributors worldwide. Major applications include automotive, consumer, construction,
agriculture and general industrial.
Bearing Reconditioning. A small part of the business involves providing bearing reconditioning services for industrial and railroad
customers, both internationally and domestically. These services accounted for less than 5% of the company's net sales for the year
ended December 31, 2006.
Aerospace Aftermarket Products and Services. Through strategic acquisitions and ongoing product development, Timken
continues to expand its portfolio of replacement parts and services for the aerospace aftermarket, where they are used in both civil
and military aircraft. In addition to a wide variety of power transmission and drive train components and modules, Timken supplies
comprehensive maintenance, repair and overhaul services for gas turbine engines, gearboxes and accessory systems in rotary- and
fixed-wing aircraft. Specific parts in addition to bearings include airfoils (such as blades, vanes, rotors and diffusers), nozzles, gears,
and oil coolers. Services range from aerospace bearing repair and component reconditioning to the complete overhaul of engines,
transmissions and fuel controls.
Steel. Steel products include steels of low and intermediate alloy, as well as some carbon grades. These products are available in
a wide range of solid and tubular sections with a variety of lengths and finishes. These steel products are used in a wide array of
applications, including bearings, automotive transmissions, engine crankshafts, oil drilling components, aerospace parts and other
similarly demanding applications.
Timken also produces custom-made steel products, including steel components for automotive and industrial customers. This steel
components business has provided the company with the opportunity to further expand its market for tubing and capture higher value-
added steel sales. It also enables Timken's traditional tubing customers in the automotive and bearing industries to take advantage of
higher-performing components that cost less than current alternative products. Customizing of products is an important portion of the
company's steel business.
United Other
Geographic Financial Information States Europe Countries Consolidated
(Dollars in thousands)
2006
Net sales $ 3,370,244 $ 849,915 $ 753,206 $ 4,973,365
Non-current assets 1,578,856 285,840 266,557 2,131,253
2005
Net sales $ 3,295,171 $ 812,960 $ 715,036 $ 4,823,167
Non-current assets 1,413,575 337,657 177,988 1,929,220
2004
Net sales $ 2,900,749 $ 779,478 $ 606,970 $ 4,287,197
Non-current assets 1,399,155 398,925 221,112 2,019,192
2 T H E T I M K E N C O M PA N Y
23. Industry Segments
The company has three reportable segments: Industrial Group, Automotive Group and Steel Group. Financial information for the
segments is discussed in Note 14 to the Consolidated Financial Statements.
Description of types of products and services from which each reportable segment derives its revenues
The company’s reportable segments are business units that target different industry segments or types of product. Each reportable
segment is managed separately because of the need to specifically address customer needs in these different industries.
The Automotive Group includes sales of bearings and other products and services (other than steel) to automotive original equipment
manufacturers, or OEMs, for passenger cars, trucks and trailers. The Industrial Group includes sales of bearings and other products
and services (other than steel) to a diverse customer base, including industrial equipment, off-highway, rail and aerospace and defense
customers. The Industrial Group also includes aftermarket distribution operations, including automotive applications, for products other
than steel. The company’s bearing products are used in a variety of products and applications, including passenger cars, trucks,
locomotive and railroad cars, machine tools, rolling mills and farm and construction equipment, aircraft, missile guidance systems,
computer peripherals and medical instruments.
The Steel Group includes sales of low and intermediate alloy and carbon grade steel. These are available in a wide range of solid
and tubular sections with a variety of lengths and finishes. The company also manufactures custom-made steel products, including
precision steel components. Approximately 10% of the company’s steel is consumed in its bearing operations. In addition, sales are
made to other anti-friction bearing companies and to the automotive and truck, forging, construction, industrial equipment, oil and gas
drilling and aircraft industries and to steel service centers. In 2006, the company sold its Latrobe Steel subsidiary. This business was
part of the Steel Group for segment reporting purposes. This business has been treated as discontinued operations for all periods
presented.
Measurement of segment profit or loss and segment assets
The company evaluates performance and allocates resources based on return on capital and profitable growth. The primary measure-
ment used by management to measure the financial performance of each segment is adjusted EBIT (earnings before interest and
taxes, excluding special items such as impairment and restructuring charges, rationalization and integration costs, one-time gains or
losses on sales of assets, allocated receipts received or payments made under the Continued Dumping and Subsidy Offset
Act (CDSOA), loss on dissolution of subsidiary, acquisition-related currency exchange gains, and other items similar in nature). The
accounting policies of the reportable segments are the same as those described in the summary of significant accounting policies.
Intersegment sales and transfers are recorded at values based on market prices, which creates intercompany profit on intersegment
sales or transfers that is eliminated in consolidation.
Factors used by management to identify the enterprise’s reportable segments
The company reports net sales by geographic area in a manner that is more reflective of how the company operates its segments,
which is by the destination of net sales. Non-current assets by geographic area are reported by the location of the subsidiary.
Export sales from the U.S. and Canada are less than 10% of revenue. The company's Automotive and Industrial Groups have histor-
ically participated in the global bearing industry, while the Steel Group has concentrated primarily on U.S. customers.
Timken's non-U.S. operations are subject to normal international business risks not generally applicable to domestic business. These
risks include currency fluctuation, changes in tariff restrictions, difficulties in establishing and maintaining relationships with local
distributors and dealers, import and export licensing requirements, difficulties in staffing and managing geographically diverse
operations, and restrictive regulations by foreign governments, including price and exchange controls.
T H E T I M K E N C O M PA N Y 3
24. Sales and Distribution
Timken's products in the Automotive Group and Industrial Group are sold principally by their own internal sales organizations.
A portion of the Industrial Group's sales are made through authorized distributors.
Traditionally, a main focus of the company's sales strategy has consisted of collaborative projects with customers. For this reason,
the company's sales forces are primarily located in close proximity to its customers rather than at production sites. In some instances,
the sales forces are located inside customer facilities. The company’s sales force is highly trained and knowledgeable regarding all
bearings products, and associates assist customers during the development and implementation phases and provide ongoing support.
The company has a joint venture in North America focused on joint logistics and e-business services. This alliance is called CoLinx,
LLC and was founded by Timken, SKF, INA and Rockwell Automation. The e-business service was launched in April 2001 and
is focused on information and business services for authorized distributors in the Industrial Group. The company also has another
e-business joint venture which focuses on information and business services for authorized industrial distributors in Europe, Latin
America and Asia. This alliance, which Timken founded with SKF, Sandvik AB, INA and Reliance, is called Endorsia.com International AB.
Timken's steel products are sold principally by its own sales organization. Most orders are customized to satisfy customer-specific
applications and are shipped directly to customers from Timken's steel manufacturing plants. Approximately 10% of Timken's Steel
Group net sales are intersegment sales. In addition, sales are made to other anti-friction bearing companies and to the automotive and
truck, forging, construction, industrial equipment, oil and gas drilling and aircraft industries and to steel service centers.
Timken has entered into individually negotiated contracts with some of its customers in its Automotive Group, Industrial Group
and Steel Group. These contracts may extend for one or more years and, if a price is fixed for any period extending beyond current
shipments, customarily include a commitment by the customer to purchase a designated percentage of its requirements from Timken.
Contracts extending beyond one year that are not subject to price adjustment provisions do not represent a material portion of
Timken's sales. Timken does not believe that there is any significant loss of earnings risk associated with any given contract.
Competition
The anti-friction bearing business is highly competitive in every country in which Timken sells products. Timken competes primarily
based on price, quality, timeliness of delivery, product design and the ability to provide engineering support and service on a global
basis. The company competes with domestic manufacturers and many foreign manufacturers of anti-friction bearings, including SKF,
INA, NTN Corporation, Koyo Seiko Co., Ltd. and NSK Ltd.
Competition within the steel industry, both domestically and globally, is intense and is expected to remain so. However, the recent
combination of a weakened U.S. dollar, worldwide rationalization of uncompetitive capacity, raw material cost increases and
North American and global market strength have allowed steel industry prices to increase and margins to improve. Timken's
worldwide competitors for steel bar products include North American producers such as Republic, Mac Steel, Mittal, Steel Dynamics,
Nucor and a wide variety of offshore steel producers who export into North America. Competitors for seamless mechanical tubing
include Dofasco, Plymouth Tube, Michigan Seamless Tube, V & M Tube, Sanyo Special Steel, Ovako and Tenaris. Competitors in the
precision steel components sector include Formtec, Linamar, Jernberg and overseas companies such as Tenaris, Ovako, Stackpole
and FormFlo.
Maintaining high standards of product quality and reliability while keeping production costs competitive is essential to Timken's ability
to compete with domestic and foreign manufacturers in both the anti-friction bearing and steel businesses.
4 T H E T I M K E N C O M PA N Y
25. Trade Law Enforcement
The U.S. government has six antidumping duty orders in effect covering ball bearings from five countries and tapered roller bearings
from China. The five countries covered by the ball bearing orders are France, Germany, Italy, Japan and the United Kingdom. The
company is a producer of these products in the United States. The U.S. government determined in August 2006 that each of these
six antidumping duty orders should remain in effect for an additional five years.
Continued Dumping and Subsidy Offset Act (CDSOA)
The CDSOA provides for distribution of monies collected by U.S. Customs from antidumping cases to qualifying domestic producers
where the domestic producers have continued to invest in their technology, equipment and people. The company reported CDSOA
receipts, net of expenses, of $87.9 million, $77.1 million and $44.4 million in 2006, 2005 and 2004, respectively.
The amount for 2004 was net of the amount that Timken delivered to the seller of the Torrington business, pursuant to the terms of
the agreement under which the company purchased Torrington. In 2004, Timken delivered to the seller of the Torrington business
80% of the CDSOA payments received in 2004 for Torrington's bearing business.
In September 2002, the World Trade Organization (WTO) ruled that CDSOA payments are not consistent with international trade rules.
In February 2006, U.S. legislation was enacted that would end CDSOA distributions for imports covered by antidumping duty orders
entering the U.S. after September 30, 2007. Instead, any such antidumping duties collected would remain with the U.S. Treasury.
This legislation is not expected to have a significant effect on potential CDSOA distributions in 2007, but would be expected to reduce
likely distributions in years beyond 2007, with distributions eventually ceasing.
In separate cases in July and September 2006, the U.S. Court of International Trade (CIT) ruled that the procedure for determining
recipients eligible to receive CDSOA distributions is unconstitutional. The CIT has not ruled on other matters, including any remedy
as a result of its ruling. The company expects that these rulings of the CIT will be appealed. The company is unable to determine, at
this time, if these rulings will have a material adverse impact on the company’s financial results.
In addition to the CIT rulings, there are a number of factors that can affect whether the company receives any CDSOA distributions
and the amount of such distributions in any year. These factors include, among other things, potential additional changes in the law,
ongoing and potential additional legal challenges to the law and the administrative operation of the law. Accordingly, the company
cannot reasonably estimate the amount of CDSOA distributions it will receive in future years, if any. If the company does receive
CDSOA distributions in 2007, they likely will be received in the fourth quarter.
T H E T I M K E N C O M PA N Y 5
26. Joint Ventures
The balances related to investments accounted for under the equity method are reported in other non-current assets on the
Consolidated Balance Sheet, which were approximately $12.1 million and $19.9 million at December 31, 2006 and 2005, respectively.
During 2002, the company’s Automotive Group formed a joint venture, Advanced Green Components, LLC (AGC), with Sanyo Special
Steel Co., Ltd. (Sanyo) and Showa Seiko Co., Ltd. (Showa). AGC is engaged in the business of converting steel to machined rings for
tapered bearings and other related products. The company had been accounting for its investment in AGC under the equity method
since AGC’s inception. During the third quarter of 2006, AGC refinanced its long-term debt of $12.2 million. The company guaranteed
half of this obligation. The company concluded the refinancing represented a reconsideration event to evaluate whether AGC was a
variable interest entity under FASB Interpretation No. 46 (revised December 2003). The company concluded that AGC was a variable
interest entity and the company was the primary beneficiary. Therefore, the company consolidated AGC, effective September 30,
2006. As of September 30, 2006, the net assets of AGC were $9.0 million, primarily consisting of the following: inventory of $5.7 mil-
lion; property, plant and equipment of $27.2 million; goodwill of $9.6 million; short-term and long-term debt of $20.3 million; and other
non-current liabilities of $7.4 million. The $9.6 million of goodwill was subsequently written-off as part of the annual test for impair-
ment in accordance with Statement of Financial Accounting Standards No. 142. All of AGC’s assets are collateral for its obligations.
Except for AGC’s indebtedness for which the company is a guarantor, AGC’s creditors have no recourse to the assets of the company.
Backlog
The backlog of orders of Timken's domestic and overseas operations is estimated to have been $1.96 billion at December 31, 2006
and $1.98 billion at December 31, 2005. Actual shipments are dependent upon ever-changing production schedules of the customer.
Accordingly, Timken does not believe that its backlog data and comparisons thereof, as of different dates, are reliable indicators of
future sales or shipments.
Raw Materials
The principal raw materials used by Timken in its North American bearing plants to manufacture bearings are its own steel tubing and
bars, purchased strip steel and energy resources. Outside North America, the company purchases raw materials from local sources
with whom it has worked closely to ensure steel quality, according to its demanding specifications.
The principal raw materials used by Timken in steel manufacturing are scrap metal, nickel and other alloys. The availability and prices
of raw materials and energy resources are subject to curtailment or change due to, among other things, new laws or regulations,
changes in demand levels, suppliers' allocations to other purchasers, interruptions in production by suppliers, changes in exchange
rates and prevailing price levels. For example, the weighted average price of scrap metal increased 87.1% from 2003 to 2004,
decreased 7.7% from 2004 to 2005 and increased 7.9% from 2005 to 2006. Prices for raw materials and energy resources continue
to remain high compared to historical levels.
The company continues to expect that it will be able to pass a significant portion of these increased costs through to customers in the
form of price increases or raw material surcharges.
Disruptions in the supply of raw materials or energy resources could temporarily impair the company's ability to manufacture its
products for its customers or require the company to pay higher prices in order to obtain these raw materials or energy resources from
other sources, which could affect the company's sales and profitability. Any increase in the prices for such raw materials or energy
resources could materially affect the company's costs and its earnings.
Timken believes that the availability of raw materials and alloys is adequate for its needs, and, in general, it is not dependent on any
single source of supply.
6 T H E T I M K E N C O M PA N Y
27. Research
Timken has developed a significant global footprint of technology centers.
The company operates four corporate innovation and development centers. The largest technical center is located in North Canton,
Ohio, near Timken’s world headquarters, and it supports innovation and know-how for friction management product lines, such as
tapered roller bearings and needle bearings. In 2006, Timken opened a new technical center in Greenville, South Carolina, to support
innovation and know–how for power transmission product lines. The company also supports related technical capabilities with
facilities in Bangalore, India and Brno, Czech Republic.
In addition, Timken’s business groups operate several technology centers for product excellence within the United States in Mesa,
Arizona, and Keene and Lebanon, New Hampshire. Within Europe, technology is developed in Ploiesti, Romania; Colmar, France; and
Halle-Westfallen, Germany.
The company's technology commitment is to develop new and improved friction management and power transmission product
designs, such as tapered roller bearings and needle bearings, with a heavy influence in related steel materials and lean manufacturing
processes.
Expenditures for research, development and application amounted to approximately $67.9 million, $60.1 million, and $56.7 million in
2006, 2005 and 2004, respectively. Of these amounts, $8.0 million, $7.2 million and $6.7 million, respectively, were funded by others.
Environmental Matters
The company continues its efforts to protect the environment and comply with environmental protection laws. Additionally, it has
invested in pollution control equipment and updated plant operational practices. The company is committed to implementing a docu-
mented environmental management system worldwide and to becoming certified under the ISO 14001 standard where appropriate
to meet or exceed customer requirements. By the end of 2006, 30 of the company’s plants had obtained ISO 14001 certification.
The company believes it has established adequate reserves to cover its environmental expenses and has a well-established
environmental compliance audit program, which includes a proactive approach to bringing its domestic and international units to
higher standards of environmental performance. This program measures performance against applicable laws, as well as standards
that have been established for all units worldwide. It is difficult to assess the possible effect of compliance with future requirements
that differ from existing ones. As previously reported, the company is unsure of the future financial impact to the company that could
result from the United States Environmental Protection Agency’s (EPA’s) final rules to tighten the National Ambient Air Quality
Standards for fine particulate and ozone. The company is also unsure of potential future financial impacts to the company that could
result from possible future legislation regulating emissions of greenhouse gases.
The company and certain U.S. subsidiaries have been designated as potentially responsible parties by the EPA for site investigation
and remediation at certain sites under the Comprehensive Environmental Response, Compensation and Liability Act (CERCLA), known
as the Superfund, or state laws similar to CERCLA. The claims for remediation have been asserted against numerous other entities,
which are believed to be financially solvent and are expected to fulfill their proportionate share of the obligation.
Management believes any ultimate liability with respect to pending actions will not materially affect the company’s operations, cash
flows or consolidated financial position. The company is also conducting voluntary environmental investigations and/or remediations
at a number of current or former operating sites. Any liability with respect to such investigations and remediations, in the aggregate,
is not expected to be material to the operations or financial position of the company.
New laws and regulations, stricter enforcement of existing laws and regulations, the discovery of previously unknown contamination
or the imposition of new clean-up requirements may require the company to incur costs or become the basis for new or increased
liabilities that could have a material adverse effect on Timken’s business, financial condition or results of operations.
T H E T I M K E N C O M PA N Y 7
28. Patents, Trademarks and Licenses
Timken owns a number of U.S. and foreign patents, trademarks and licenses relating to certain products. While Timken regards these
as important, it does not deem its business as a whole, or any industry segment, to be materially dependent upon any one item or
group of items.
Employment
At December 31, 2006, Timken had 25,418 associates. Approximately 17% of Timken's U.S. associates are covered under collective
bargaining agreements.
Available Information
Timken's annual report on Form 10-K, quarterly reports on Form 10-Q, current reports on Form 8-K and amendments to those reports
filed or furnished pursuant to Section 13(a) or 15(d) of the Securities Exchange Act of 1934 are available, free of charge, on Timken's
website at www.timken.com as soon as reasonably practical after electronically filing or furnishing such material with the SEC.
Item 1A: Risk Factors
The following are certain risk factors that could affect our business, financial condition and result of operations. The risks that are
highlighted below are not the only ones that we face. These risk factors should be considered in connection with evaluating forward-
looking statements contained in this Annual Report on Form 10-K because these factors could cause our actual results and financial
condition to differ materially from those projected in forward-looking statements. If any of the following risks actually occur, our
business, financial condition or results of operations could be negatively affected.
The bearing industry is highly competitive, and this competition results in significant pricing pressure for our
products that could affect our revenues and profitability.
The global bearing industry is highly competitive. We compete with domestic manufacturers and many foreign manufacturers of anti-
friction bearings, including SKF, INA, NTN, Koyo and NSK. The bearing industry is also capital- intensive and profitability is dependent
on factors such as labor compensation and productivity and inventory management, which are subject to risks that we may not be
able to control. Due to the competitiveness within the bearing industry, we may not be able to increase prices for our products to
cover increases in our costs and, in many cases, we may face pressure from our customers to reduce prices, which could adversely
affect our revenues and profitability.
Competition and consolidation in the steel industry, together with potential global overcapacity, could result
in significant pricing pressure for our products.
Competition within the steel industry, both domestically and worldwide, is intense and is expected to remain so. Global production
overcapacity has occurred in the past and may reoccur in the future, which, when combined with high levels of steel imports into the
United States, may exert downward pressure on domestic steel prices and result in, at times, a dramatic narrowing, or with many
companies the elimination, of gross margins. In addition, many of our competitors are continuously exploring and implementing
strategies, including acquisitions, which focus on manufacturing higher margin products that compete more directly with our steel
products. These factors could lead to significant downward pressure on prices for our steel products, which could have a materially
adverse effect on our revenues and profitability.
We may not be able to realize the anticipated benefits from, or successfully execute, Project O.N.E.
During 2005, we began implementing Project O.N.E., a multi-year program designed to improve business processes and systems to
deliver enhanced customer service and financial performance. During 2007, we expect the first major U.S. implementation of Project
O.N.E. We may not be able to realize the anticipated benefits from or successfully execute this program. Our future success will
depend, in part, on our ability to improve our business processes and systems. We may not be able to successfully do so without
substantial costs, delays or other difficulties. We may face significant challenges in improving our processes and systems in a
timely and efficient manner.
8 T H E T I M K E N C O M PA N Y
29. Risk Factors (continued)
Implementing Project O.N.E. will be complex and time-consuming, may be distracting to management and disruptive to our businesses,
and may cause an interruption of, or a loss of momentum in, our businesses as a result of a number of obstacles, such as:
• the loss of key associates or customers;
• the failure to maintain the quality of customer service that we have historically provided;
• the need to coordinate geographically diverse organizations; and
• the resulting diversion of management’s attention from our day-to-day business and the need to dedicate additional
management personnel to address obstacles to the implementation of Project O.N.E.
If we are not successful in executing Project O.N.E., or if it fails to achieve the anticipated results, then our operations, margins, sales
and reputation could be adversely affected.
Any change in the operation of our raw material surcharge mechanisms or the availability or cost of raw materials
and energy resources could materially affect our earnings.
We require substantial amounts of raw materials, including scrap metal and alloys and natural gas to operate our business. Many
of our customer contracts contain surcharge pricing provisions. The surcharges are tied to a widely-available market index for that
specific raw material. Any change in the relationship between the market indices and our underlying costs could materially affect our
earnings.
Moreover, future disruptions in the supply of our raw materials or energy resources could impair our ability to manufacture our
products for our customers or require us to pay higher prices in order to obtain these raw materials or energy resources from other
sources, and could thereby affect our sales and profitability. Any increase in the prices for such raw materials or energy resources
could materially affect our costs and therefore our earnings.
Warranty, recall or product liability claims could materially adversely affect our earnings.
In our business, we are exposed to warranty and product liability claims. In addition, we may be required to participate in the recall of
a product. A successful warranty or product liability claim against us, or a requirement that we participate in a product recall, could
have a materially adverse effect on our earnings
The failure to achieve the anticipated results of our Automotive Group initiatives could materially affect our earnings.
During 2005, we began restructuring our Automotive Group operations to address challenges in the automotive markets. We
expect that this restructuring will cost approximately $80 million to $90 million (pretax) and we are targeting annual pretax savings of
approximately $40 million by 2008. In response to reduced production demand from North American automotive manufacturers, in
September 2006, we announced further planned reductions in our Automotive Group workforce of approximately 700 associates.
We expect that this workforce reduction will cost approximately $25 million (pretax) and we are targeting annual pretax savings of
approximately $35 million by 2008. The failure to achieve the anticipated results of our Automotive Group restructuring and workforce
reduction initiatives, including our targeted annual savings, could adversely affect our earnings.
The failure to achieve the anticipated results of our Canton bearing operation rationalization initiative could
materially adversely affect our earnings.
After reaching a new four-year agreement with the union representing employees in the Canton, Ohio bearing and steel plants in 2005,
we refined our plans to rationalize our Canton bearing operations. We expect that this rationalization initiative will cost approximately
$35 million to $40 million (pretax) over the next three years and we are targeting annual pretax savings of approximately $25 million.
The failure to achieve the anticipated results of this initiative, including our targeted annual savings, could adversely affect our
earnings.
We may incur further impairment and restructuring charges that could materially affect our profitability.
We have taken approximately $82.6 million in impairment and restructuring charges for our Automotive Group restructuring and
workforce reduction and the rationalization of our Canton bearing operations during 2006 and 2005 and expect to take additional
charges in connection with these initiatives. Changes in business or economic conditions, or our business strategy may result in
additional restructuring programs and may require us to take additional charges in the future, which could have a materially adverse
effect on our earnings.
T H E T I M K E N C O M PA N Y 9
30. Risk Factors (continued)
Any reduction of CDSOA distributions in the future would reduce our earnings and cash flows.
The CDSOA provides for distribution of monies collected by U.S. Customs from antidumping cases to qualifying domestic producers
where the domestic producers have continued to invest in their technology, equipment and people. The company reported CDSOA
receipts, net of expenses, of $87.9 million, $77.1 million and $44.4 million in 2006, 2005 and 2004, respectively. In February 2006,
U.S. legislation was enacted that would end CDSOA distributions for imports covered by antidumping duty orders entering the United
States after September 30, 2007. Instead, any such antidumping duties collected would remain with the U.S. Treasury. This legisla-
tion is not expected to have a significant effect on potential CDSOA distributions in 2007, but would be expected to reduce any
distributions in years beyond 2007, with distributions eventually ceasing.
In separate cases in July and September 2006, the U.S. Court of International Trade (CIT) ruled that the procedure for determining
recipients eligible to receive CDSOA distributions is unconstitutional. The CIT has not finally ruled on other matters, including any
remedy as a result of its ruling. The company expects that the ruling of the CIT will be appealed. The company is unable to
determine, at this time, if these rulings will have a material adverse impact on the company’s financial results.
In addition to the CIT ruling, there are a number of other factors that can affect whether the company receives any CDSOA
distributions and the amount of such distributions in any year. These factors include, among other things, potential additional
changes in the law, other ongoing and potential additional legal challenges to the law, and the administrative operation of the law. It
is possible that CIT rulings might prevent us from receiving any CDSOA distributions in 2007. Any reduction of CDSOA distributions
would reduce our earnings and cash flow.
Weakness in any of the industries in which our customers operate, as well as the cyclical nature of our customers’
businesses generally, could adversely impact our revenues and profitability by reducing demand and margins.
Our revenues may be negatively affected by changes in customer demand, changes in the product mix and negative pricing pressure
in the industries in which we operate. Many of the industries in which our end customers operate are cyclical. Margins in those
industries are highly sensitive to demand cycles, and our customers in those industries historically have tended to delay large capital
projects, including expensive maintenance and upgrades, during economic downturns. As a result, our business is also cyclical and
our revenues and earnings are impacted by overall levels of industrial production.
Certain automotive industry companies have recently experienced significant financial downturns. In 2005, we increased our reserve
for accounts receivable relating to our automotive industry customers. If any of our automotive industry customers becomes
insolvent or files for bankruptcy, our ability to recover accounts receivable from that customer would be adversely affected and any
payment we received in the preference period prior to a bankruptcy filing may be potentially recoverable. In addition, financial
instability of certain companies that participate in the automotive industry supply chain could disrupt production in the industry.
A disruption of production in the automotive industry could have a materially adverse effect on our financial condition and earnings.
Environmental regulations impose substantial costs and limitations on our operations and environmental
compliance may be more costly than we expect.
We are subject to the risk of substantial environmental liability and limitations on our operations due to environmental laws and
regulations. We are subject to various federal, state, local and foreign environmental, health and safety laws and regulations
concerning issues such as air emissions, wastewater discharges, solid and hazardous waste handling and disposal and the investiga-
tion and remediation of contamination. The risks of substantial costs and liabilities related to compliance with these laws and
regulations are an inherent part of our business, and future conditions may develop, arise or be discovered that create substantial
environmental compliance or remediation liabilities and costs.
Compliance with environmental legislation and regulatory requirements may prove to be more limiting and costly than we anticipate.
New laws and regulations, including those which may relate to emissions of greenhouse gases, stricter enforcement of existing laws
and regulations, the discovery of previously unknown contamination or the imposition of new clean-up requirements could require us to
incur costs or become the basis for new or increased liabilities that could have a material adverse effect on our business, financial
condition or results of operations. We may also be subject from time to time to legal proceedings brought by private parties or
governmental authorities with respect to environmental matters, including matters involving alleged property damage or personal injury.
10 T H E T I M K E N C O M PA N Y
31. Risk Factors (continued)
Unexpected equipment failures or other disruptions of our operations may increase our costs and reduce our sales
and earnings due to production curtailments or shutdowns.
Interruptions in production capabilities, especially in our Steel Group, would inevitably increase our production costs and reduce sales
and earnings for the affected period. In addition to equipment failures, our facilities are also subject to the risk of catastrophic loss
due to unanticipated events such as fires, explosions or violent weather conditions. Our manufacturing processes are dependent upon
critical pieces of equipment, such as furnaces, continuous casters and rolling equipment, as well as electrical equipment, such as
transformers, and this equipment may, on occasion, be out of service as a result of unanticipated failures. In the future, we may
experience material plant shutdowns or periods of reduced production as a result of these types of equipment failures.
The global nature of our business exposes us to foreign currency fluctuations that may affect our asset values,
results of operations and competitiveness.
We are exposed to the risks of currency exchange rate fluctuations because a significant portion of our net sales, costs, assets
and liabilities, are denominated in currencies other than the U.S. dollar. These risks include a reduction in our asset values, net sales,
operating income and competitiveness.
For those countries outside the United States where we have significant sales, devaluation in the local currency would reduce the
value of our local inventory as presented in our Consolidated Financial Statements. In addition, a stronger U.S. dollar would result in
reduced revenue, operating profit and shareholders’ equity due to the impact of foreign exchange translation on our Consolidated
Financial Statements. Fluctuations in foreign currency exchange rates may make our products more expensive for others to purchase
or increase our operating costs, affecting our competitiveness and our profitability.
Changes in exchange rates between the U.S. dollar and other currencies and volatile economic, political and market conditions in
emerging market countries have in the past adversely affected our financial performance and may in the future adversely affect the
value of our assets located outside the United States, our gross profit and our results of operations.
Global political instability and other risks of international operations may adversely affect our operating costs,
revenues and the price of our products.
Our international operations expose us to risks not present in a purely domestic business, including primarily:
• changes in tariff regulations, which may make our products more costly to export or import;
• difficulties establishing and maintaining relationships with local OEMs, distributors and dealers;
• import and export licensing requirements;
• compliance with a variety of foreign laws and regulations, including unexpected changes in taxation and environmental or other
regulatory requirements, which could increase our operating and other expenses and limit our operations; and
• difficulty in staffing and managing geographically diverse operations.
These and other risks may also increase the relative price of our products compared to those manufactured in other countries,
reducing the demand for our products in the markets in which we operate, which could have a materially adverse effect on our
revenues and earnings.
Underfunding of our defined benefit and other postretirement plans has caused and may continue to cause a
significant reduction in our shareholders’ equity.
As a result of recent accounting standards, the underfunded status of our pension fund assets and our postretirement health care
obligations, we were required to take a total net reduction of $276 million, net of income taxes, against our shareholders’ equity in
2006. We may be required to take further charges related to pension and other postretirement liabilities in the future and these
charges may be significant.
T H E T I M K E N C O M PA N Y 11
32. Risk Factors (continued)
The underfunded status of our pension fund assets will cause us to prepay the funding of our pension obligations
which may divert funds from other uses.
The increase in our defined benefit pension obligations, as well as our ongoing practice of managing our funding obligations over time,
have led us to prepay a portion of our funding obligations under our pension plans. We made cash contributions of $243 million,
$226 million and $185 million in 2006, 2005 and 2004, respectively, to our U.S.-based pension plans and currently expect to make cash
contributions of $80 million in 2007 to such plans. However, we cannot predict whether changing economic conditions or other
factors will lead us or require us to make contributions in excess of our current expectations, diverting funds we would otherwise apply
to other uses.
Work stoppages or similar difficulties could significantly disrupt our operations, reduce our revenues and
materially affect our earnings.
A work stoppage at one or more of our facilities could have a materially adverse effect on our business, financial condition and results
of operations. Also, if one or more of our customers were to experience a work stoppage, that customer would likely halt or limit
purchases of our products, which could have a materially adverse effect on our business, financial condition and results of operations.
Item 1B: Unresolved Staff Comments
None.
12 T H E T I M K E N C O M PA N Y