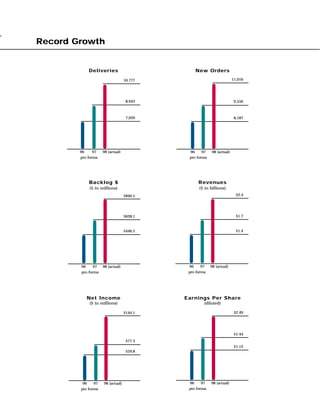
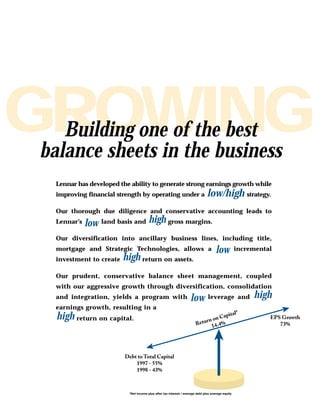
Lennar Corporation grew significantly in 1998 through adherence to core values and strategies of operational simplicity, strategic acquisitions, diversified earnings, and balance sheet strength. Key accomplishments included 73% earnings per share growth, reduced homebuilding debt ratio, and 63% increased shareholders' equity. Lennar's simple operating model of focused geographic markets, standardized home features, and emphasis on quality helped drive efficient growth. Acquisitions expanded operations across high-growth states while diversifying earnings. Maintaining a prudent balance sheet positions Lennar for continued long-term growth.
This annual report summarizes Dollar General's performance for the fiscal year ending February 3, 2006. Some key points:
- Dollar General grew net sales by 12% to $8.6 billion and net income by 2% to $350 million, with earnings per share of $1.08.
- The company opened 734 new stores, including 29 new Dollar General Markets, bringing the total store count to 7,929.
- Initiatives like EZstore and Project Gold Standard aimed to improve store operations and strengthen the organization. Nearly half of stores implemented the EZstore model by year-end.
- Leadership was enhanced with several new executive hires and a reorganization to better
The document discusses PBG's financial highlights and growth in 2000. Key points:
1) PBG had strong financial results in 2000, with net revenues of $7.982 billion and EPS of $1.53, up from 1999. Operating income and EBITDA also grew substantially.
2) Two-thirds of PBG's business comes from take-home sales. In 2000 PBG focused on growing its bottled water and flavor carbonated soft drink segments in the take-home market.
3) PBG launched Sierra Mist, a new lemon-lime flavor, to capitalize on the fast growing lemon-lime segment of the carbonated soft drink category. The launch was swift in
Campbell Soup Company reported strong financial results in 2006. Net sales increased to $7.34 billion from $7.07 billion in 2005. Earnings from continuing operations grew to $755 million in 2006 from $644 million in 2005. The company is focused on driving sustainable quality growth through five key strategies, including expanding their iconic brands within the categories of Simple Meals and Baked Snacks. In 2006, the company increased sales of brands like Campbell's soup, Goldfish crackers, and Pepperidge Farm cookies. The annual report discusses Campbell Soup Company's financial performance in 2006 and strategic plans for further growing their business in the coming years.
1) Timken's 2005 annual report summarizes their vision of delivering value to customers through innovative solutions in friction management and power transmission.
2) In 2005, Timken achieved strong financial results including record sales of $5.2 billion and earnings per share of $2.81, nearly double the previous year.
3) Timken's focus on improving costs and productivity, along with investments in high-growth markets like Asia and industrial applications, positions them for continued profitable growth as industrial markets remain strong in 2006.
Campbell Soup Company reported strong financial results for fiscal year 2008 despite challenging market conditions. Net sales increased 8% to $7.998 billion and adjusted net earnings per share rose 7% to $2.09. The company's U.S. Soup, Sauces and Beverages business saw a 5% increase in sales. The Baking and Snacking business delivered an 11% increase in sales. International Soup, Sauces and Beverages sales increased 15%. Campbell remains focused on its core categories of Simple Meals, Baked Snacks, and Healthy Beverages which offer the best growth prospects globally.
Winn-Dixie's sales and profits declined in fiscal year 2004 compared to 2003 due to challenging market conditions. To address these challenges, Winn-Dixie developed a strategic plan focused on rationalizing stores and facilities, achieving $100 million in annual expense reductions, and improving branding through better customer service, store appearances, and product offerings. Winn-Dixie aims to strengthen its position in its core markets in the Southeast U.S. and improve its competitiveness.
This annual report summarizes Campbell Soup Company's financial highlights and business performance for fiscal year 2007. Key points include:
- Net sales increased 7% to $7.9 billion and adjusted earnings per share increased 13% to $1.95.
- The company achieved strong sales growth in U.S. soup, beverages, and Pepperidge Farm baked snacks. International operations also improved.
- Campbell is focusing on winning in the marketplace through products aligned with wellness trends like lower sodium soups and juices. It is also focusing on winning in the workplace by improving employee engagement.
- The company delivered superior shareholder returns and is well positioned for continued growth by expanding in key categories and new markets globally.
Lennar Corporation's 2000 annual report summarizes their strong financial and operational performance for the year. Key points include record revenues of $4.7 billion, net earnings of $229 million, and continued focus on increasing shareholder value. Lennar completed a major acquisition of U.S. Home that expanded their geographic reach and product offerings. The report emphasizes Lennar's culture of caring for customers, associates, communities and shareholders.
The document provides a summary of The Home Depot's annual report for fiscal year 2006. It discusses the company's performance highlights for 2006 including net sales of $90.8 billion and net earnings of $5.8 billion. It also lists the company's priorities going forward which include improving customer service, driving product innovation and value, improving product availability, enhancing the store environment, and serving professional contractors. Finally, it provides an overview of the company's community involvement efforts in 2006 which included responding to natural disasters and contributing to affordable housing projects.
The document is ConAgra Foods' 2008 annual report which provides financial highlights and discusses the company's focus on its food business. It summarizes that net sales increased over $11 billion but profit growth was impacted by high inflation. The company divested non-core businesses and focused on innovation, cost reductions, and quality improvements to combat inflation and drive sustainable growth going forward.
The document is The Home Depot's 2002 Annual Report. It provides the following key information:
1) The Home Depot is the world's largest home improvement retailer with fiscal 2002 sales of $58.2 billion. It operates various store formats across the US, Canada, and Mexico.
2) In 2002, The Home Depot achieved net earnings of $3.7 billion, earnings per share growth of 21%, and a return on invested capital of 18.8%. It ended the year with $2.3 billion in cash after repurchasing $2 billion in stock.
3) The Home Depot made significant investments in 2002 to transform the business through technology upgrades, merchandising
This document is The Home Depot's 2007 Annual Report. It provides a summary of the company's financial performance for 2007, including net sales, net earnings, earnings per share, total assets, liabilities, and store count. It discusses investments made in areas like associate engagement, product excitement, availability, shopping environment, and serving professional customers. It also summarizes international performance, the company strategy of focusing on retail operations, and capital allocation plans. The report is addressed to shareholders, associates, customers, suppliers and communities.
Dillard's reported annual revenues of over $7.8 billion for its 2003 fiscal year. However, the company experienced a 4% decline in sales and a narrowing of gross margins, which contributed to a significant decrease in profits compared to 2002. To improve performance, Dillard's introduced new brands, refined its merchandise selection, and continued reducing expenses. The company also strengthened its balance sheet by paying down $261 million in debt. Looking ahead, Dillard's aims to differentiate its brand and customer experience.
This annual report summarizes P&G's financial performance in 2011. Key points include:
- Net sales were $83 billion, up 4% from 2010. Operating cash flow was $15.2 billion and diluted earnings per share were $3.89.
- Organic sales grew 4% and organic volume grew 3%. Core earnings per share grew 9%. Free cash flow productivity was 90% of net earnings.
- The report discusses P&G's purpose-inspired growth strategy to touch and improve more lives through innovation, expanding into new markets and price tiers, and leveraging their strengths in consumer understanding, branding, and global scale.
- Innovation is highlighted as key to winning decades of growth,
The annual report summarizes Corning's financial performance in 2002, a challenging year due to the downturn in the telecommunications industry. Corning reported a net loss of $1.3 billion on sales of $3.2 billion, down significantly from 2001. In response, Corning restructured operations, cutting costs and jobs to preserve its financial position. It aims to return to profitability in 2003 by focusing on growing its display glass, environmental, and semiconductor businesses within Corning Technologies. While telecommunications remains weak, Corning maintains its leadership in optical fiber and intends to benefit when the market rebounds.
Campbell Soup Company launched a five-year plan in 2001 to transform the company. In 2002, the first year of the plan, Campbell began implementing initiatives to revitalize its core U.S. Soup business, strengthen its broader portfolio, build new growth avenues, drive quality and productivity improvements, and improve organizational excellence. While investments reduced net earnings, Campbell made progress in nearly every part of the company and expects benefits to increase in future years as the transformation plan continues.
This annual report summarizes The Home Depot's performance in fiscal year 2005. Some key points:
- Sales reached a record $81.5 billion, up from $73.1 billion the previous year. Net earnings increased 16.7% to a record $5.8 billion.
- The company continued pursuing its strategy of enhancing its core business, extending into new areas like services, and expanding into new markets like the professional contractor segment.
- 21 acquisitions were completed in 2005 to help serve professional contractors better. The largest acquisition was Hughes Supply, to expand the company's presence in the professional market.
- Internationally, the company remains the top home improvement retailer in Canada
The document summarizes The Home Depot's 2004 annual report. It discusses that in 2004, The Home Depot had record sales of $73.1 billion and saw increases in net earnings, earnings per share, total assets, and store count. Key accomplishments included comparable store sales growth of 5.4%, operating margin reaching 10.8%, and returning $4 billion to shareholders through stock buybacks and dividends. The company focused on enhancing its core business through merchandising resets and new products, extending into new store formats, and investing in its employees.
The 2004 annual report of Holly Corporation provides an overview of the company's financial and operating highlights for 2004 as well as its mission, company profile, and refined product markets. Key details include Holly operating three petroleum refineries in New Mexico, Utah, and Montana with total refining capacity of 109,000 barrels per day. Holly also owns a 48% interest in Holly Energy Partners which owns over 1,500 miles of refined product pipelines and terminals. Holly achieved record financial results in 2004 with sales of $2.2 billion and net income of $83.9 million compared to $1.4 billion and $46.1 million respectively in 2003.
This presentation contains forward-looking statements about the company's goals, expectations for revenues, margins, income, and earnings. It discusses plans for consolidating Canadian facilities, integrating acquisitions, and expected results. The presentation notes risks that could impact actual results. It also discusses using non-GAAP financial measures to analyze performance, and provides a reconciliation to GAAP measures. Finally, it outlines the company's financial performance, strategies for growth in various markets, and highlights why SYNNEX is an attractive investment.
The Pantry, Inc. is the leading independently operated convenience store chain in the southeastern United States, operating 1,653 stores under brands like Kangaroo Express. The company generates revenue primarily from merchandise sales, gasoline sales, and ancillary products and services. Fiscal 2008 was challenging due to unprecedented increases in oil and gasoline prices, but the company took actions to reduce costs and strengthen its financial position, delivering higher net income and earnings per share compared to the previous year.
1) Lowe's is the second largest home improvement retailer in the world, serving over 5 million customers weekly through more than 650 stores.
2) In 2000, Lowe's achieved record sales of $18.8 billion and net income of over $800 million, representing 18% and 20% growth respectively.
3) Lowe's plans to aggressively expand in 2001 by opening 115-120 new stores, focusing on major metropolitan areas that represent half of the home improvement market potential.
This annual report summarizes Masco Corporation's performance in 2000. Key points include:
- Net sales reached a record $7.2 billion, a 15% increase over 1999. However, earnings were below expectations due to factors like a weaker economy and higher costs.
- The cabinets and related products segment achieved 15% sales growth to $2.6 billion, while plumbing products sales rose 2% to $1.8 billion. Insulation installation sales increased 61% to $855 million.
- Geographically, sales in North America rose 14% to $5.9 billion while international sales grew 21% to $1.3 billion, offsetting currency and market issues in Europe.
- Looking ahead
The 2002 annual report of Barnes & Noble provides financial highlights and details of the company's performance in fiscal year 2002. Some key points:
1) Total sales increased 8.1% to $5.27 billion driven by a 20.7% increase in sales at GameStop stores, which the company owns a majority stake in.
2) Net earnings increased 57% to $99.9 million compared to $64 million in 2001, with diluted EPS growth of 47% to $1.39.
3) The letter to shareholders notes challenges in the retail bookselling business but highlights growth areas, cost reductions, and contributions from GameStop that helped drive improved financial results.
This document outlines a company's corporate responsibility report. It discusses how the company focuses on being responsible to four key constituents: their community, customers, associates, and shareholders. The company believes in giving back to the community through their foundation, which donates 1% of profits to organizations helping people. In 2004, over $5 million was donated through focused acts of caring where divisions adopt local charities. The report details many of these adopted organizations and causes supported.
Lennar Corporation's 2000 annual report summarizes their strong financial and operational performance for the year. Key points include:
- Revenues grew 51% to $4.7 billion and net earnings grew 33% to $229 million, demonstrating strong growth.
- They completed a major acquisition of U.S. Home, diversifying their operations across the country.
- Returning value to shareholders through a 39% increase in shareholder's equity to $1.2 billion and a 33% growth in earnings per share.
- Lennar attributes their success to caring about their customers, associates, communities and managing for strong returns.
Study - Digital Real Estate - 10 megatrends 2014Drooms
The document discusses 10 megatrends in digital real estate for 2014, including:
1) Real estate data and reports will predominantly be accessed via mobile devices.
2) Large images, videos, drone footage and infographics will become standard in real estate marketing.
3) Crowdfunding platforms are enabling new financing options for real estate projects online.
Lennar corporation case study. plus video (2)Hasiyah Dorosae
The document outlines a presentation on homebuilder Lennar Corporation. It provides an overview of Lennar's history and expansion, compares its financial performance to industry peers from 2006-2008, discusses its use of joint ventures, and analyzes the impact of fraud allegations on the company. Specifically, it found that Lennar improperly accounted for earnings and cash flows from its unconsolidated joint venture entities, overstating its liquidity and profitability ratios.
Jo Caudron spoke about managing digital transformation in Real Estate at CIB Vastgoedcongres 2015.
No sector is safe from disruption, you have to start acting today to transform your company for a digital-first future.
Digital transformation will affect any industry, sooner or later. This is an introduction on how the real estate business will be affected in the very near future.
Big Data in Real Estate - Digital Real Estate SummitRaphael Rollier
Raphael Rollier spoke at the Digital Real Estate Summit on February 7th 2017 about new ways of working using data and technology, such as using augmented reality maps for construction logistics optimization and transit bundling. He discussed how this could enable new services like population monitoring and prevention to address aging. Finally, he noted that verticals will become ecosystems by leveraging data to match needs, and that technology, business cases, politics, regulation, governance, skills, and soft factors are keys to success in enabling new services and ways of working through data and ecosystem creation.
Winn-Dixie Stores, Inc. reported declining financial results for fiscal year 2004, with sales and gross profit decreasing from the previous year. The company developed a strategic plan to strengthen its competitive position, focusing on rationalizing its store base, achieving $100 million in annual expense reductions, and improving its brand and customer experience. Key initiatives included closing underperforming stores, exiting non-core markets, reducing expenses, enhancing product offerings, and improving stores' appearance and customer service. The company aims to implement these changes to enhance its business and financial performance over the long run, though acknowledges that a turnaround will not happen overnight.
This document is Gannett Co., Inc.'s 2005 annual report. It includes the company's financial summary for 2005, a letter to shareholders from the chairman and CEO, and information about the company's operations. The letter discusses leadership changes at Gannett in 2005, the company's financial performance for the year which saw increased revenues and operating cash flow despite challenges, and strategic acquisitions and investments made to expand Gannett's digital offerings and ability to reach audiences across multiple platforms.
This annual report summarizes Ameriprise Financial's performance in 2006. Some key points:
- Revenues grew 11% to $8.1 billion and earnings grew 25% to $866 million.
- Total client assets grew 9% to $466 billion and life insurance in force grew 9% to $174 billion.
- The company strengthened its brand awareness, which grew from near zero to 50% by the end of 2006.
- Ameriprise is well positioned to serve the growing number of baby boomers entering retirement over the next two decades as the first boomers turned 60 in 2006.
This annual report summarizes Ameriprise Financial's performance in 2006. Some key points:
- Revenues grew 11% to $8.1 billion and earnings grew 25% to $866 million.
- Total client assets grew 9% to $466 billion and life insurance in force grew 9% to $174 billion.
- The company continued to invest in its brand, advisor force, products, and technology to capitalize on serving the growing mass affluent and affluent market, especially retiring baby boomers who will need financial advice and solutions.
This document is Mohawk Industries' 2001 Annual Report. The summary provides:
1) Mohawk achieved record financial results in 2001 despite economic challenges, with net earnings of $188.6 million and diluted EPS of $3.55, up 15% from 2000.
2) Mohawk continued improving operations through cost reductions, debt paydown, inventory management and cash flow increases.
3) Mohawk completed a merger with Dal-Tile to become a leader in both soft and hard flooring, with the goal of expanding product categories and driving shareholder value.
This document is Mohawk Industries' 2001 Annual Report. The summary provides:
1) Mohawk achieved record financial results in 2001 despite economic challenges, with net earnings of $188.6 million and diluted EPS of $3.55, up 15% from 2000.
2) Mohawk continued improving operations through cost reductions, debt paydown, inventory management and cash flow increases.
3) Mohawk completed an acquisition of Dal-Tile to become a leader in both soft and hard flooring, with the goal of expanding product categories and market position.
This annual report summarizes Lennar Corporation's performance in 1999. Key points include:
1) Lennar grew total revenues to $3.1 billion, a 29% increase over 1998, with net earnings increasing 20% to $173 million.
2) Lennar reduced its debt to total capital ratio from 43% to 37% and reduced its revolving credit balance to $0 by the end of 1999.
3) Lennar exceeded its goals for revenue, earnings, and home delivery growth while maintaining a focus on return on capital and equity.
1) Lennar Corporation had another record year in 1999, growing total revenues to $3.1 billion, a 29% increase, and growing net earnings by 20% to $173 million.
2) The company maintained a simple four-tiered strategy of operating model, expansion, diversification, and conservative fiscal policies, focusing on maintaining a strong balance sheet, diversifying earnings, and maximizing returns.
3) Lennar streamlined operations through two main divisions, Lennar Homes and Lennar Financial Services, allowing the company to cover most aspects of homebuilding and buying while keeping processes simple.
1) Lennar Corporation had another record year in 1999, growing total revenues to $3.1 billion, a 29% increase, and growing net earnings by 20% to $173 million.
2) The company maintained a simple four-tiered strategy of operating model, expansion, diversification, and conservative fiscal policy while focusing on maintaining a strong balance sheet, diversifying earnings, and maximizing returns.
3) Lennar's "Everything's Included" program and Zero Defects policy aim to maximize home value for customers through standard luxury features and a streamlined production process.
The document is Campbell Soup Company's 2001 annual report. It summarizes the company's transformation plan to revitalize the business and return to growth. The plan focuses on 5 strategies: 1) revitalizing US soup sales, 2) strengthening the broader portfolio, 3) building new growth avenues, 4) improving quality while driving productivity, and 5) improving organizational excellence. The report provides details on initiatives under each strategy, and discusses financial performance and outlook.
This annual report summary covers Caterpillar's record financial results in 2005, including sales and revenues of $36.34 billion and profits of $2.85 billion. Caterpillar's order backlog indicates continued market strength in 2006. The company implemented a new enterprise strategy in 2005 focused on people, product, process performance, and profitable growth. Key goals include improving employee safety, product quality, and order-to-delivery times. Caterpillar remains the global leader in its industries and is well positioned for more growth, with a target of $50 billion in sales by 2010. Challenges include making further safety, quality, and availability improvements to maintain leadership.
World Fuel Services Corporation is a global leader in the downstream marketing and financing of aviation and marine fuel products and related services. For the nine-month period ended December 31, 2002, the company reported revenue of $1.55 billion, up 52.6% from the same period the previous year. Net income was $9.9 million, down 22.6% from the previous year. The company has a strong balance sheet with $312 million in total assets and $127.7 million in stockholders' equity.
Masco Corporation's 2007 annual report discusses the company's financial results for 2007. Key points include:
- Net sales declined 7% to $11.8 billion in 2007 compared to $12.7 billion in 2006.
- Income from continuing operations was $397 million or $1.06 per share, down from $478 million or $1.20 per share in 2006.
- The company returned over $1 billion to shareholders through share repurchases and dividends.
- Cash flow from operations was approximately $980 million.
First Data Corporation's 2004 annual report provides financial highlights and a letter from the CEO. The report summarizes that:
- Revenues grew from $5.9 billion in 2000 to $10.0 billion in 2004, while earnings per share grew from $1.24 to $2.22 over the same period.
- First Data processed over 36 billion transactions in 2004, or over 100 million transactions per day.
- The CEO expresses confidence in First Data's ability to capitalize on opportunities in the payments industry due to its global distribution network, brands, and integrated solutions.
This annual report summarizes Kohl's financial performance in fiscal year 2007. Net sales increased 5.6% to $16.5 billion though net income decreased 2.2% to $1.08 billion. Key highlights include record sales for the 16th consecutive year, operating margin of 11%, and the addition of 112 new stores. Challenges in the retail environment impacted earnings relative to expectations. The report discusses Kohl's continued financial discipline and strategies to increase market share through new store openings and expansion in existing markets.
The 2007 annual report discusses Gannett Co., Inc.'s financial results for 2007 and goals for the future. Key points include:
- Revenues decreased 5.2% to $7.4 billion in 2007 due to economic downturns impacting the real estate and automotive industries which heavily affected some of Gannett's major markets.
- Net income per share was $4.17, which included a $0.22 per share impairment charge.
- Gannett's digital businesses continued growing, reaching almost $0.5 billion in revenue, despite challenges from the economic cycle.
- Going forward, Gannett aims to strengthen its digital presence and local news coverage,
The annual report summarizes Gannett Co.'s strategic goals and financial performance in 2007. Key points include:
- Revenues declined to $7.4 billion due to economic downturns impacting advertising sales. Net income was also down.
- Gannett focused on transforming its business model to better serve customers digitally and meet changing consumer demands.
- Significant investments were made in digital products, infrastructure, and partnerships to grow the company's digital revenue, which reached nearly $500 million.
- Challenges from the economy were addressed by aligning costs with revenues while maintaining strategic transformation efforts.
This presentation provides an overview of Market Leader, a company that provides real estate professionals with marketing and technology solutions. It summarizes Market Leader's history and services, including lead generation products and a customer relationship management system. The presentation also includes financial highlights such as revenue, expenses, assets, and equity from 2009 to 2007.
This document is Mohawk Industries' 2002 Annual Report. Some key highlights include:
- Mohawk is the leading manufacturer and marketer of floorcovering in the US, but has less than 25% market share, indicating room for growth.
- In 2002, Mohawk saw record financial results with net sales of $4.5 billion (up 31% from 2001), net earnings of $284 million (up 24% from 2001), and earnings per share of $4.39.
- Mohawk has strategically grown over the years through acquisitions, transforming from a small carpet manufacturer to a leading floorcovering producer offering various product types.
- Mohawk's CEO discusses initiatives in 2002 like
This document provides an overview and financial projections for Xcel Energy. It discusses Xcel Energy's integrated utility operations, forecasts steady customer and earnings growth, and outlines plans to reduce emissions and refurbish coal plants. It also summarizes Xcel Energy's liquidity and debt refinancing plans, provides 2003 earnings guidance, and outlines priorities including resolving its involvement with bankrupt company NRG.
This document provides an overview and financial projections for Xcel Energy. It discusses Xcel Energy's integrated utility operations, forecasts steady customer and earnings growth, and outlines plans to reduce emissions and refurbish coal plants. It also summarizes Xcel Energy's liquidity and debt refinancing plans, provides 2003 earnings guidance, and outlines priorities including resolving its NRG investment and maintaining its dividend.
This document provides an overview and financial projections for Xcel Energy. It discusses Xcel Energy's integrated utility operations, forecasts steady customer and earnings growth, and outlines plans to reduce emissions and refurbish coal plants. It also summarizes Xcel Energy's liquidity and debt refinancing plans, provides 2003 earnings guidance, and outlines priorities including resolving its involvement with bankrupt company NRG.
This document summarizes Xcel Energy's presentation at the 2003 Banc of America Securities Investment Conference. It outlines Xcel Energy's operations as an integrated utility across multiple US states, financial metrics including earnings growth and dividend yield, efforts to divest from the unprofitable NRG Energy business, and capital expenditure plans including converting coal plants to natural gas to reduce emissions. It also provides guidance for 2003 earnings per share and outlines financing plans to redeem higher interest debt.
This document summarizes Xcel Energy's presentation at the 2003 Banc of America Securities Investment Conference. It outlines Xcel Energy's operations as an integrated utility across multiple US states, its financial performance and guidance, initiatives to reduce emissions in Minnesota, and capital expenditure and financing plans. It highlights Xcel Energy's regulated business model, commitment to dividends, efforts to resolve issues related to its former subsidiary NRG, and expectations for continued earnings growth.
This document summarizes an investor presentation by Xcel Energy on its business operations and financial outlook. It discusses Xcel Energy's integrated utility operations, positive cash flow generation, plans to divest its stake in NRG Energy through bankruptcy proceedings, financial guidance for 2003 including earnings per share, and capital expenditure plans. The presentation also provides comparisons of Xcel Energy's operating metrics to industry peers.
This document provides an overview of Xcel Energy's financial performance and objectives presented at the Edison Electric Institute Financial Conference in October 2003. Key points include: Xcel achieved several accomplishments in 2003 including settling with NRG creditors and maintaining investment grade ratings. Objectives are to invest in utility assets, provide competitive returns, and improve credit ratings. Earnings guidance for 2003 is $1.48-$1.53 per share and $1.15-$1.25 for 2004, driven by utility operations and tax benefits from NRG. The presentation outlines capital expenditures, financing plans, and regulatory strategies.
This document provides an overview of Xcel Energy from their presentation at the Edison Electric Institute Financial Conference in October 2003. Key points include Xcel achieving several accomplishments in 2003 including settling with NRG creditors, maintaining investment grade ratings, and refinancing debt. Projections for 2004 include earnings of $1.15-1.25 per share assuming NRG emerges from bankruptcy. The presentation outlines Xcel's objectives, investments, regulatory strategy, and earnings drivers to emphasize the company as a low-risk, integrated utility with a total return of 7-8%.
This document provides an overview of Xcel Energy from their presentation at the Banc of America Securities Energy & Power Conference in November 2003. Key points include that Xcel achieved several accomplishments in 2003 including settling with NRG creditors and maintaining investment grade ratings. Objectives for 2004 include investing additional capital in utilities, providing competitive returns to shareholders, and improving credit ratings. Earnings guidance for 2003 is $1.48-$1.53 per share and $1.15-$1.25 per share for 2004.
This document summarizes Xcel Energy's presentation at the Banc of America Securities Energy & Power Conference on November 17-19, 2003. It discusses Xcel Energy's accomplishments in 2003, objectives for investment, earnings growth, and credit ratings improvement. It also provides guidance on projected 2003 and 2004 earnings, cash flows, utility investments, and the expected timeline for NRG's emergence from bankruptcy.
This document provides an overview of Xcel Energy Inc. for investors attending the EEI International Financial Conference. It summarizes Xcel's financial performance, business segments, generation assets, environmental commitments, regulatory strategy, and earnings guidance. The presentation outlines Xcel's strengths as a utility, investment merits, and objectives to invest additional capital in its utility business and improve credit ratings while providing competitive returns.
This document provides an overview of Xcel Energy Inc. for investors attending the EEI International Financial Conference. It summarizes Xcel's financial performance, business segments, generation assets, environmental commitments, regulatory strategy, and earnings guidance. The presentation outlines Xcel's strengths as a growing utility, its investment merits, and capital expenditure plans to improve its credit ratings and provide competitive returns.
This document provides an overview of Xcel Energy Inc. for investors attending the EEI International Financial Conference. It summarizes Xcel's business segments, strengths, investment merits, capital investment plans, power supply, environmental commitments, and financial performance. Projections for 2004 earnings per share and cash flow are also presented. Key points include Xcel being the 4th largest US electric and gas utility, a growing service area, low rates, and a goal of providing competitive total returns of 7-9% to shareholders.
Xcel Energy reported improved second quarter 2004 earnings compared to the second quarter of 2003. Net income for the quarter was $86 million, or $0.21 per share, compared to a net loss of $283 million, or $0.71 per share in 2003. Regulated utility earnings from continuing operations improved to $89 million in 2004 from $77 million in 2003. Results from discontinued operations were earnings of $5 million in 2004 compared to losses of $337 million in 2003. The company maintained its annual earnings guidance of $1.15 to $1.25 per share.
This document summarizes a presentation given by Dick Kelly, president and COO of Xcel Energy, at a Lehman Brothers energy conference on September 8, 2004. Kelly outlines Xcel Energy's strategy of investing $900-950 million annually in its utility assets to meet growth, while also pursuing specific generation projects, including a $1 billion coal plant expansion in Colorado. Kelly projects total shareholder return of 7-9% annually through earnings growth of 2-4% and a dividend yield of around 5%.
Wayne Brunetti is the Chairman and CEO of Xcel Energy, a major electric and gas utility. The document discusses Xcel Energy's business strategy, which involves continued investment in its utility assets to meet growth. Key capital projects include a $1 billion emissions reduction program in Minnesota and a proposed $1.3 billion coal plant in Colorado. The summary also provides Xcel Energy's earnings guidance for 2004 and discusses its dividend policy. Brunetti emphasizes that Xcel Energy needs clarity on public policy regarding energy and the environment to effectively plan and invest.
Wayne Brunetti is the Chairman and CEO of Xcel Energy, a major electric and gas utility. The document discusses Xcel Energy's business strategy, which involves continued investment in its utility assets to meet growth. Key capital projects include a $1 billion emissions reduction program in Minnesota and a proposed $1.3 billion coal plant in Colorado. The summary also outlines Xcel Energy's financial metrics, earnings guidance, and dividend policy. Brunetti emphasizes that Xcel Energy needs clarity on public policy regarding energy and the environment to effectively plan and invest.
Wayne Brunetti is the Chairman and CEO of Xcel Energy, a major electric and gas utility. The document discusses Xcel Energy's business strategy, which involves continued investment in its utility assets to meet growth. Key capital projects include a $1 billion emissions reduction program in Minnesota and a proposed $1.3 billion coal plant in Colorado. The summary also provides Xcel Energy's earnings guidance for 2004 and discusses its dividend policy. Brunetti emphasizes that Xcel Energy needs clarity on public policy regarding energy and the environment to effectively plan and invest.
Financial Assets: Debit vs Equity Securities.pptxWrito-Finance
financial assets represent claim for future benefit or cash. Financial assets are formed by establishing contracts between participants. These financial assets are used for collection of huge amounts of money for business purposes.
Two major Types: Debt Securities and Equity Securities.
Debt Securities are Also known as fixed-income securities or instruments. The type of assets is formed by establishing contracts between investor and issuer of the asset.
• The first type of Debit securities is BONDS. Bonds are issued by corporations and government (both local and national government).
• The second important type of Debit security is NOTES. Apart from similarities associated with notes and bonds, notes have shorter term maturity.
• The 3rd important type of Debit security is TRESURY BILLS. These securities have short-term ranging from three months, six months, and one year. Issuer of such securities are governments.
• Above discussed debit securities are mostly issued by governments and corporations. CERTIFICATE OF DEPOSITS CDs are issued by Banks and Financial Institutions. Risk factor associated with CDs gets reduced when issued by reputable institutions or Banks.
Following are the risk attached with debt securities: Credit risk, interest rate risk and currency risk
There are no fixed maturity dates in such securities, and asset’s value is determined by company’s performance. There are two major types of equity securities: common stock and preferred stock.
Common Stock: These are simple equity securities and bear no complexities which the preferred stock bears. Holders of such securities or instrument have the voting rights when it comes to select the company’s board of director or the business decisions to be made.
Preferred Stock: Preferred stocks are sometime referred to as hybrid securities, because it contains elements of both debit security and equity security. Preferred stock confers ownership rights to security holder that is why it is equity instrument
<a href="https://www.writofinance.com/equity-securities-features-types-risk/" >Equity securities </a> as a whole is used for capital funding for companies. Companies have multiple expenses to cover. Potential growth of company is required in competitive market. So, these securities are used for capital generation, and then uses it for company’s growth.
Concluding remarks
Both are employed in business. Businesses are often established through debit securities, then what is the need for equity securities. Companies have to cover multiple expenses and expansion of business. They can also use equity instruments for repayment of debits. So, there are multiple uses for securities. As an investor, you need tools for analysis. Investment decisions are made by carefully analyzing the market. For better analysis of the stock market, investors often employ financial analysis of companies.
Turin Startup Ecosystem 2024 - Ricerca sulle Startup e il Sistema dell'Innov...Quotidiano Piemontese
Turin Startup Ecosystem 2024
Una ricerca de il Club degli Investitori, in collaborazione con ToTeM Torino Tech Map e con il supporto della ESCP Business School e di Growth Capital
What price will pi network be listed on exchangesDOT TECH
The rate at which pi will be listed is practically unknown. But due to speculations surrounding it the predicted rate is tends to be from 30$ — 50$.
So if you are interested in selling your pi network coins at a high rate tho. Or you can't wait till the mainnet launch in 2026. You can easily trade your pi coins with a merchant.
A merchant is someone who buys pi coins from miners and resell them to Investors looking forward to hold massive quantities till mainnet launch.
I will leave the what's app number of my personal pi vendor to trade with.
+12349014282
5 Tips for Creating Standard Financial ReportsEasyReports
Well-crafted financial reports serve as vital tools for decision-making and transparency within an organization. By following the undermentioned tips, you can create standardized financial reports that effectively communicate your company's financial health and performance to stakeholders.
The Rise of Generative AI in Finance: Reshaping the Industry with Synthetic DataChampak Jhagmag
In this presentation, we will explore the rise of generative AI in finance and its potential to reshape the industry. We will discuss how generative AI can be used to develop new products, combat fraud, and revolutionize risk management. Finally, we will address some of the ethical considerations and challenges associated with this powerful technology.
Lecture slide titled Fraud Risk Mitigation, Webinar Lecture Delivered at the Society for West African Internal Audit Practitioners (SWAIAP) on Wednesday, November 8, 2023.
2. Elemental Economics - Mineral demand.pdfNeal Brewster
After this second you should be able to: Explain the main determinants of demand for any mineral product, and their relative importance; recognise and explain how demand for any product is likely to change with economic activity; recognise and explain the roles of technology and relative prices in influencing demand; be able to explain the differences between the rates of growth of demand for different products.
1. Elemental Economics - Introduction to mining.pdfNeal Brewster
After this first you should: Understand the nature of mining; have an awareness of the industry’s boundaries, corporate structure and size; appreciation the complex motivations and objectives of the industries’ various participants; know how mineral reserves are defined and estimated, and how they evolve over time.
Seminar: Gender Board Diversity through Ownership NetworksGRAPE
Seminar on gender diversity spillovers through ownership networks at FAME|GRAPE. Presenting novel research. Studies in economics and management using econometrics methods.
2. Ask About Lennar
Founded in 1954, Lennar Corporation has grown to become one of the leading providers of new
homes and residential financial services in America. Lennar has grown through its commitment
to strive to provide “Zero Defect” homes and services to families across America.
• Building homes for our customers
Lennar Corporation is one of the largest homebuilders in the United States, with operations
in Florida, Texas, Arizona, Nevada, and California. The company markets homes to first-time,
move-up and active adult home buyers. Home prices range from under $100,000 to over
$400,000. Through our Financial Services Division, we provide residential mortgage, title and
closing services, as well as other ancillary services including home security monitoring and
cable television service.
• Building careers for our associates
Lennar Corporation currently employs over 4,000 associates throughout the company’s
markets. While each associate contributes his or her individual talents to the company,
all associates are bound together by the strong cultural values that are uniquely Lennar’s.
Company values include integrity, responsibility, trust, and commitment to quality. The
Lennar environment encourages and enables our associates to grow as our company grows.
• Building value for our shareholders
Lennar Corporation has been a consistent leader in providing long-term value for shareholders.
The company balances long-term and short-term strategies to provide strong earnings per
share growth with an industry-leading balance sheet that is positioned to ensure long-term
value creation. A diversified earnings stream provides earnings stability and predictability. And
a simple operating model allows the company to stay lean and well positioned for the future.
Contents
Financial Highlights....................1
Shareholders Letter......................2
Our Customers................................6
Our Markets......................................8
Zero Defects.........................10
Our Associates...............................12
Lennar Financial Services......14
Our Financial Strategy.............16
Financial Information.............17
3. Record Growth
Deliveries New Orders
11,016
10,777
8,943 9,556
7,929 8,187
96 97 98 (actual) 96 97 98 (actual)
pro forma pro forma
Revenues
Backlog $
($ in billions)
($ in millions)
$2.4
$840.5
$1.7
$628.1
$1.4
$446.5
96 97 98 (actual)
96 97 98 (actual)
pro forma
pro forma
Earnings Per Share
Net Income
($ in millions) (diluted)
$2.49
$144.1
$1.44
$77.3
$1.12
$59.8
96 97 98 (actual)
96 97 98 (actual)
pro forma
pro forma
4. Growing: The Lennar Way
It’s not just how big you grow, it’s how you grow big.
Dear Shareholders,
1998 was an outstanding growth year for Lennar Corporation. In addition to growing
by every financial measure, we grew as a more efficient and more diversified company;
better positioned to compete and consolidate as we look ahead. Our growth model
has enabled us to grow quickly and comfortably, attaining both short-term goals
and ensuring long-term stability.
In 1998 we...
• Grew earnings per share by 73%.
• Reduced our homebuilding debt to total capital ratio to 43% from 55%.
• Achieved a 33% return on beginning shareholders’ equity.
• Increased shareholders’ equity 63%, from $439 million to $716 million.
Lennar grew by adhering to longstanding values that have enabled our company to enhance shareholder
value while we have built the very best homebuilding company in the business. A balance of operational
and financial strategies continued to guide Lennar as we grew our business.
Kept Our Operations Simple...
We believe that our strategy of keeping things simple will continue to enable us to grow quickly and
efficiently. From where we build, to what we build, to how we build, The Simpler The Better. By keeping
our business simple, we have maintained management focus on the core business and leveraged our
overhead, while we have maintained gross margins that are among the highest in the industry.
Where we build - Coast to coast and focused. Our geographic strategy is to remain concentrated in the
fastest-growing markets in the nation. This geographic strategy enables us to focus management on
targeted markets and maximize our efficiency in those markets.
What we build - Everything’s Included.TM Our product strategy is to offer a better value to our customers by
including an expanded standard features package, limiting options, upgrades and changes, and simplifying
production in the field. No off-site design centers and no extra overhead; we just pass the added value on
to our customers.
How we build - Zero Defects. The big red for Zero Defects is so important to us that you’ll see it
on our name badges, in the hallways of all of our offices, and even on the cover of our annual report.
It’s at the heart of everything we do - it’s just that simple. Our company is more and more focused
on quality. We reduce the number of service calls and keep our customer base happier in the process.
Through our simple operating platform, we remain well positioned to sustain growth from our existing
base of business and to integrate future acquisitions with ease and efficiency.
Grew Through Acquisitions...
We believe that industry consolidation continues to be a significant driver behind growth. We began 1998
having just completed the combination with Pacific Greystone and we grew from there. Throughout 1998
we continued to execute our growth model with strategic acquisitions which were immediately integrated
and were accretive to earnings per share. These acquisitions have enabled us to grow our business, expand
our management team, and further diversify our earnings stream.
5. In the past year we acquired Winncrest Homes, which positioned
us as the largest homebuilder in Sacramento, California. We also
purchased ColRich Communities and Polygon Communities,
which provided us with well-positioned replacement communities
and our entrance into the Inland Empire in Southern California.
The purchase of North American Title Company helped us to
quickly position our title operations in the west.
A distinct Lennar culture continues to drive the integration of a
diverse group of management teams to grow as a consistent and
efficient, unified company. From the way we talk to the way we
account, from the way we build to the way we motivate, Lennar
associates are part of a unique, coordinated program. We know
who we are and what we stand for. We move in tandem and
work together as a team.
Diversified Our Earnings...
We believe that a diverse business will provide the most consistent predictable and recurring earnings
stream. Throughout 1998 we diversified our business in a variety of ways.
In 1998 we continued to diversify geographically as we expanded our positions in the five fastest-
growing states in the country. We not only grew within our existing operating divisions, but we also
added new divisions in Fort Worth, Texas and the Inland Empire in California. This strategy has enabled
us to diversify coast to coast, and at the same time, leverage the strength of a compact, experienced
and focused management team.
We continued to maintain a balanced product offering, covering first-time buyers through retirement
buyers at prices ranging from under $100,000 to over $400,000.
We had our first full year of operations from Lennar Land Partners in 1998, which generated over
$30 million of pretax profits for us. Our diversification with joint venture partners will continue to
be a significant source of bottom line profits for the company.
Lennar Financial Services grew over 186% in 1998 and contributed $33 million to our pretax earnings.
Our earnings are now more balanced between mortgage and title, and we’re excited about the prospects
for our Strategic Technologies division. Currently we are focused on adding ancillary service businesses
to further diversify our earnings stream and generate high shareholder returns.
And Strengthened Our Balance Sheet...
We believe that managing a prudent, conservative balance sheet is both a strong foundation for future
growth and our means of keeping the cycle as our ally, not our adversary. In 1998 we enhanced the capital
structure of our company while we continued to maintain a current, conservatively-stated, asset base.
We balanced our financial performance this past year by lowering our debt to total capital ratio
from 55% to 43%, while we achieved a 73% EPS growth rate. In 1998, Standard & Poor’s upgraded
the company’s corporate credit and senior unsecured debt ratings to investment grade.
We also diversified our debt structure by issuing $229 million of Zero Coupon Senior Convertible
Debentures while maintaining the financial flexibility of over $500 million available on our credit facility
at year-end. As a result, Lennar has one of the strongest balance sheets in the homebuilding industry.
6. ...Because It’s A Sprint And A Marathon.
We believe that real success is defined in terms of both long-term as well as short-term achievements.
Our strong financial results were achieved through a combination of good strategic positioning, focused
execution of our operating plan, and a well-balanced program of integrating compatible companies under
the Lennar umbrella. We grew earnings per share while at the same time we improved our balance sheet.
We achieved short-term growth and earnings objectives while we improved long-term growth prospects.
So, where does Lennar grow from here? Because of the way we have positioned our company, we have
many options for continued growth. As we approach the new millennium, we believe that we are uniquely
positioned to benefit from the opportunities that lie ahead. Over the span of our now 45-year history,
we have positioned our company to produce industry-leading financial results and increased value for
our shareholders. And we have never been better positioned than we are right now.
As we move into 1999, our management team will continue to seek new opportunities to grow our business
by expanding market share within our markets. At the same time, we will continue to diversify our business
by considering new growth markets for expansion and seeking new business lines to leverage our profit per
customer. Additionally, we will continue to use our efficient operating model to maintain a lean overhead
structure and to further strengthen our financial position. By balancing growth with conservative management,
we believe that we will produce the strongest results for our shareholders.
In closing I’d like to say thank you to some very special people. Thank you to our shareholders for their
continued support and investment in our company. Thank you to our customers for putting their trust in
Lennar Corporation and allowing us to build and finance their dream. And thank you to all Lennar associates
across the country for working so hard to produce outstanding results for both our customers and our shareholders.
I would also like to say a special thank you to Irving Bolotin who retired this year after 45 years of
service to Lennar Corporation. Irving was with the company since inception and served as our
Senior Vice President since Lennar went public in 1970. Irving’s leadership, integrity and work ethic
have been an inspiration to all of us. And we look forward to his continued guidance for many years
to come as a valued member of our Board of Directors.
Sincerely,
Stuart A. Miller
President & Chief Executive Officer
7. The Valencia by Village Builders recently
received a “Best In American Living” Award
from the National Association Of Home Builders.
8. GROWING Young families
to active adults
A big part of growing our business is growing with our customers
through their life cycle, starting with their first new home.
Lennar’s home buyers are typically comprised of:
• FIRST-TIME HOME BUYERS, who are seeking to get the greatest
value and quality for their initial home.
• MOVE-UP HOME BUYERS, often with children at home,
who are seeking more spacious plans, more features
and more amenities, with the same great value and quality.
• ACTIVE ADULTS, also known as empty-nesters,
who are seeking homes requiring less maintenance
and providing more recreational opportunities.
We are proud to say that our home buyers not only enjoy their own
homes, but urge their friends and family to buy Lennar homes, too.
In fact, a main source of new customers is word-of-mouth referrals.
It is also common for a family to purchase
a second or third Lennar home as their
needs change, or for one family to
include two or three generations of
Lennar homeowners.
9. Kingwood, one of the largest master-planned communities
in Houston, is being developed by Lennar Corporation.
10. Building homes for people starting out.
Far from being a homogeneous group with one set of needs,
today’s first-time home buyers are a highly diversified group
comprised of singles, couples, young families, and single parents.
Lennar has responded to the first-time home buyer with a variety
of home styles.
Our “Everything’s Included”TM program provides our homeowners
with everything they need and want in a new home. For the
first-time home buyer, “Everything’s Included”TM translates into
Lennar builds homes
tremendous value. For Lennar, it’s another way of keeping it simple.
for first-time home buyers
It’s also another reason Lennar will be remembered when first-time
ranging in price from under
home buyers are ready to become move-up home buyers.
$
100,000 to over $200,000.
Building homes for families moving up.
Brand loyalty is rare among home buyers, but Lennar takes pride
in a large number of repeat customers. Rather than moving on,
these customers move up with Lennar.
In 1998, Lennar enhanced its position with move-up home buyers
by unveiling elegant new designs in all of our markets. Because
families are spending more time at home, we introduced more
spacious homes with innovative features like Lennar’s Home
Learning Center,TM a pre-wired, built-in computer workstation
suitable for both young students and home-based business people. Lennar builds homes
for move-up home buyers
While our designs may be cutting edge, Lennar’s philosophy
ranging in price from under
is “The Simpler The Better.” For move-up buyers, “Everything’s
$
200,000 to over $400,000.
Included”TM means homes that are personalized, not customized.
For Lennar, it means we’re building customers for life.
Building relationships that last a lifetime.
Yesterday’s baby boom is fast becoming tomorrow’s active adult
audience. The more than 76 million boomers, who constitute over
1/3 of the total U.S. population, are beginning to move into their
50s. It’s estimated that by the year 2005, this health-conscious,
fitness-focused group will represent the majority of all active
adults in America, and Lennar is ready.
Lennar, a leading builder of active adult communities for over
four decades, is expanding this aspect of our homebuilding
business. Lennar is introducing more exclusive communities for
Lennar builds homes
active adults in Florida and Arizona, as well as in Houston’s largest
for active adults ranging
master-planned community, The Woodlands. Our home designs
in price from under
offer more room for hobbies and entertaining, and more
$
100,000 to over $200,000.
convenience features to free up time to enjoy it all.
11.
12. GROWING
Building coast to coast
in America’s
fastest-growing markets
Growing The Lennar Way is about being a big fish in a big pond.
Lennar has focused on success by concentrating our homebuilding
operations in Florida, Texas, Nevada, Arizona, and California.
To achieve a strong position in America’s top markets, Lennar operates
under a well-established, simple program for concentrated growth:
• DIVERSIFICATION - Establish a broad mix of product and services
coast to coast that appeals to many segments of our growing markets.
• CONSOLIDATION - Acquire homebuilders and residential
financial service companies that enhance our position
in these fastest-growing markets.
• INTEGRATION - Introduce the Lennar culture to the management
and staff of our newly acquired companies.
Simply stated, this program allows us to
focus management attention on just the
fastest-growing markets. This concentrated
focus maximizes efficiencies in these
markets, while enhancing company
profitability.
13. Lennar is now one of the largest
homebuilders in California.
14. Coast to coast
Sacramento
North Bay
South Bay
Las Vegas
Ventura / Los Angeles
Inland Empire
Orange County
South Coast
San Diego
CALIFORNIA Phoenix
Tempe
• One of the largest homebuilders in California
• Established significant land position
• Population and employment growth
outpacing the national averages
• Four of the ten fastest-growing counties
in the nation are in California
• Housing affordability has improved
since the late 1980s
NEVADA
• Nevada is expected to lead the nation
ARIZONA
in employment growth over the next
five years
• Clark (Las Vegas) is the third fastest- • Maricopa (Phoenix) is the fastest-
growing county in the nation growing county in the nation
• Lennar’s strategy in Nevada is to • Lennar has over 25 years
maintain modest investment levels experience in the Phoenix market
• Concentrating on first-time • Strong employment growth continues
home buyers to fuel the strong Phoenix market
15. and focused
Fort Worth Dallas
Adult-Orlando
Orlando
Space Coast
Tampa
Houston
Sarasota
Village Builders Palm Beach
(Houston) Adult-Broward
Broward
Southwest Florida Dade
TEXAS FLORIDA
• One of the largest homebuilders in Texas • Largest homebuilder in Florida
• The #1 state in housing starts in 1998 • Significant market share in South Florida
• Largest in Houston market, expanding • Florida is second in residential permits
into the fast-growing Austin and in the first 10 months of 1998
Fort Worth markets • Historically stable market with growth
• Developing established master-planned fueled by both domestic and foreign
communities immigration
16. GROWING
Building the best homes across the land.
Homes with “Everything’s Included.” TM
Closings with “Zero Defects.”
Lennar’s Z Values is a statement of our core values that drives us toward
the goal of achieving Zero Defects in everything we do. It’s just the
beginning of our never-ending commitment to customer care. Through
our TLC program (Total Lennar Care), we provide a support system our
homeowners can rely on for years to come.
At Lennar, we’re not content with mere customer satisfaction.
We want every Lennar homeowner to be Tickled, Delighted, and Happy.
To achieve this goal, Lennar has made a pledge to strive to deliver
each and every home with a commitment called “Zero Defects.”
Our “Everything’s Included”TM Market Research
program benefits our customers Know your buyer
by ensuring consistent quality,
timely delivery and great value,
while still allowing them to per-
“
sonalize, not customize, their Subcontractor
”™
Customer
home. “The Simpler The Better.” Simplify construction
Better value
process
Lennar
More profitable
17. Anthony Smith of Lennar’s Dallas division was the first
recipient of Lennar’s TDH pin, awarded for his outstanding
“Z Values” pride and workmanship.
18. From to
Katherine Chang
Homeowner
“I noticed that it says zero defects
and that really impressed me because
construction is so complex. To say zero
defects - that is pretty ambitious and
everybody seems to feel that’s what
they can do.”
Roseanne
& Renny Freet
Homeowners
“It’s nice to know that the
home you are living in is
secure and safe, and built and
constructed in a manner that
is built to our best interest.”
Randy Mulpas
Director of Construction,
Orange County, California
“I love bringing homeowners out here
and showing them this is what I’m
doing for them, this is what you’ve
saved for your whole life, and I get
the opportunity to build it for you.”
19. shining
LENNAR
VA L U E S
OUR ZERO DEFE
CT commit
ment
to strive
to:
offer our custom
1. ers the very best
value in the mar
ketplace with ou
r
everything’s in
cludedtm featur
es.
make the lennar
home buying ex
2. perience
one that is unpa
ralleled in our
industry
by providing ou
r customers wit
h the HIGHEST
level OF PRIDE, Pr
ofessionalism AN
D INTEGRITY.
3. DELIVER each an
d every HOME to
our customers
with zero defe
cts prior to clos
ing.
promptly respon
4. d to all service
requests
on THe NEXT bu
siness day, or ON
THE SAME DAY
WHENEVER POSSIB
LE.
5. complete all war
ranty repairs in
a timely,
courteous and
professional m
anner.
20. GROWING
Sharing a masterplan with
partners who can build it
Nothing exemplifies Lennar’s team approach better
than what happens when we acquire another company.
We strive to keep it simple. We recognize the talents of
those people already in place; they know the geographic
and demographic markets better than anyone. We simply
Jonathan M. Jaffe
introduce them to The Lennar Way of building business, Vice President and
and provide them with the support they need to explore Regional President,
Lennar Corporation
new opportunities for growth.
New associates from acquisitions complement a well
established and tenured Lennar management team.
At Lennar, it’s important to us that our associates are
Tickled, Delighted and Happy, and that they are inspired
by Lennar’s long history of success. That’s why we have
Allan J. Pekor
created a unique culture which emphasizes such values
Vice President,
as integrity, responsibility, trust, and commitment to Lennar Corporation;
President, Lennar
quality. Many of our top executives have risen through Financial Services, Inc.
our ranks, motivated by the entrepreneurial Lennar spirit
that encourages, nurtures and challenges them.
How well does it work? Just ask the associates of our
recently acquired companies. They’ll tell you: Sales are
up, profits are up, morale is up. The sky’s the limit, and
they’re proud to wear their new name badge.
Jay Wissink
Regional President,
Lennar Corporation
21. The name badge proudly worn by every associate
in every company of the Lennar family is a symbol
of Lennar’s strong spirit of tradition and culture.
22. GROWINGTHE
KAY BRUCE
“
“The acquisition was the best thing Woven through the fibers of Lennar
is a common goal of working together
that could have happened to Village
to be the best we can be and having
Builders. We are part of a parent
fun along the way. The strong Lennar
company that has the knowledge and
KAY HOWARD BRUCE GROSS
culture will be often misunderstood
support to help us grow and become
President, Chief Financial Officer,
by outsiders. However, it really makes
a full-service, quality builder. We have Village Builders; Lennar Corporation;
for a unique company with which
experienced record sales since 1996, Former Marketing Former Senior
”
Director, Village Vice President,
” I’m proud to be associated.
with greatly enhanced profitability.
Builders, acquired Pacific Greystone,
in 1996 acquired in 1997
PETER EMILE
“One plus one equals three. “Sometimes you get lucky,
We’ve taken the best of both
in spite of your efforts. As a result
organizations and created
of the acquisition, our dreams for
a wonderful team atmosphere.
the Bramalea team have come true.
PETER KIESECKER EMILE HADDAD
With Lennar’s financial support
We are doing a lot of things and Regional President,
Regional President,
and solid land holdings, we have
” Lennar Homes Western
having a lot of fun.
Lennar Homes
been able to achieve record sales Land Region; Former
California Region;
”
and profits in the past year. Senior Vice President,
Former President,
Bramalea Homes,
Greystone Homes,
acquired in 1995
acquired in 1997
DAN
JEFF
“ “North American’s new affiliation with
The acquisition of Bramalea
Lennar Corporation brings many additional
California went extremely well,
assets to our customers: recognized financial
with a smooth transition for
strength, national support, and an unrelenting
everyone involved. Lennar’s
JEFF ROOS DAN WENTZEL
commitment to the real estate and home-
involvement has opened up
building industries. As we’re developing
President, Lennar Chairman & CEO,
tremendous opportunities for Homes Orange County North American
new relationships within Lennar and
our company, and we are very Division; Former Title Company,
capturing new revenues, we’re excited
” Senior Vice President, acquired in 1998
optimistic about our future.
”
about our future as a Lennar company.
Bramalea Homes,
acquired in 1995
23. LENNAR WAY
JOHN
JEFF
“ “
When you sell your own company, It’s been a win-win situation.
you sell a part of yourself. With Lennar’s With Lennar’s significant presence in
management style and support, the home buying marketplace, Regency
Title has been able to capitalize on
the transition has been smooth and
opportunities for increased volume
allowed for tremendous growth. JEFF SPITZER JOHN TAMBURELLO
and sales. We believe the acquisition
Our company has become the largest President, President,
has been beneficial to Lennar, too,
Lennar Homes Regency Title
builder in our market, with a growth
Sacramento Division; Company,
enabling them to be a significant
of over 900%. We have gone from Former Owner, acquired in 1996
”
player in the local market.
”
100 closings a year to nearly 1,000. Renaissance Homes,
acquired in 1996
Growing:
TOM
The Lennar Way “ An acquisition can be traumatic for
people who have been doing business the
means building same way for 15 or 20 years. But Lennar’s
purchase of Winncrest went about as
smoothly as one can hope. Lennar was very
careers for TOM WINN
thoughtful and responsive throughout the President, Lennar
process, and our associates have blended Homes Sacramento
Land; Former
in and embraced the Lennar culture. We’re
our associates. President & Owner,
”
happy to be part of the Lennar family.
Winncrest Homes, Inc.,
acquired in 1998
JOE LARRY
“As a result of the tremendous latitude “ The Inland Empire of Southern
Lennar has given us in taking advantage
California is in a rapidly expanding
of community development opportunities
housing marketplace. With the Lennar
in Houston, we have made more land
team behind us, we will be able to become
acquisitions in the last two years than we
had in the previous ten. One good indicator an impact player in this arena. We are
LARRY OLIN
JOE STUNJA
of the success of Lennar’s purchase of more than impressed with the ease of
President, Lennar
Friendswood Development Company is President, Friendswood
transition from a small, privately held Homes Inland
Development Co.;
the satisfaction of our associates; the only
builder to joining a national homebuilding Empire Division;
Former Vice President,
changes that have been made since we started
firm, especially with their treatment Former President,
Friendswood Development
under Lennar’s ownership have been in the
” ” Polygon Homes,
Co., acquired in 1996
addition of people to assist with our growth. of people and ongoing commitments.
acquired in 1998
24. GROWING
Building our business
by building our services
By growing our own companies to service our customers, Lennar is
enhancing the ownership experience for Lennar homeowners while
increasing the value for Lennar shareholders.
Lennar Financial Services (LFS) offers mortgage, title and technology
services for Lennar homeowners and others.
LFS shares the same culture and value system with the homebuilding
division of Lennar. LFS offers its own brand of Zero Defects service,
with a focus on customer satisfaction.
With these diverse services provided by LFS, Lennar has the unique
ability to grow its business during homebuilding market cycles.
LFS and Lennar Homes have a strong foundation to build on.
25. The UAMC card, shown at left, is the credit card
of the mortgage business. It gives qualified cardholders
the convenience of a pre-approved mortgage amount.
26. TITLE SERVICES
The Lennar family of
title companies has
grown to include three
major companies in the
title agency business:
MORTGAGE SERVICES TECHNOLOGY SERVICES
Universal Title Insurors
in Florida, Regency Title
in Houston, Texas, and
Since its inception in Strategic Technologies, Inc.
North American Title
1981, Universal American (STI) is a new and rapidly
headquartered in Northern
Mortgage Company (UAMC) growing sector of the
California. Title insurance
has emerged as one of LFS family.
underwriting is also
the nation's strongest
provided by North
mortgage providers. STI provides cable TV
American Title and and home security services
TitleAmerica Insurance
UAMC sells the loans to homeowners in Lennar
Corporation.
it originates into the communities and others in
secondary market and both California and
• North American Title,
either retains or sells Florida.
acquired in 1998,
the rights to service
was one of the nation's
those loans. In 1998, its second year
largest privately-owned
in business, Strategic
title agencies, operating
UAMC continues to service Technologies increased
through more than 80
mortgage loans in nearly its customer base by 40%.
branches in California,
every state. And 1998
Arizona and Colorado.
was another banner year Our strategy for this
for UAMC: emerging segment of
• All LFS title companies
our company is to further
had record profits in
• UAMC achieved record benefit from the growing
fiscal 1998.
earnings in every division. Lennar base of customers
• LFS title companies coast to coast.
• UAMC originated over participated in over
$1 billion in loans. 120,000 transactions • Strategic Technologies
in 1998.
• UAMC’s servicing portfolio provided cable TV to
grew to over $3.2 billion over 5,000 customers
and provides substantial in 1998.
income and cash flow in
• Strategic Technologies
the form of servicing fees
provided alarm service
received from investors.
to over 5,000 customers
in 1998.
27.
28. GROWING
Building one of the best
balance sheets in the business
Lennar has developed the ability to generate strong earnings growth while
low/high strategy.
improving financial strength by operating under a
Our thorough due diligence and conservative accounting leads to
low land basis and high gross margins.
Lennar’s
Our diversification into ancillary business lines, including title,
low
mortgage and Strategic Technologies, allows a incremental
high return on assets.
investment to create
Our prudent, conservative balance sheet management, coupled
with our aggressive growth through diversification, consolidation
high
low
and integration, yields a program with leverage and
earnings growth, resulting in a
high return on capital.