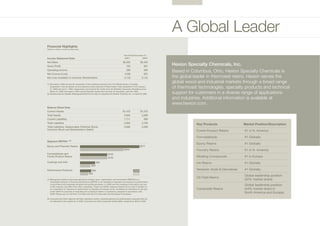
Hexion Specialty Chemicals is the global leader in thermoset resins with 2006 net sales of $5.2 billion. Key highlights from 2006 include revenue growth of 17% driven by acquisitions and organic growth, achieving $50 million of $125 million in targeted cost savings, and expanding operations through strategic acquisitions totaling $550 million in annual sales. Despite challenges from raw material volatility, Hexion increased operating income by 38% and remains focused on operational efficiencies to generate free cash flow and reduce debt.
Hexion provided a presentation at the Credit Suisse Chemical Conference on September 27, 2007. The presentation included forward-looking statements and non-GAAP financial measures with reconciliations provided. Hexion discussed its strong first half 2007 results, including a 13% increase in revenue and 45% increase in operating income compared to first half 2006. Hexion also summarized its history, diversified business segments, experienced management team, and financial highlights including free cash flow generation and debt maturity profile.
Eaton Corporation's 2002 Annual Report summarizes the company's performance in 2002 and initiatives to transform Eaton into a premier diversified industrial company. Despite challenging market conditions, Eaton outgrew its end markets by $300 million, increased operating earnings per share by 33%, generated a record $900 million in cash flow from operations, and reduced debt by $352 million. The company achieved this performance through implementing a less capital-intensive business model and realizing $130 million in savings from restructuring. The Eaton Business System is driving improvements across the company to capture benefits of scale and efficiency.
This annual report summarizes Lockheed Martin's financial and operational performance in 2010. Some key highlights include:
- Net sales of $45.8 billion, segment operating profit of $5.1 billion, and earnings per share of $7.94.
- Backlog increased to over $78 billion in orders at the end of 2010.
- Progress made on programs such as the F-35, C-5M, missile defense technologies, and GPS III.
- Challenges around managing costs and improving the F-35 program were acknowledged.
The annual report summarizes Perini Corporation's financial performance and operations in 2004. Some key points:
- Revenues increased 34% to $1.84 billion, with strong growth in building and management services revenues. Income from construction operations rose 65% to $50.3 million.
- Perini was named one of Forbes' Best Managed Companies in America and ranked #1 in the construction sector. It also acquired Cherry Hill Construction to expand its civil construction business.
- Perini's management services division continued work on critical overseas projects in Iraq and Afghanistan, including completing the first new power plant in Iraq since 1976.
- Looking ahead, Perini expects continued growth from its core building
The 2005 annual report summarizes Group 1 Automotive's financial performance for the 2005 fiscal year. It discusses record revenues of $6 billion and income of $70.3 million. It provides an overview of the company's operations including its dealership count, brands sold, and acquisition strategy. The CEO letter outlines strategic initiatives to streamline operations and leverage the company's scale, as well as growth targets for acquisitions and same-store sales.
Apresentação p investidores de renda fixa (disponível somente em inglês)Braskem_RI
- Braskem reported its results for the first half of 2003.
- The company achieved synergies of R$208 million in the first six months by merging several petrochemical companies to form Braskem.
- Braskem is the leading petrochemical company in Latin America with the largest production scale at 3,200 kt/year and leadership positions in key segments like polyethylene, polypropylene, and PVC.
Ranbaxy reported higher-than-expected 2QCY2010 results driven by exclusivity sales of Valacyclovir in North America and profit on sale of investments, with net sales up 17% year-over-year and net profit of Rs326cr. Excluding new product sales, operating margins improved marginally to 3-4% due to restructuring. The company expects to resolve ongoing FDA and DOJ issues in the next few months with some penalties.
Holly Corporation operates three petroleum refineries in the western United States with a total refining capacity of 107,500 barrels per day. In 2003, Holly acquired the Woods Cross Refinery from ConocoPhillips and increased its overall refining capacity. Holly also purchased an additional interest in the Rio Grande pipeline joint venture and sold its Iatan crude oil gathering system. Holly reported significant increases in sales, income, earnings per share and other financial metrics in 2003 compared to 2002, demonstrating strong financial performance.
TRW achieved solid financial results in 2005, with sales increasing 5.3% to $12.6 billion and operating income of $553 million, despite challenges in the automotive industry. The company focused on diversifying its customer base, with its largest customer representing only 16.1% of sales. TRW also strengthened its global reach, with 64% of sales coming from outside of North America. The company increased investments in research and engineering to $780 million to develop innovative safety technologies. TRW is well positioned with its expertise in both active and passive safety systems to help automakers further advance vehicle safety.
1. In 1Q12, Terna reported total revenues of €432 million, an increase of 12.2% compared to 1Q11. EBITDA was €340 million, up 15.3% year-over-year.
2. Net income from continuing operations was €114 million, an increase of 19.8% versus the adjusted 1Q11 figure after applying the Robin Hood tax.
3. Total regulated capex was stable at €232 million, with 82% incentivized. Net debt at the end of 1Q12 was €5,273 million, with a fixed/floating ratio of 73/27% and average maturity of 6 years.
PACCAR is a multinational company that manufactures heavy-duty trucks under the Kenworth, Peterbilt, DAF, and Foden brands. It competes in the North American medium-duty market and the European medium and heavy-duty markets. PACCAR also produces industrial winches and competes in the aftermarket parts business. In 2002, PACCAR saw record revenues and more than double the net income of 2001 due to strong product quality, diversification, and technology investments. PACCAR increased its market share in North America and Europe for both medium and heavy-duty trucks.
Apresentação citigroup 14a conferência anual da américa latina (inglês)Braskem_RI
Braskem held its 14th Annual Latin America Conference in New York City in March 2006. The presentation contained forward-looking statements and discussed Braskem's company overview, 4Q05 and FYE 2005 results, and future growth and value creation opportunities. Key highlights included record net income of $270 million in 2005, consistent EBITDA growth since 2002, and sound capital structure with declining financial leverage and average debt maturity of 11 years.
This document provides financial highlights and key metrics for Bank of America Corporation for the year 2000. It summarizes that the company had revenue of $33.25 billion and net income of $7.86 billion for the year. The Chairman also announces that he will retire in April 2001 and that Kenneth D. Lewis will assume the roles of Chairman and CEO upon his retirement, after having led the company through the merger transition period.
The annual report summarizes Molson Coors Brewing Company's financial and operational performance in 2006. Some key highlights include:
- Net sales increased 6.1% to $5.84 billion from $5.51 billion in 2005.
- Net income increased significantly to $361 million in 2006 from $135 million in 2005.
- Total beer and other malt beverages sold increased to 49.5 million hectoliters in 2006 from 47.5 million hectoliters in 2005.
Dr. Reddy's Laboratories reported mixed results for the first quarter of fiscal year 2011. Revenue was largely in line with expectations, though sales in the US were lower than anticipated due to slow new product launches and recovery. Profits were higher than estimated due to lower expenses and tax charges. While the European business continues to face pricing pressures, profits have been improved by cost reductions. The company reiterated its long-term guidance for revenue and return on capital.
F4 corporate and business law-study text-bpp-2011waleed aka wbt
The document provides an overview of studying for the ACCA F4 Corporate and Business Law exam. It discusses the following key points:
1. The exam assesses understanding of legal principles and their application in business contexts. It requires concise writing to address points clearly.
2. Technical knowledge of the legal framework, specific business-related legal areas, and recognition of limitations is important. Practical application of this knowledge to exam scenarios is also required.
3. Key topics covered include the legal system, contracts, torts, employment law, business organizations, financing companies, company management and regulation, insolvency, corporate governance, and fraudulent behavior.
4. Developing concise writing skills
- Unisys Corporation reported a net loss of $72.1 million for the first nine months of 2008 compared to a net loss of $92.9 million for the same period in 2007.
- Revenue from services decreased to $3,486.2 million from $3,579.1 million while revenue from technology decreased to $467.5 million from $537.7 million.
- Operating expenses also decreased from $4,100.3 million to $3,865.2 million but the company still reported a net loss due to higher interest and other expenses.
shaw group 94AC2BEF-AE9A-4207-BADB-56E9EA310D39_BarclaysFebruary2009finance36
The document summarizes the history and growth of The Shaw Group Inc. from its founding in 1987 through 2008. Key events include acquisitions that increased annual revenues from $100M in 1993 to $7B in 2008. Shaw expanded into power, maintenance, nuclear, environmental, and infrastructure services. It secured major contracts for nuclear plant construction in the U.S. and is pursuing international nuclear opportunities, particularly for the AP1000 reactor.
The document is The Shaw Group Inc. 2001 Employee Incentive Compensation Plan. The purpose of the plan is to attract and retain employees, motivate employees to achieve long-term goals, provide competitive compensation, and align employee and shareholder interests. The plan allows for various types of awards including stock options, restricted stock, and performance shares. It defines key terms, outlines plan administration, and establishes limits on the number of shares that may be awarded.
This document is Micron Technology's annual report (Form 10-K) filed with the SEC for the fiscal year ending September 2, 2004. It provides an overview of Micron's business including its primary products (DRAM, Flash memory, CMOS image sensors), manufacturing processes, transition to smaller line widths, and financial results. It also discusses trends, risks, and uncertainties facing the company.
1) Micron Technology reported net income of $193 million on sales of $1.225 billion for its second quarter of fiscal year 2006.
2) Key events included the start of IM Flash Technologies LLC, a NAND flash memory joint venture with Intel, and the consolidation of TECH Semiconductor.
3) Micron ended the quarter with $2.6 billion in cash and short-term investments after generating $880 million in cash from operations.
The document provides financial information for Unisys Corporation, including revenue, costs, expenses, operating income, net income, and earnings per share for quarters ending September 30, 2004 and 2003 and year-to-date periods ending September 30, 2004 and 2003. It also includes balance sheet information as of September 30, 2004 and December 31, 2003 and cash flow information for the nine month periods ending September 30, 2004 and 2003.
Micron Technology announced that it has reached a settlement agreement with a class of direct purchasers in a price-fixing lawsuit regarding DRAM products from 1999-2002. The settlement is subject to court approval. The settlement is expected to reduce Micron's previously reported Q1 2007 earnings by up to $80 million. Micron continues to defend lawsuits from indirect purchasers and various state attorneys general regarding DRAM pricing.
This document is a Form 10-Q quarterly report filed by Unisys Corporation with the SEC for the quarter ended June 30, 2001. The report includes Unisys' consolidated balance sheet, statement of income, statement of cash flows, and notes to the financial statements. It summarizes Unisys' financial performance and position, including reporting a net income of $12.1 million on revenue of $1.46 billion for the quarter.
Hexion presented at the Credit Suisse Chemical Conference on September 27, 2007. The presentation provided an overview of Hexion's strong first half 2007 results, which validated the company's strategy and showed ongoing top-line growth and increased operating income and EBITDA compared to the first half of 2006. The presentation also discussed Hexion's diversified business segments and global footprint, growth initiatives, experienced management team, and strong financial position and free cash flow.
Hexion posted strong year-over-year performance in 2007, with revenues increasing 12% and segment EBITDA growing 17%. Raw material costs increased significantly over the past two years, negatively impacting results. However, Hexion's diversification across end markets and geographies helps offset impacts from any single cyclical segment. The company continues to focus on synergies, six sigma savings, and strategic acquisitions to fuel growth. Management expects these initiatives to further enhance revenues and EBITDA over the long term.
The document is the transcript from Dow Chemical's 4Q and full-year 2008 earnings conference call. Some key points:
- 4Q 2008 sales were $10.9 billion, down 23% from 4Q 2007, with volume down 17% and price down 6%. Earnings per share were -$1.68 compared to $0.49 in 4Q 2007.
- For full-year 2008, sales were $57.5 billion, up 7% due to price increases offsetting a 5% volume decline. Earnings per share were $0.62 compared to $2.99 in 2007.
- Management interventions like plant shutdowns and cost cuts helped generate $1.2 billion in
Duke Energy reported earnings results for the first quarter of 2005. Key highlights included:
- Reported EPS of $0.91 compared to $0.34 in the prior year, though special items impacted results. Excluding special items, EPS was $0.44, up from $0.34.
- Regulated businesses delivered solid earnings and cash flow. DENA realized a segment EBIT loss of $56 million, an improvement from prior year. Field Services benefited from strong NGL prices. International Energy reported higher earnings on increased volumes and prices.
- Special items included gains from asset sales, mark-to-market adjustments, and insurance liability adjustments, totaling $709 million pre-
The 2006 Annual Report for AGCO Corporation provides the following key information:
1) In 2006, AGCO's net sales were $5.4 billion, which were flat compared to 2005. Adjusted earnings per share were $1.12.
2) AGCO exceeded expectations by generating record operating cash flow in 2006, which enabled the company to reduce debt and improve its balance sheet.
3) Going forward, AGCO plans to focus on organic growth through four key brands and increasing its global market position, improving profitability through process harmonization, and optimizing its asset base and working capital requirements.
This document provides financial and operating results for Hess Corporation from 2005 to 2008. Specifically, it shows net income, adjusted earnings, capital expenditures, and exploration expenses by quarter for the Exploration and Production, Marketing and Refining, and Corporate divisions. The Exploration and Production division contributed the majority of net income, while Marketing and Refining had losses in some quarters. Capital expenditures and exploration expenses increased over time for Exploration and Production both in the US and internationally.
The annual report summarizes Perini Corporation's financial performance and operations in 2004. Some key points:
- Revenues increased 34% to $1.84 billion, with growth in building, management services, and lower revenues in civil works.
- Pretax income rose 45% to $44.9 million and net income was $36 million.
- The company had a strong balance sheet with $136 million in cash and only $9 million in debt.
- Perini completed several large projects on time including a casino resort and power plant in Iraq.
- The company aims to leverage its expertise in management services, building, and newly acquired civil contractor.
FMC Technologies is a global leader that has provided customer solutions for over 100 years. It operates manufacturing facilities in 16 countries and designs systems for the energy, food processing, and air transportation industries. In 2001, the company saw strong demand and order backlog growth in its energy business, particularly for subsea oil and gas equipment. However, its food processing and airport systems segments struggled due to economic weakness affecting their customers. The company expects continued growth in energy but uncertainties in its other businesses depending on the speed of economic recovery.
Hess Corporation reported a net loss of $59 million for the first quarter of 2009, compared to net income of $759 million in the first quarter of 2008. Oil and gas production was 390,000 barrels per day, similar to the first quarter of 2008. Exploration and Production generated a loss of $64 million in the first quarter of 2009 versus income of $824 million in the prior year quarter, due to lower oil and gas prices. Marketing and Refining earnings were $102 million, an increase of $86 million from the first quarter of 2008.
Hexion Chemicals held a conference on March 25, 2008 to discuss its financial results and outlook. The presentation contained forward-looking statements and non-GAAP financial measures with reconciliations provided. Hexion achieved strong revenue and earnings growth in 2007 driven by diversification across segments, geographies, and end markets. Management expects volatility in raw material costs to continue into 2008 and remains focused on productivity initiatives, synergies, and strategic acquisitions to fuel further growth.
el paso 160DAEF8-9761-4AE9-925F-15301F29A4B9_2008_Summary_Reportfinance49
This document is El Paso Corporation's 2008 annual report which summarizes the company's financial and operating highlights for 2008. It discusses declines in operating income and earnings compared to previous years due to a $2.7 billion non-cash ceiling test charge in its Exploration & Production segment. However, it notes the Pipeline segment placed seven growth projects into service and increased its backlog of committed growth projects to $8 billion. The report provides an overview of accomplishments in 2008 and challenges faced by the company in a difficult market environment.
el paso 160DAEF8-9761-4AE9-925F-15301F29A4B9_2008_Summary_Reportfinance49
This document summarizes the financial and operating highlights for El Paso Corporation for the years 2008, 2007, and 2006. Some key points include:
- In 2008, El Paso reported a net loss of $860 million compared to net income of $1.073 billion in 2007. Operating revenues were $5.363 billion in 2008.
- Significant non-cash charges in 2008 included $2.7 billion in ceiling test charges for its Exploration & Production segment and a $125 million impairment related to its investment in Four Star.
- Pipeline throughput volumes across El Paso's owned and equity systems increased slightly from 2007 to 2008 but were up overall from 2006 levels. Exploration and production of natural gas declined slightly from
The Timken Company maintained profitability in 1999 despite weaknesses in many markets. The company achieved its third highest sales ever and reduced inventory days for the third consecutive year. Looking ahead, Timken is transforming its organization into a more global business with new leadership and a broader product portfolio to fuel growth and take advantage of improving business conditions in 2000.
The document provides an earnings review for 2004 and outlook for 2005 from Duke Energy Corporation. Some key points:
- 2004 ongoing earnings per share were $1.38, exceeding the target of $1.20. Several business units performed well while DENA losses were lower than expected.
- Goals for 2005 include ongoing earnings per share of $1.60, ongoing segment EBIT growth across most business units, and further reducing debt and risks.
- DENA is expected to post a $150 million ongoing segment EBIT loss for 2005 as it focuses on defining a sustainable long-term business model.
Satellite TV dishes on tens of millions of homes and seamless global telephone service are some developing markets driving a $70 billion satellite and wireless industry. Hughes is uniquely positioned to take advantage of opportunities in this industry due to its leadership in satellite and wireless systems, proven record of innovation, strong finances, and highly skilled workforce.
The document discusses the CEO's reflections on his time leading the company from 1991 to 1997 and the improvements made in delivering returns to shareholders. It highlights initiatives taken over the years to upgrade operations and portfolio, resulting in industry-leading returns. The CEO expresses pride in achievements but says more progress is needed. The new CEO is tasked with building on the foundation to further adapt to industry changes and accelerate improvements.
Marathon Oil Corporation reported first quarter 2008 net income of $731 million, slightly lower than the first quarter of 2007. Adjusted net income excluding special items was $767 million, up 9% from the prior year. Upstream and integrated gas segments performed strongly due to higher hydrocarbon prices and production volumes. Downstream results were negatively impacted by lower refining margins and planned maintenance. The company continued share repurchases and major project work during the quarter.
This document provides an overview of a presentation given by Cynthia S. Guenther, Vice President of Investor Relations at Lehman Brothers Industrial Select Conference on February 14, 2006. The presentation discusses Avery Dennison's business segments, including pressure-sensitive materials, office and consumer products, and retail information services. It provides data on organic sales growth and operating margins for each segment in 2005 and 2004. The presentation establishes that Avery Dennison is a market leader in all of its key businesses, including being the number one provider of paper and film roll materials for labels.
This document is a Form 10-Q quarterly report filed by Unisys Corporation with the SEC for the quarter ending March 31, 2001. It includes Unisys' consolidated balance sheet, statement of income, statement of cash flows, and notes to the financial statements. The financial statements show that for the quarter, Unisys reported revenue of $1.6 billion, net income of $69.3 million, and ended the quarter with $326 million in cash and cash equivalents.
This document is a Form 10-Q quarterly report filed by Unisys Corporation with the Securities and Exchange Commission for the quarter ending September 30, 2001. The report includes Unisys' consolidated balance sheet, statement of income, and statement of cash flows for the periods. It shows that for the quarter, Unisys reported revenue of $1.376 billion and net income of $20.9 million. For the nine months, revenue was $4.461 billion and net income was $102.3 million.
This document is Unisys Corporation's annual report (Form 10-K) filed with the Securities and Exchange Commission for the fiscal year ending December 31, 2001. It summarizes Unisys' business operations, principal products and services, customers, competition, research and development activities, and other details. Unisys has two business segments - Services and Technology. The Services segment provides consulting, outsourcing, and other services, while the Technology segment develops servers and related products. Major customers include companies in financial services, communications, and the US government.
This document is a Form 10-Q quarterly report filed by Unisys Corporation with the Securities and Exchange Commission for the quarterly period ended March 31, 2002. The report includes Unisys' consolidated balance sheet, statement of income, and statement of cash flows for the periods ended March 31, 2002 and 2001. It also includes notes to the financial statements providing additional details on earnings per share calculations, adoption of new accounting standards, segment information, and other items.
This document is a SEC Form 10-Q filing for Unisys Corporation for the quarterly period ended June 30, 2002. It includes Unisys' consolidated balance sheet, statement of income, and statement of cash flows for the periods. The filing shows that for the six months ended June 30, 2002, Unisys reported revenue of $2.72 billion and net income of $74.9 million. Cash and cash equivalents decreased to $201.1 million as of June 30, 2002 from $325.9 million as of December 31, 2001.
This document is a quarterly report filed with the SEC by Unisys Corporation for the quarter ending September 30, 2002. It includes Unisys' consolidated balance sheet, income statement, and cash flow statement for the periods shown. The balance sheet shows the company had total assets of $5.48 billion against total liabilities and stockholders' equity of the same amount. The income statement indicates net income of $59 million for the quarter on revenues of $1.33 billion. Cash flow from operations was $70 million for the first nine months of the year. Notes to the financial statements provide additional details on earnings per share calculations and the impact of a new accounting standard for goodwill.
This document is the Unisys Corporation's annual report (Form 10-K) filed with the Securities and Exchange Commission for the fiscal year ending December 31, 2002. It provides information on Unisys' business segments of Services and Technology, its principal products and services, markets, materials, intellectual property, seasonality, customers, backlog, and competition. Unisys is a global information technology company offering systems integration, outsourcing, infrastructure services, server technology, and consulting. Its major customers include governments and companies in financial services, communications and other industries.
This document is Unisys Corporation's quarterly report filed with the SEC for the quarter ending March 31, 2003. It includes the consolidated balance sheet, income statement, cash flow statement, and notes for the quarter. The balance sheet shows total assets of $5.1 billion including $433.1 million in cash. Total liabilities were $1.9 billion including long-term debt of $1.0 billion. Stockholders' equity was $901.6 million. The income statement shows revenue of $1.4 billion and net income of $38.5 million. Cash flow from operations was negative $64.9 million for the quarter.
Unisys Corporation filed a Form 10-Q with the SEC for the quarterly period ended June 30, 2003. The filing includes Unisys' consolidated balance sheet, income statement, and notes to the financial statements. For the quarter, Unisys reported revenue of $1.425 billion, net income of $52.5 million, and earnings per share of $0.16. Year-to-date, Unisys reported revenue of $2.824 billion, net income of $91 million, and earnings per share of $0.28. As of June 30, 2003, Unisys had total assets of $5.155 billion and total stockholders' equity of $1.002 billion
This document is Unisys Corporation's quarterly report filed with the SEC for the third quarter of 2003. It includes Unisys' consolidated balance sheet, income statement, and cash flow statement for the periods ended September 30, 2003 and 2002. Key details include total revenue of $1.45 billion for Q3 2003, net income of $56.2 million, and basic earnings per share of $0.17. For the nine months ended September 30, 2003, total revenue was $4.27 billion and net income was $147.2 million.
This document is a Form 10-K filed by Unisys Corporation with the Securities and Exchange Commission for the fiscal year ended December 31, 2003. It provides an overview of Unisys, including that it is a global information technology company with Services and Technology business segments. It describes Unisys' principal products and services in each segment, as well as information on customers, materials, patents, seasonality, backlog, and competition.
This document is Unisys Corporation's quarterly report filed with the SEC for the quarter ended March 31, 2004. It includes Unisys' consolidated balance sheets, statements of income, and statements of cash flows for the quarters ended March 31, 2004 and 2003. For the quarter ended March 31, 2004, Unisys reported revenue of $1.46 billion and net income of $28.9 million.
Unisys Corporation reported financial results for the first quarter of 2004 and 2003. Revenue increased slightly from $1.4 billion to $1.46 billion year-over-year. Net income was $28.9 million compared to $38.5 million in the prior year. Earnings per share were $0.09 compared to $0.12. The company also provided supplemental non-GAAP information excluding pension expenses/income to enhance understanding of operational performance. Free cash flow was $16.1 million compared to negative $154.3 million in the prior year period.
This SEC filing is Unisys Corporation's quarterly report on Form 10-Q for the quarter ended June 30, 2004. It includes Unisys' consolidated financial statements, including their balance sheet, income statement, and statement of cash flows for the quarter. It also provides notes to the financial statements and breaks down revenue and operating results by business segment. The filing provides investors with Unisys' financial performance and position for the quarter according to US GAAP and SEC regulations.
- Unisys Corporation reported consolidated financial results for the second quarter and first half of 2004 compared to the same periods in 2003.
- Total revenue was $1.388 billion for Q2 2004 compared to $1.425 billion for Q2 2003. Net income was $19.4 million for Q2 2004 compared to $52.5 million for Q2 2003.
- For the first half of 2004, total revenue was $2.851 billion compared to $2.824 billion for the first half of 2003. Net income was $48.3 million for the first half of 2004 compared to $91 million for the same period of 2003.
This document is a Form 10-Q quarterly report filed by Unisys Corporation with the SEC for the quarter ended September 30, 2004. The report includes Unisys' consolidated financial statements and notes. It summarizes that for the quarter, Unisys reported revenue of $1.45 billion, operating income of -$38 million, and net income of $25.2 million. Additionally, the report notes a $82 million pretax restructuring charge related to headcount reductions of approximately 1,400 employees and facility consolidation.
This document is a Form 10-K filed by Unisys Corporation with the Securities and Exchange Commission for the fiscal year ended December 31, 2004. It provides an overview of Unisys' business operations, organizational structure, products and services, facilities, legal proceedings, executive officers, and financial performance. Unisys has two business segments - Services and Technology. It provides a variety of IT services and solutions, as well as proprietary servers and technologies. Key details in the filing include a description of Unisys' major markets, suppliers, patents, backlog, competition, research and development expenses, environmental matters, international presence, and available information.
- Unisys Corporation reported revenue of $1.524 billion for Q4 2004, down from $1.637 billion in Q4 2003, and revenue of $5.821 billion for 2004, down from $5.911 billion in 2003.
- Net income was $34.9 million loss for Q4 2004 compared to net income of $111.5 million in Q4 2003, and net income was $38.6 million for 2004 compared to $258.7 million in 2003.
- Cash and cash equivalents increased to $660.5 million at the end of 2004 from $635.9 million at the end of 2003.
This document is a SEC Form 10-Q filing for Unisys Corporation for the quarterly period ending March 31, 2005. It includes Unisys' consolidated balance sheets, statements of income, and statements of cash flows for the periods. For the quarter, Unisys reported a net loss of $45.5 million on revenue of $1.37 billion, compared to net income of $28.9 million on revenue of $1.46 billion in the same period the previous year. Cash and cash equivalents decreased to $441.6 million at the end of the quarter from $660.5 million at the end of 2004.
- Unisys Corporation reported a net loss of $45.5 million for the first quarter of 2005 compared to net income of $28.9 million in the same period of 2004. Revenue decreased 6.6% to $1.37 billion.
- The services segment saw a revenue decrease of 5.1% to $1.11 billion while the technology segment's revenue decreased 13.1% to $259 million.
- Cash provided by operating activities was $26.8 million, down from $129.2 million in the prior year, due to a net loss, decreases in receivables and accounts payable, and an income tax payment.
University of North Carolina at Charlotte degree offer diploma Transcripttscdzuip
办理美国UNCC毕业证书制作北卡大学夏洛特分校假文凭定制Q微168899991做UNCC留信网教留服认证海牙认证改UNCC成绩单GPA做UNCC假学位证假文凭高仿毕业证GRE代考如何申请北卡罗莱纳大学夏洛特分校University of North Carolina at Charlotte degree offer diploma Transcript
STREETONOMICS: Exploring the Uncharted Territories of Informal Markets throug...sameer shah
Delve into the world of STREETONOMICS, where a team of 7 enthusiasts embarks on a journey to understand unorganized markets. By engaging with a coffee street vendor and crafting questionnaires, this project uncovers valuable insights into consumer behavior and market dynamics in informal settings."
In a tight labour market, job-seekers gain bargaining power and leverage it into greater job quality—at least, that’s the conventional wisdom.
Michael, LMIC Economist, presented findings that reveal a weakened relationship between labour market tightness and job quality indicators following the pandemic. Labour market tightness coincided with growth in real wages for only a portion of workers: those in low-wage jobs requiring little education. Several factors—including labour market composition, worker and employer behaviour, and labour market practices—have contributed to the absence of worker benefits. These will be investigated further in future work.
A toxic combination of 15 years of low growth, and four decades of high inequality, has left Britain poorer and falling behind its peers. Productivity growth is weak and public investment is low, while wages today are no higher than they were before the financial crisis. Britain needs a new economic strategy to lift itself out of stagnation.
Scotland is in many ways a microcosm of this challenge. It has become a hub for creative industries, is home to several world-class universities and a thriving community of businesses – strengths that need to be harness and leveraged. But it also has high levels of deprivation, with homelessness reaching a record high and nearly half a million people living in very deep poverty last year. Scotland won’t be truly thriving unless it finds ways to ensure that all its inhabitants benefit from growth and investment. This is the central challenge facing policy makers both in Holyrood and Westminster.
What should a new national economic strategy for Scotland include? What would the pursuit of stronger economic growth mean for local, national and UK-wide policy makers? How will economic change affect the jobs we do, the places we live and the businesses we work for? And what are the prospects for cities like Glasgow, and nations like Scotland, in rising to these challenges?
Independent Study - College of Wooster Research (2023-2024) FDI, Culture, Glo...AntoniaOwensDetwiler
"Does Foreign Direct Investment Negatively Affect Preservation of Culture in the Global South? Case Studies in Thailand and Cambodia."
Do elements of globalization, such as Foreign Direct Investment (FDI), negatively affect the ability of countries in the Global South to preserve their culture? This research aims to answer this question by employing a cross-sectional comparative case study analysis utilizing methods of difference. Thailand and Cambodia are compared as they are in the same region and have a similar culture. The metric of difference between Thailand and Cambodia is their ability to preserve their culture. This ability is operationalized by their respective attitudes towards FDI; Thailand imposes stringent regulations and limitations on FDI while Cambodia does not hesitate to accept most FDI and imposes fewer limitations. The evidence from this study suggests that FDI from globally influential countries with high gross domestic products (GDPs) (e.g. China, U.S.) challenges the ability of countries with lower GDPs (e.g. Cambodia) to protect their culture. Furthermore, the ability, or lack thereof, of the receiving countries to protect their culture is amplified by the existence and implementation of restrictive FDI policies imposed by their governments.
My study abroad in Bali, Indonesia, inspired this research topic as I noticed how globalization is changing the culture of its people. I learned their language and way of life which helped me understand the beauty and importance of cultural preservation. I believe we could all benefit from learning new perspectives as they could help us ideate solutions to contemporary issues and empathize with others.
Enhancing Asset Quality: Strategies for Financial Institutionsshruti1menon2
Ensuring robust asset quality is not just a mere aspect but a critical cornerstone for the stability and success of financial institutions worldwide. It serves as the bedrock upon which profitability is built and investor confidence is sustained. Therefore, in this presentation, we delve into a comprehensive exploration of strategies that can aid financial institutions in achieving and maintaining superior asset quality.
Vicinity Jobs’ data includes more than three million 2023 OJPs and thousands of skills. Most skills appear in less than 0.02% of job postings, so most postings rely on a small subset of commonly used terms, like teamwork.
Laura Adkins-Hackett, Economist, LMIC, and Sukriti Trehan, Data Scientist, LMIC, presented their research exploring trends in the skills listed in OJPs to develop a deeper understanding of in-demand skills. This research project uses pointwise mutual information and other methods to extract more information about common skills from the relationships between skills, occupations and regions.
Discover the Future of Dogecoin with Our Comprehensive Guidance36 Crypto
Learn in-depth about Dogecoin's trajectory and stay informed with 36crypto's essential and up-to-date information about the crypto space.
Our presentation delves into Dogecoin's potential future, exploring whether it's destined to skyrocket to the moon or face a downward spiral. In addition, it highlights invaluable insights. Don't miss out on this opportunity to enhance your crypto understanding!
https://36crypto.com/the-future-of-dogecoin-how-high-can-this-cryptocurrency-reach/
Falcon stands out as a top-tier P2P Invoice Discounting platform in India, bridging esteemed blue-chip companies and eager investors. Our goal is to transform the investment landscape in India by establishing a comprehensive destination for borrowers and investors with diverse profiles and needs, all while minimizing risk. What sets Falcon apart is the elimination of intermediaries such as commercial banks and depository institutions, allowing investors to enjoy higher yields.
Fabular Frames and the Four Ratio ProblemMajid Iqbal
Digital, interactive art showing the struggle of a society in providing for its present population while also saving planetary resources for future generations. Spread across several frames, the art is actually the rendering of real and speculative data. The stereographic projections change shape in response to prompts and provocations. Visitors interact with the model through speculative statements about how to increase savings across communities, regions, ecosystems and environments. Their fabulations combined with random noise, i.e. factors beyond control, have a dramatic effect on the societal transition. Things get better. Things get worse. The aim is to give visitors a new grasp and feel of the ongoing struggles in democracies around the world.
Stunning art in the small multiples format brings out the spatiotemporal nature of societal transitions, against backdrop issues such as energy, housing, waste, farmland and forest. In each frame we see hopeful and frightful interplays between spending and saving. Problems emerge when one of the two parts of the existential anaglyph rapidly shrinks like Arctic ice, as factors cross thresholds. Ecological wealth and intergenerational equity areFour at stake. Not enough spending could mean economic stress, social unrest and political conflict. Not enough saving and there will be climate breakdown and ‘bankruptcy’. So where does speculative design start and the gambling and betting end? Behind each fabular frame is a four ratio problem. Each ratio reflects the level of sacrifice and self-restraint a society is willing to accept, against promises of prosperity and freedom. Some values seem to stabilise a frame while others cause collapse. Get the ratios right and we can have it all. Get them wrong and things get more desperate.
2. A Global Leader
Financial Highlights
(Dollars in millions, except per share data)
Year Ended December 31,
Income Statement Data 2006 (1) 2005(2)
Net Sales $5,205 $4,442
Hexion Specialty Chemicals, Inc.
Gross Profit 720 661
Based in Columbus, Ohio, Hexion Specialty Chemicals is
Operating Income 286 208
Net Income (Loss) (109) (87)
the global leader in thermoset resins. Hexion serves the
Net Loss Available to Common Shareholders (1.72) (1.41)
global wood and industrial markets through a broad range
(1) Net sales in 2006 include the acquisition of the coatings business from The Rhodia Group (“Coatings
of thermoset technologies, specialty products and technical
Acquisition”) and the global ink and adhesive resins business of Akzo Nobel (“Inks Acquisition”) from January
31, 2006 and June 1, 2006, respectively, and exclude the results from the Brazilian Consumer Divestiture since
support for customers in a diverse range of applications
March 31, 2006. Net sales in 2005 include Bakelite results from the date of acquisition, April 29, 2005.
(2) Includes data for Bakelite Aktiengesellschaft from its date of acquisition by Borden Chemical, Inc., on April 29, 2005.
and industries. Additional information is available at
www.hexion.com.
Balance Sheet Data
Current Assets $1,478 $1,375
Total Assets 3,508 3,209
Current Liabilities 1,111 908
Total Liabilities 4,909 3,758
Key Products Market Position/Description
Total Liabilities, Redeemable Preferred Stock, 3,508 3,209
Common Stock and Shareholder’s Deficit
Forest Product Resins #1 in N. America
Formaldehyde #1 Globally
Segment EBITDA (1) (2)
Epoxy Resins #1 Globally
$271
Epoxy and Phenolic Resins
Foundry Resins #1 in N. America
$244
Formaldehyde and $152
Molding Compounds #1 in Europe
Forest Product Resins
$152
Coatings and Inks Ink Resins #1 Globally
$81
$63
Versactic Acids & Derivatives #1 Globally
Performance Products $65 2006
$52 2005
Global leadership position
Oil Field Resins
(42% market share)
(1) Management believes that earnings before interest, taxes, depreciation and amortization (EBITDA) is a
meaningful indicator of financial performance. EBITDA is not intended to represent any measure of performance
Global leadership position
in accordance with generally accepted accounting principles, or GAAP, and the company’s calculation and use
of this measure may differ from other companies. These non-GAAP measures should not be used in isolation or
Composite Resins (44% market share in
as a substitute for measures of performance or liquidity and should not be considered an alternative to net loss
North America and Europe)
under GAAP for purposes of evaluating the company’s results of operations, prepared in accordance with
GAAP. Please see our full Form 10-K filed with the U.S. Securities and Exchange Commission.
(2) Corporate and Other segment primarily represents certain corporate general and administrative expenses that are
not allocated to the segments. In 2006, Corporate and Other expenses totaled ($45) compared to ($43) in 2005.
3. A Letter from the Chairman
To Our Stakeholders
Hexion Specialty Chemicals, Inc. strengthened One unified company Financial results included 2006 net sales of $5.2 billion,
an increase of 17 percent, and a net loss of $109 million.
its position in 2006 as the world’s largest On any given day, our products will bind, bond and coat
Hexion posted Adjusted EBITDA of $664 million, which
applications for more than 11,000 customers in more
thermoset resin company through strong includes our unrealized synergies and the pro forma impact
than 100 countries. These customers use any number
of acquisitions. (Please see footnote.) The impact of our
revenue growth, continued global expansion of Hexion specialty product platforms, including:
top-line growth coupled with our cost control efforts can
and leveraging our diversified product portfolio. Phenolic and epoxy resins, as well as versatic
n
be seen at the operating income level, where the company
acids and derivatives;
With market leading positions for the majority posted an increase of approximately 38 percent compared
to the prior year’s operating income. Selling, general and
Coatings, performance adhesives, specialty polymers,
n
of our key products, we offer a unique value administrative expenses were a modest 7.4 percent of net
molding compounds and ink raw materials; and
creation platform that far exceeds sales and were lower than 2005 levels. In addition, following
Formaldehyde and formaldehyde-based binding
n
our recapitalization process in November 2006, net debt
the inherent strengths of the and bonding resins.
at year-end was approximately $3.3 billion.
individual companies that merged The result is a leading specialty chemical company with
a No. 1 or No. 2 market share position in more than
to create Hexion in 2005. 75 percent of our revenue base. As a vertically integrated,
Thermoset resins are heat-activated
low-cost manufacturer with the scale, cost structure and
materials used in bonding, binding
skilled employee base to compete on a global basis,
As a leading specialty chemical company, much of our progress
and coating applications for thousands
our 104 plants are located throughout North America,
this year was driven by the strength of our core technologies, Latin America, Europe and the Asia-Pacific region. Our
of everyday products.
strong customer relationships and the mission-critical nature of expanded range of products, technologies and technical
thermoset resins. Thermoset resins are heat-activated materials support serves many industries and appeals to a diverse
used in bonding, binding and coating applications for thousands customer base. Our customers include familiar names
of everyday products. Our resin systems deliver essential like 3M, BASF, Bayer, DuPont, General Electric, Halliburton, In addition, Hexion continued to realize financial synergies
performance properties as a critical ingredient in adhesives, Honeywell, Owens Corning, PPG Industries, Brenntag, as planned. Integration teams worked to identify and capture
paints, and coatings, and as binding and bonding agents Saint-Gobain, Mitsui, Sumitomo, Sun Chemicals, Valspar additional savings in operations, raw materials purchasing,
used in materials across a wide range of industries. and Weyerhaeuser. Our thermoset resins ultimately corporate infrastructure and other areas to achieve these
help make these customers’ products lighter, stronger, synergies. By year-end 2006, we had achieved $70 million
more adhesive or more durable, while meeting any of the $125 million in targeted cost savings, known as
Looking ahead, Hexion is squarely focused on creating value
number of exacting performance requirements for the “Phase I synergies.” By year-end 2007, we expect to
for our stakeholders by driving operational efficiencies and
specific application. have taken all the actions necessary to achieve the full
generating free cash flow as we further build our position as
$125 million in Phase I synergies. Hexion also identified
a global leader. We were encouraged by the strong demand 2006 results
$50 million in Phase II synergies.
in 2006 for many of our products and the rapidly growing
Despite the dramatic raw material volatility experienced
applications in wind energy, aerospace, electronics, oilfield While a number of one-time integration and transaction costs,
throughout the year, Hexion posted improved revenues,
services, highly-specialized versatic coatings and others that as well as expenses associated with the extinguishment of
operating margins and earnings before interest, taxes,
utilize our resin materials. debt, impacted our earnings in 2006, we believe the strength
depreciation and amortization (EBITDA) from continuing
of Hexion’s underlying business is solid. We will continue to
operations in 2006. The increases were fueled by both
focus on maintaining operational discipline and controlling
organic growth from our existing customer base and several
costs, with a focus on generating free cash flow, achieving
accretive “bolt-on” acquisitions. More importantly, because of
synergies and reducing net debt over time. I encourage
our scale and diversification, Hexion benefits from a balanced
you to review Hexion’s full financial results found in our
revenue stream, with no one customer accounting for more
Form 10-K Annual Report on file with the U.S. Securities
than three percent of sales.
and Exchange Commission.
4. A Letter from the Chairman (continued)
2006 Highlights
Expanding Our Footprint: We made several
Building upon process One global mission
A platform for growth
strategic acquisitions during 2006 in the Coatings
Hexion is building a culture based on common business Looking ahead, Hexion will continue the process
Hexion helps customers across a broad range of industries
and Inks segment. These transactions, along with
processes across our global organization. This takes many of creating a world-class business that delivers
bring improved products to market. Our growth is linked to
several small acquisitions, contributed $331 million
forms, such as further aligning our research and technology value to the marketplace. We will work hard to
how successful we can be in helping our customers’ meet
teams with our business units to serve specific marketplace continue to deliver improved financial results and
their applications and product development needs and grow in incremental sales.
needs. We are also measuring new product development decrease net debt. I am proud of the efforts of
their businesses. It also depends on nurturing growth from
as a percentage of sales in order to track our progress in our team of approximately 7,000 associates who
existing and new product lines and pursuing acquisitions that
Extending Credit Maturities: We amended
innovation. We expect this effort to continue to stimulate remained focused on serving our customers
enhance our technology, market or geographic footprint.
and restated our senior secured credit facilities
growth as our expanded teams gain further experience during a year of organizational change.
As part of our growth plans, Hexion completed a number of
working together. In addition, our Six Sigma program is and repaid, repurchased or redeemed certain
We are well positioned for future growth. I am
strategic “bolt-on” acquisitions during 2006, including: the
aggressively spreading a planning discipline through our
excited about the potential of Hexion and the
decorative coatings and adhesives business unit of the Rhodia debt. We used $397 million of the proceeds to
organization as these quality and process control initiatives
opportunities we have as a world leader in the
Group; the global ink and adhesive resins business of Akzo
redeem our preferred stock and $500 million of
are a key part of our productivity and cost savings efforts.
specialty chemicals arena.
Nobel; and the global wax compounds business of Rohm
the proceeds to fund a common stock dividend
Another key measure for our organization is our environmental
and Haas Company. In January 2007, we also completed
to our shareholders.
health and safety performance. We significantly reduced safety
the acquisition of the adhesives and resins business of Orica
Sincerely,
incidents throughout the year, resulting in an occupational injury
Limited, further strengthening our presence in the forest
and illness rate that placed Hexion within the upper quartile
products marketplace in the Asia-Pacific region. In total,
Achieving Synergies: We realized $50 million of
of chemical companies. We improved our environmental
these acquisitions represented approximately $550 million
planned synergies in 2006 and are on pace to meet
performance across a range of metrics including spills and
in annual net sales based on historical revenue of the
Craig O. Morrison
or exceed our planned $125 million of synergies by
releases, permit exceedences and emissions. Excellence in
respective acquisitions.
Chairman, President and Chief Executive Officer
safety and environmental performance is vitally important to our the end of 2007.
people, our customers and the communities in which we operate.
Hexion will continue to set aggressive goals in this area.
Recovering Pricing: Despite experiencing
Hexion’s growth is also linked to how effectively we can Footnote
We were encouraged by the significant volatility in our raw material costs and
develop our global workforce. We are focused on creating a Management also believes that earnings before interest, taxes,
strong demand in 2006 for many depreciation and amortization (EBITDA) is a meaningful indicator phenol and methanol prices remaining at historically
culture that is flexible, open, and collaborative—one that of financial performance. EBITDA is not intended to represent
high levels at year-end 2006, Hexion was able to
promotes teamwork, leverages the discipline of process and
of our products and the rapidly any measure of performance in accordance with generally
accepted accounting principles, or GAAP, and the company’s
rewards performance. Teamwork is vital as we work across pass along most of these increased costs in many
growing applications in wind calculation and use of this measure may differ from other
markets and geographies to effectively serve our customers. companies. These non-GAAP measures should not be used in
of our product lines.
energy, aerospace, electronics, Process is critical to optimize efficiencies and best practices isolation or as a substitute for measures of performance or
liquidity and should not be considered an alternative to net loss
across our global operations, and to enable us to “scale up”
oilfield services, highly-specialized under GAAP for purposes of evaluating the company’s results of
Serving Customers Via a Diverse Portfolio:
by efficiently absorbing additional acquisitions and businesses. operations, prepared in accordance with GAAP. Please see our
versatic coatings. full Form 10K filed with the U.S. Securities and Exchange
And we believe rewarding performance enables us to attract, We experienced strong customer demand for a
Commission.
develop and retain a world-class workforce.
number of our products, including epoxy resins
and intermediates, phenolic specialty resins, oilfield
services and international forest product resins
and formaldehyde applications, helping partially
offset softer demand in products associated with
North American residential new construction and
automotive markets.
5. 2006 Annual Report
This Is Hexion
Hexion holds leading market share
positions in 75 percent of its revenue
based on its complete range of thermoset
resin technologies, strong technical service
component and a vertically integrated,
Hexion Specialty Chemicals is the world’s
low-cost manufacturing base.
largest producer of thermoset resins, with
2006 net sales exceeding $5.2 billion and
leading positions across various end-markets
and geographies. With approximately 7,000 Epoxy and Phenolic Resins – 2006 Net Sales $2,152 (dollars in millions)
employees and 104 sites, Hexion serves the Major Products: Primary Application:
n Epoxy Resins and Intermediates n Adhesive and Structural
global wood and industrial markets through n Composite Resins n Adhesive and Structural
a broad range of thermoset technologies, n Molding Compounds n Adhesive and Structural
n Formaldehyde-based Resins and Intermediates:
specialty products and technical support – Phenolic Specialty Resins Adhesive and Structural
n
for customers in a diverse range of n Epoxy Coating Resins Coating
n
n Versatic Acids and Derivatives Coating
n
applications and industries.
Formaldehyde and Forest Products Resins – 2006 Net Sales $1,385
Major Products: Primary Application:
n Formaldehyde-based Resins and Intermediates:
– Forest Products Resins Adhesive and Structural
n
– Formaldehyde Applications Adhesive and Structural
n
Coatings and Inks – 2006 Net Sales $1,254
Major Products: Primary Application:
n Polyester Resins n Coating
n Alkyd Resins n Coating
n Acrylic Resins n Coating
n Ink Resins and Additives n Coating
Performance Products – 2006 Net Sales $414
Major Products: Primary Application:
n Phenolic Encapsulated Substrates n Adhesive and Structural
6. Selected Financial Statements Hexion Specialty Chemicals, Inc.
n
Consolidated Consolidated
Statements of Operations Balance Sheets
Year Ended December 31,
(In millions)
(In millions, except share and per share data)
ASSETS 2006 2005
2006 2005 2004
Current Assets
Net sales $ 5,205 $ 4,442 $ 2,019
Cash and equivalents $ 64 $ 183
Cost of sales 4,485 3,781 1,785 Accounts receivable (less allowance for doubtful accounts of $21 and $19, respectively) 763 589
Inventories:
Gross profit 720 661 234
Finished and in-process goods 362 287
Selling, general & administrative expense 384 391 163 Raw materials and supplies 187 146
Other current assets 102 131
Transaction costs 20 44 56
Assets of discontinued operations — 39
Integration costs 57 13 — Total Current Assets 1,478 1,375
Other Assets 107 103
Other operating (income) expense, net (27) 5 6
Property and Equipment
Operating income 286 208 9 Land 96 62
Buildings 276 205
Interest expense 242 203 117
Machinery and equipment 2,009 1,779
Loss on extinguishment of debt 121 17 — 2,381 2,046
Less accumulated depreciation (830) (655)
Other non-operating expense, net 3 16 5
1,551 1,391
Loss from continuing operations before income tax, earnings from
Goodwill 193 164
(80) (28) (113)
unconsolidated entities and minority interest
Other Intangible Assets, net 179 176
Income tax expense 14 48 — $ 3,508 $ 3,209
Total Assets
Loss from continuing operations before earnings from unconsolidated
(94) (76) (113)
entities and minority interest
LIABILITIES, REDEEMABLE PREFERRED STOCK AND SHAREHOLDER’S DEFICIT (In millions, except share and per share data)
Earnings from unconsolidated entities, net of taxes 3 2 —
Current Liabilities
Minority interest in net (income) loss of consolidated subsidiaries (4) (3) 8
Accounts and drafts payable $ 616 $ 493
Loss from continuing operations (95) (77) (105) Debt payable within one year 66 38
Interest payable 58 45
Loss from discontinued operations (14) (10) —
Income taxes payable 108 91
Net loss (109) (87) (105) Other current liabilities 263 216
Liabilities of discontinued operations — 25
Accretion of redeemable preferred stock 33 30 —
Total Current Liabilities 1,111 908
Net loss available to common shareholders (142) (117) (105) Long-Term Liabilities
Long-term debt 3,326 2,303
Comprehensive loss $ (11) $ (172) $ (36)
Long-term pension obligations 197 200
Basic and Diluted Per Share Data Non-pension postemployment benefit obligations 26 117
Deferred income taxes 142 138
Loss from continuing operations $ (1.55) $ (1.30) $ (1.27)
Other long-term liabilities 107 92
Loss from discontinued operations (0.17) (0.11) — Total Liabilities 4,909 3,758
Minority interest in consolidated subsidiaries 13 11
Net loss available to common shareholders $ (1.72) $ (1.41) $ (1.27)
Commitments and Contingencies
Common stock dividends declared $ 6.12 $ 6.66 $ — Redeemable Preferred Stock - $0.01 par value; liquidation preference $25 per share;
— 364
60,000,000 shares authorized, 14,781,959 issued and outstanding at December 31, 2005
Weighted average number of common shares outstanding during the period—
82,583,068 82,629,906 82,629,906
basic and diluted Shareholder’s Deficit
Common stock - $0.01 par value; 300,000,000 shares authorized, 170,605,906 issued
and 82,556,847 outstanding at December 31, 2006; 300,000,000 shares authorized, 1 1
170,678,965 issued and 82,629,906 outstanding at December 31, 2005
Additional paid-in (deficit) capital (17 ) 515
Treasury stock, at cost – 88,049,059 shares (296) (296)
Accumulated other comprehensive income (loss) 81 (70)
Accumulated deficit (1,183) (1,074)
This Summary Annual Report is intended to provide investors with an overview of Hexion Specialty Chemicals, Inc. and our businesses, our performance
in 2006 and our plans for the future. It does not include nor is it intended as a substitute for the information contained in our Annual Report on Form 10-K Total Shareholder’s Deficit (1,414) (924)
for the year ended December 31, 2006 on file with the U.S. Securities and Exchange Commission. Investors and others interested in the company are
$ 3,508 $ 3,209
Total Liabilities, Redeemable Preferred Stock and Shareholder’s Deficit
encouraged to carefully review the Form 10-K and other Hexion Specialty Chemicals, Inc. filings with the SEC to obtain a more complete understanding
of the company and its operations.
7. Selected Financial Statements Hexion Specialty Chemicals, Inc.
Selected Financial Statements Hexion Specialty Chemicals, Inc. n
n
Consolidated Statements of Shareholder’s
Consolidated
Deficit and Comprehensive Income
Statements of Cash Flows
Year Ended December 31, Accumulated
(In millions) Common Paid-in Treasury Receivable Other Accumulated Total
2006 2005 2004 Stock Capital Stock from Parent Comprehensive Deficit
(Loss) Income (a)
Cash Flows Provided by (used in) Operating Activities
(In millions)
Net loss $ (109) $ (87 ) $ (105 )
Balance, December 31, 2003 $ 1 $ 143 $ — $ — $ 82 $ (74) $ 152
Adjustments to reconcile net loss to net cash provided by (used in) operating activities:
Depreciation and amortization 171 147 86
Net loss — — — — — (105) (105 )
Loss on sale of discontinued operations 14 — —
Gain on sale of businesses, net of taxes (33) (2 ) (1) Translation adjustments — — — — 67 — 67
Write-off of deferred IPO costs 15 — —
2
Minimum pension liability adjustment, net of tax — — — — 2 —
Write-off of deferred financing fees 27 11 —
Minority interest in net income of consolidated subsidiaries 4 3 (8) Comprehensive loss — — — — — — (36 )
Stock based compensation expense 6 12 4
Acquisition of Resolution Specialty to Consolidated group — 57 — — — — 57
Deferred tax benefit (18) (3 ) (3)
Amortization of deferred financing fees 9 9 5 Acquisition of Borden Chemical to Consolidated group — 1,252 (296) (542) (131) (817) (534 )
Debt redemption interest adjustment 6 — —
Interest accrued on notes from parent of Borden Chemical — 19 — (19) — — —
Impairments 12 8 2
Other non-cash adjustments (3) 19 — Compensation expense under deferred compensation plan — 4 — — — — 4
Net change in operating assets and liabilities (net of acquisitions):
Deferred tax adjustments as a result of the Combination — 48 — — — — 48
Accounts receivable (112) 8 (81 )
Inventories (56) 57 (53 ) Balance, December 31, 2004 $ 1 $ 1,523 $ (296 ) $ (561) $ 20 $ (996) $ (309 )
Accounts and drafts payable 86 (23 ) 133
Net loss — — — — — (87) (87 )
Income taxes payable 15 58 —
Other assets, current and non-current (3) (53 ) (20 ) Translation adjustments — — — — (69) — (69 )
Other liabilities, current and long-term (7) 12 9
(16 )
Minimum pension liability adjustment, net of tax of $8 — — — — (16) —
Net cash used in operating activities of discontinued operations (3) (5 ) —
Net cash provided by (used in) operating activities 21 171 (32) Comprehensive loss (172 )
Cash Flows used in Investing Activities
Effect of the Hexion Formation — (581) — 581 — — —
Capital expenditures (122) (103 ) (57 )
Capitalized interest (3) — — Purchase accounting related to acquisition of minority interest — 121 — — (5) 11 127
Casualty loss insurance proceeds 2 — —
Dividends declared ($6.66 per share) — (550) — — — — (550 )
Acquisition of businesses, net of cash acquired (201) (252 ) (152 )
Proceeds from the sale of businesses, net of cash sold 47 3 —
Stock-based compensation expense — 12 — — — — 12
Cash combination of Borden Chemical — — 185
Redeemable preferred stock accretion — (30) — — — — (30 )
Proceeds from the sale of assets — — 4
Net cash used in investing activities of discontinued operations — (2 ) —
Interest accrued on notes from parent of Borden Chemical — 20 — (20) — — —
Net cash used in investing activities (277) (354 ) (20 )
Other — — — — — (2) (2 )
Cash Flows provided by Financing Activities
Net short-term debt borrowings (repayments) 13 (4 ) (6)
Balance, December 31, 2005 $ 1 $ 515 $ (296 ) $ — $ (70) $ (1,074) $ (924 )
Borrowings of long-term debt 4,471 1,193 293
Repayments of long-term debt (3,433) (748 ) (195 ) Net loss — — — — — (109) (109 )
Payment of dividends on common stock (485) (523 ) —
Translation adjustments, net of tax of $1 — — — — 80 — 80
Proceeds from issuance of preferred stock, net of issuance costs — 334 —
Redemption of preferred stock (397) — — Deferred losses on cash flow hedges — — — — (4) — (4 )
Long-term debt and credit facility financing fees (38) (22 ) —
22
Minimum pension liability adjustment, net of tax of $2 — — — — 22 —
IPO related costs (4) (11 ) —
Capital contribution related to Resolution Specialty transaction — — 60 Comprehensive loss (11 )
Other — — (4)
Impact of adoption of new accounting standard for
— — — — 53 — 53
Net cash from financing activities of discontinued operations 1 — — pension and postretirement obligations, net of tax of $0
Net cash provided by financing activities 128 219 148
Dividends declared ($6.12 per share) — (505) — — — — (505 )
Effect of exchange rates on cash and equivalents 9 (5 ) 7
(Decrease) increase in cash and equivalents (119) 31 103 Stock-based compensation expense — 6 — — — — 6
Cash and equivalents at beginning of year 183 152 49
Redeemable preferred stock accretion — (33) — — — — (33 )
Cash and equivalents at end of year 64 $ 183 $ 152
Balance, December 31, 2006 $ 1 $ (17) $ (296) $ — $ 81 $ (1,183) $ (1,414 )
Supplemental Disclosures of Cash Flow Information
Cash paid:
(a) Accumulated other comprehensive income at December 31, 2006 represents $103 of net foreign currency translation gains, net of tax, a $4 unrealized loss
Interest, net 220 $ 192 $ 102
on derivative instruments, net of tax, and a $18 loss, net of tax, relating to net actuarial losses and prior service costs for the Company’s defined benefit
Debt redemption costs 94 — —
pension and postretirement benefit plans. Accumulated other comprehensive loss at December 31, 2005 represents $23 of net foreign currency translation
Income taxes, net 16 8 3
gains and a $93 net loss relating to the Company’s minimum pension liability adjustment.
Non-cash investing and financing activity:
See Notes to Consolidated Financial Statements in our Form 10-K filed with the U.S. Securities and Exchange Commission
Settlement of note receivable from parent — 581 —
Unpaid common stock dividends declared 20 27 —
Redeemable preferred stock accretion — 30 —
Issuance of Note in Resolution Specialty transaction — — 50
8. Selected Financial Statements Hexion Specialty Chemicals, Inc.
n
Reconciliation of Net Loss Directors and
to Adjusted EBITDA Executive Officers
Year Ended December 31, 2006
(In millions)
Directors
Net loss $ (109)
Craig O. Morrison Director, Chairman, President and Chief Executive Officer
Income taxes 14
William H. Carter Director, Executive Vice President and Chief Financial Officer
Interest expense, net 242
Loss from extinguishment of debt 121 Marvin O. Schlanger Director, Vice Chairman
Depreciation and amortization expense 171
Joshua J. Harris Director
EBITDA 439
Scott M. Kleinman Director
Adjustments to EBITDA
Acquisitions EBITDA (1) 35
Robert V. Seminara Director
Transaction costs (2) 20
Jordan C. Zaken Director
Integration costs (3) 57
Non-cash charges (4) 22
Unusual items:
Executive Officers
Purchase accounting effects/inventory step-up 3
Joseph P. Bevilaqua Executive Vice President, President – Phenolic and Forest Products Resins
Gain on divestiture of business (39)
Discontinued operations 14 Cornelis Kees Verhaar Executive Vice President, President – Epoxy and Coating Resins
Business realignments (2)
Sarah R. Coffin Executive Vice President, President – Performance Products
Other (5) 10
Richard L. Monty Executive Vice President – Environmental Health and Safety
Total unusual items (14)
In process Synergies (6) 105 George F. Knight Senior Vice President – Finance and Treasurer
Adjusted EBITDA (7) $ 664
Fixed charges (8) $ 290
Ratio of Adjusted EBITDA to Fixed Charges 2.29
Investor Information
Corporate Contact Information
Hexion Specialty Chemicals, Inc.
(1) Represents the incremental EBITDA impact for the Coatings Acquisition, the Inks Acquisition, as well as two smaller acquisitions, and the Orica
Acquisition which closed February 1, 2007, less EBITDA generated prior to the Brazilian Consumer Divestiture, as if they had taken place at the
180 East Broad Street
beginning of the period.
Columbus, Ohio 43215
(2) Represents the write-off of deferred accounting, legal and printing costs associated with the Company’s proposed IPO, as well as costs associated
with terminated acquisition activities. +1 614 225 4000
(3) Represents redundancy and plant rationalization costs and incremental administrative costs associated with integration programs. It also includes www.hexion.com
costs related to the implementation of a single, company-wide management information and accounting system.
(4) Includes non-cash charges for impairments of fixed assets, stock based compensation and unrealized foreign exchange and derivative losses.
(5) Includes the impact of announced Alkyds Divestiture, one-time benefit plan costs and management fees.
(6) Represents estimated net unrealized synergy savings resulting from the Hexion Formation.
(7) The Company is required to have an Adjusted EBITDA to Fixed Charges ratio of greater than 2.0 to 1.0 to incur additional indebtedness under
our indenture for the Second Priority Senior Secured Notes. As of December 31, 2006, the Company was able to satisfy this covenant and incur
additional indebtedness under this indenture.
(8) The fixed charges reflect pro forma interest expense as if the debt refinancing and the Orica acquisition, which occurred in November 2006 and
February 2007, respectively, had taken place at the beginning of the period.
About This Report
This Summary Annual Report is intended to provide investors with an overview of Hexion Specialty Chemicals, Inc. and our businesses, our performance
in 2006 and our plans for the future. It does not include nor is it intended as a substitute for the information contained in our Annual Report on Form 10-K
for the year ended December 31, 2006 on file with the U.S. Securities and Exchange Commission. Investors and others interested in the company are
encouraged to carefully review the Form 10-K and other Hexion Specialty Chemicals, Inc. filings with the SEC to obtain a more complete understanding
of the company and its operations.
Forward Looking Statements
Certain statements in this press release are forward-looking statements within the meaning of Section 27A of the Securities Act of 1933, as amended
and Section 21E of the Securities Exchange Act of 1934, as amended. In addition, the management of Hexion Specialty Chemicals, Inc. (which may be
referred to as “Hexion,” “we,” “us,” “our” or the “Company”) may from time to time make oral forward-looking statements. Forward looking statements
may be identified by the words “believe,” “expect,” “anticipate,” “project,” “plan,” “estimate,” “will” or “intend” and similar expressions. The forward-
looking statements contained herein reflect our current views with respect to future events and are based on our currently available financial, economic
and competitive data and on current business plans. Actual results could vary materially depending on risks and uncertainties that may affect the
Company’s operations, markets, services, prices and other factors as discussed in Item 1A – Risk Factors, of the Company’s Form 10-K filed with the
Securities Exchange Commission (SEC) on March 22, 2007. Important factors that could cause actual results to differ materially from those in the forward-
looking statements include, but are not limited to: economic factors such as an interruption in the supply of or increased pricing of raw materials due to
natural disasters, competitive factors such as pricing actions by our competitors that could affect our operating margins, and regulatory factors such as
changes in governmental regulations involving our products that lead to environmental and legal matters as described in Item 3 – Legal Proceedings, of
the Company’s Form 10-K filed with the SEC on March 22, 2007.