Download as PDF, PPTX
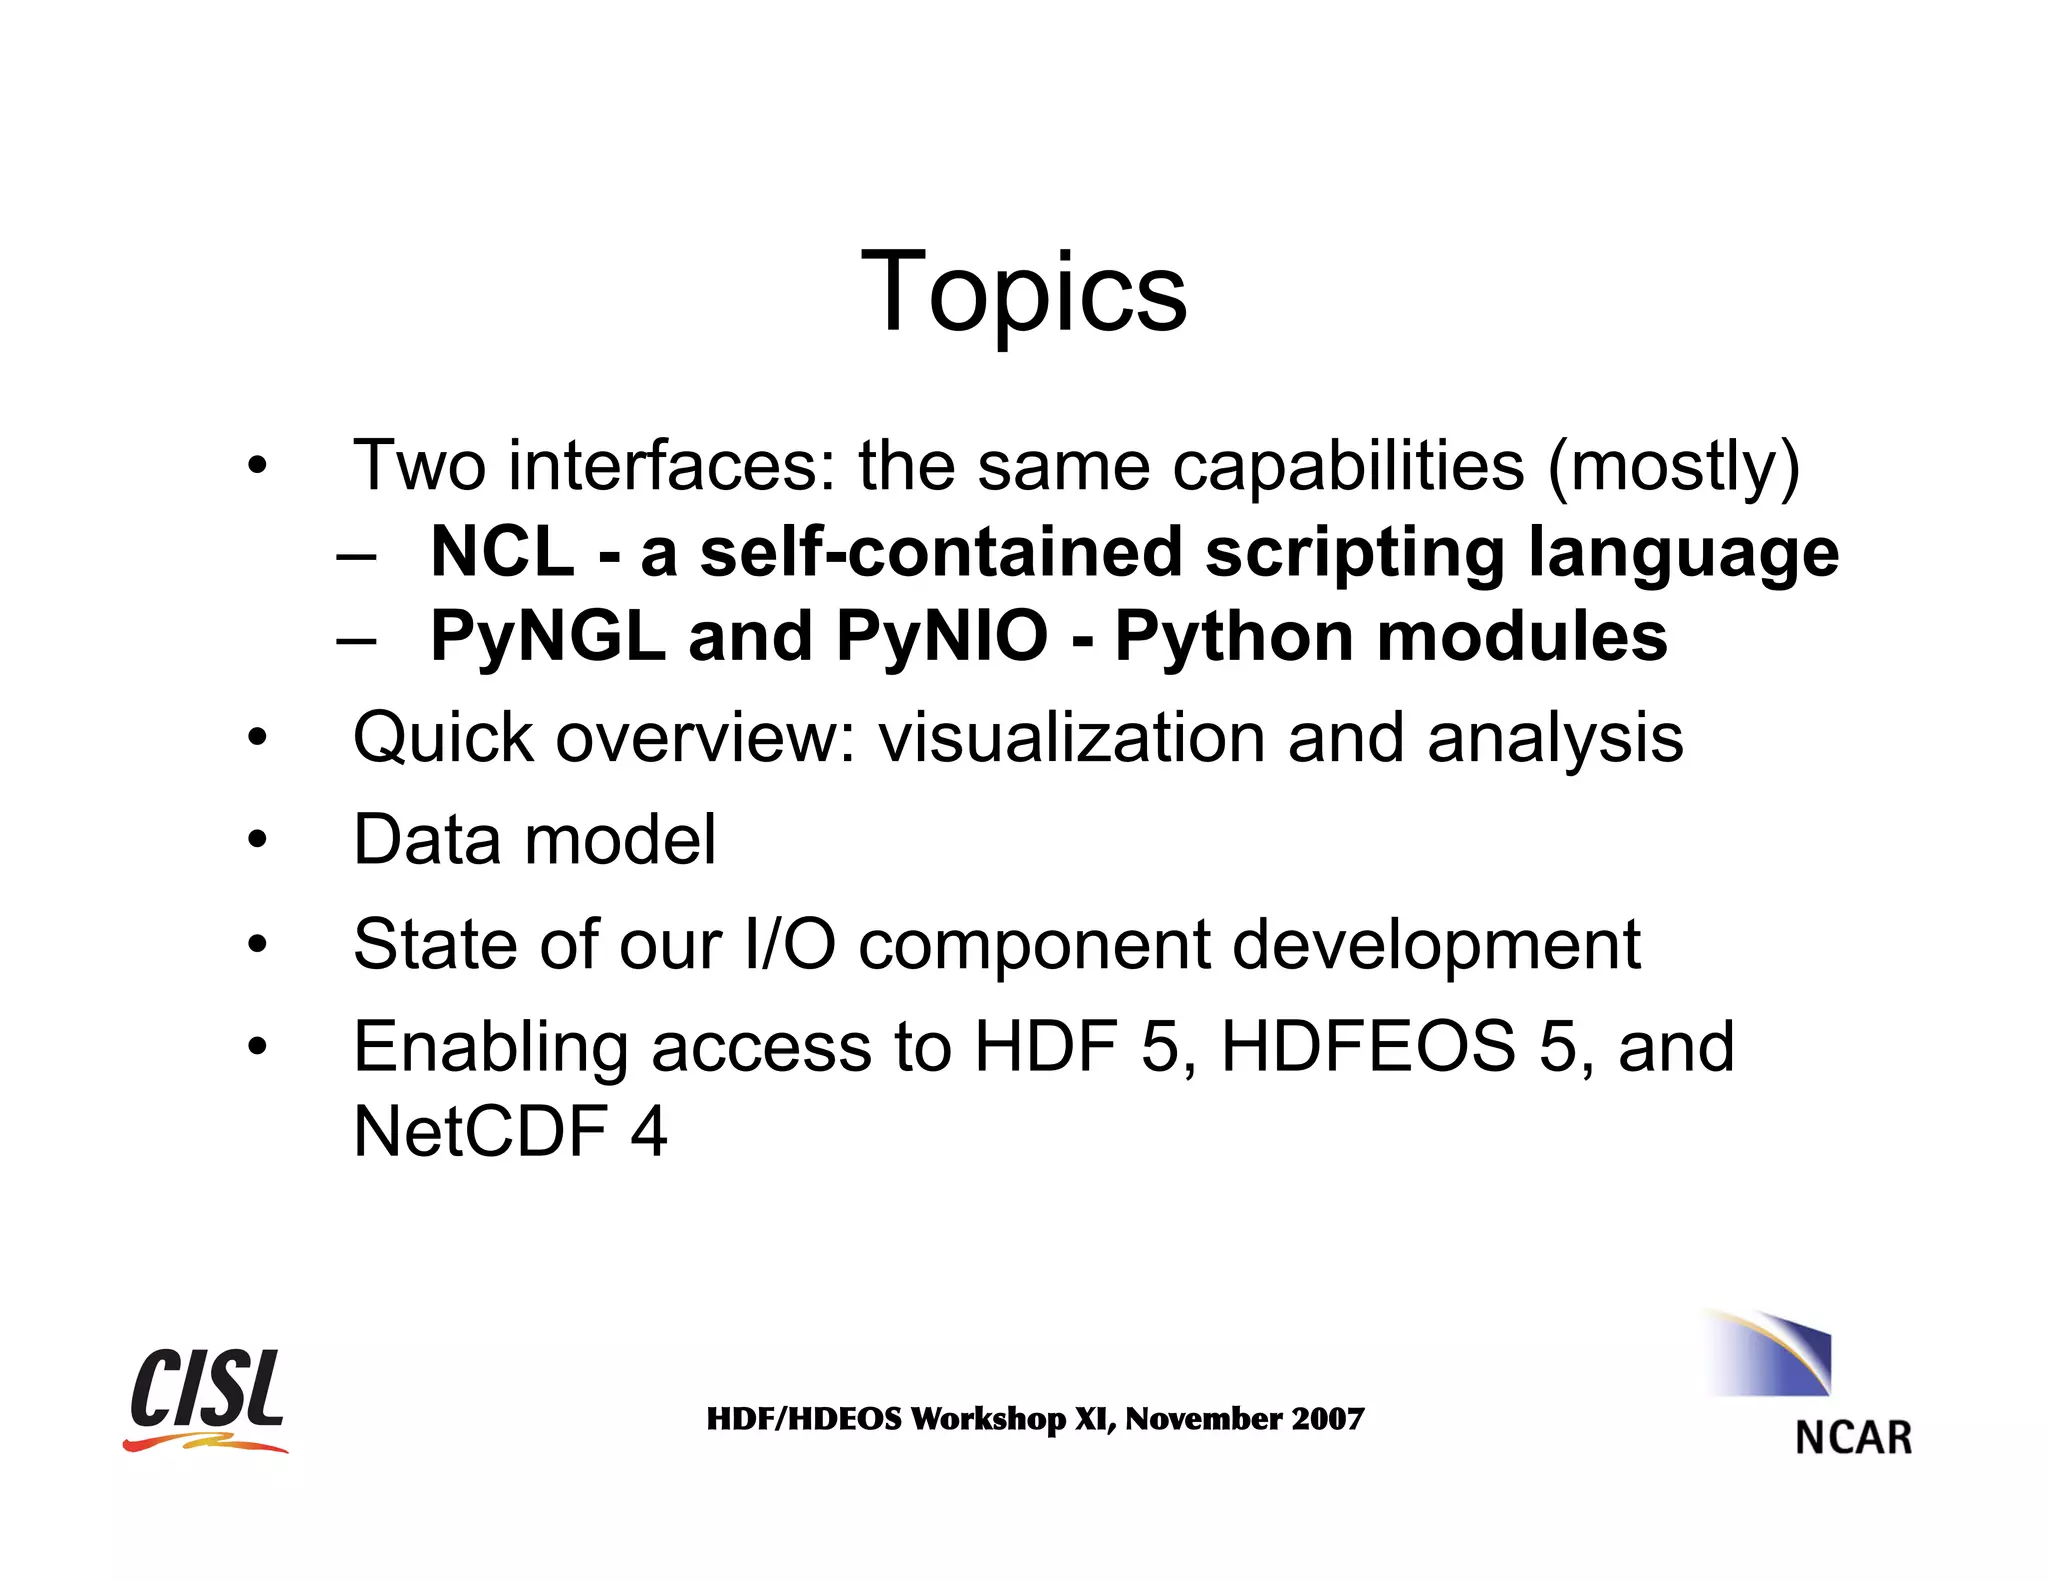
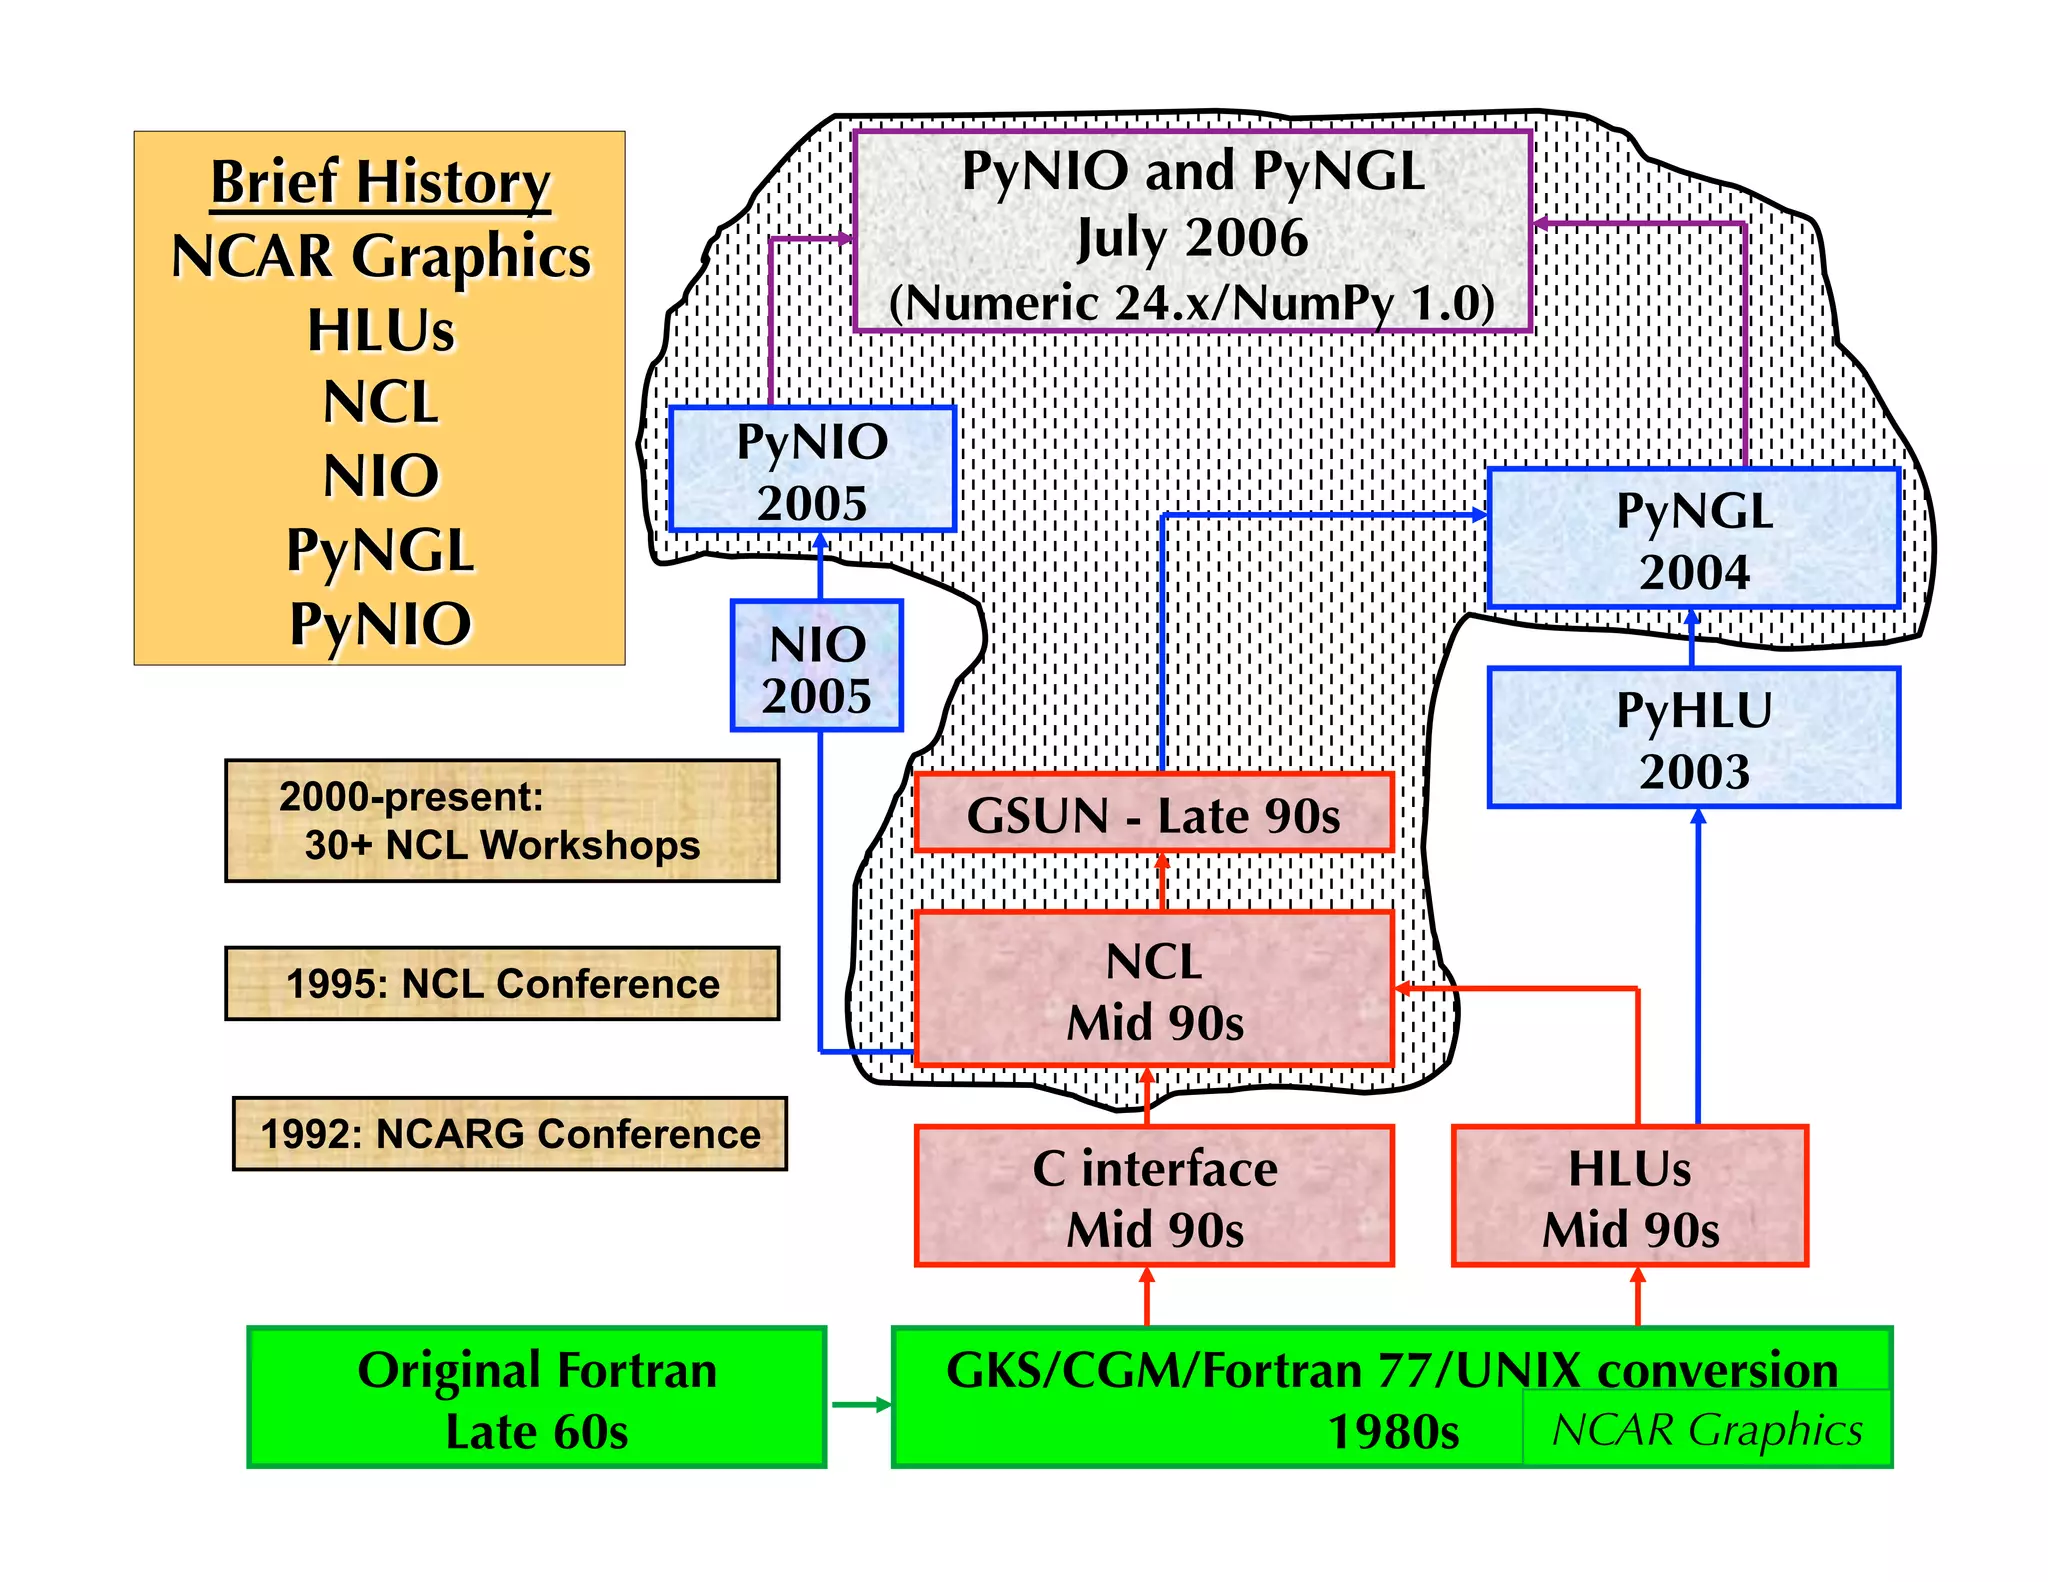


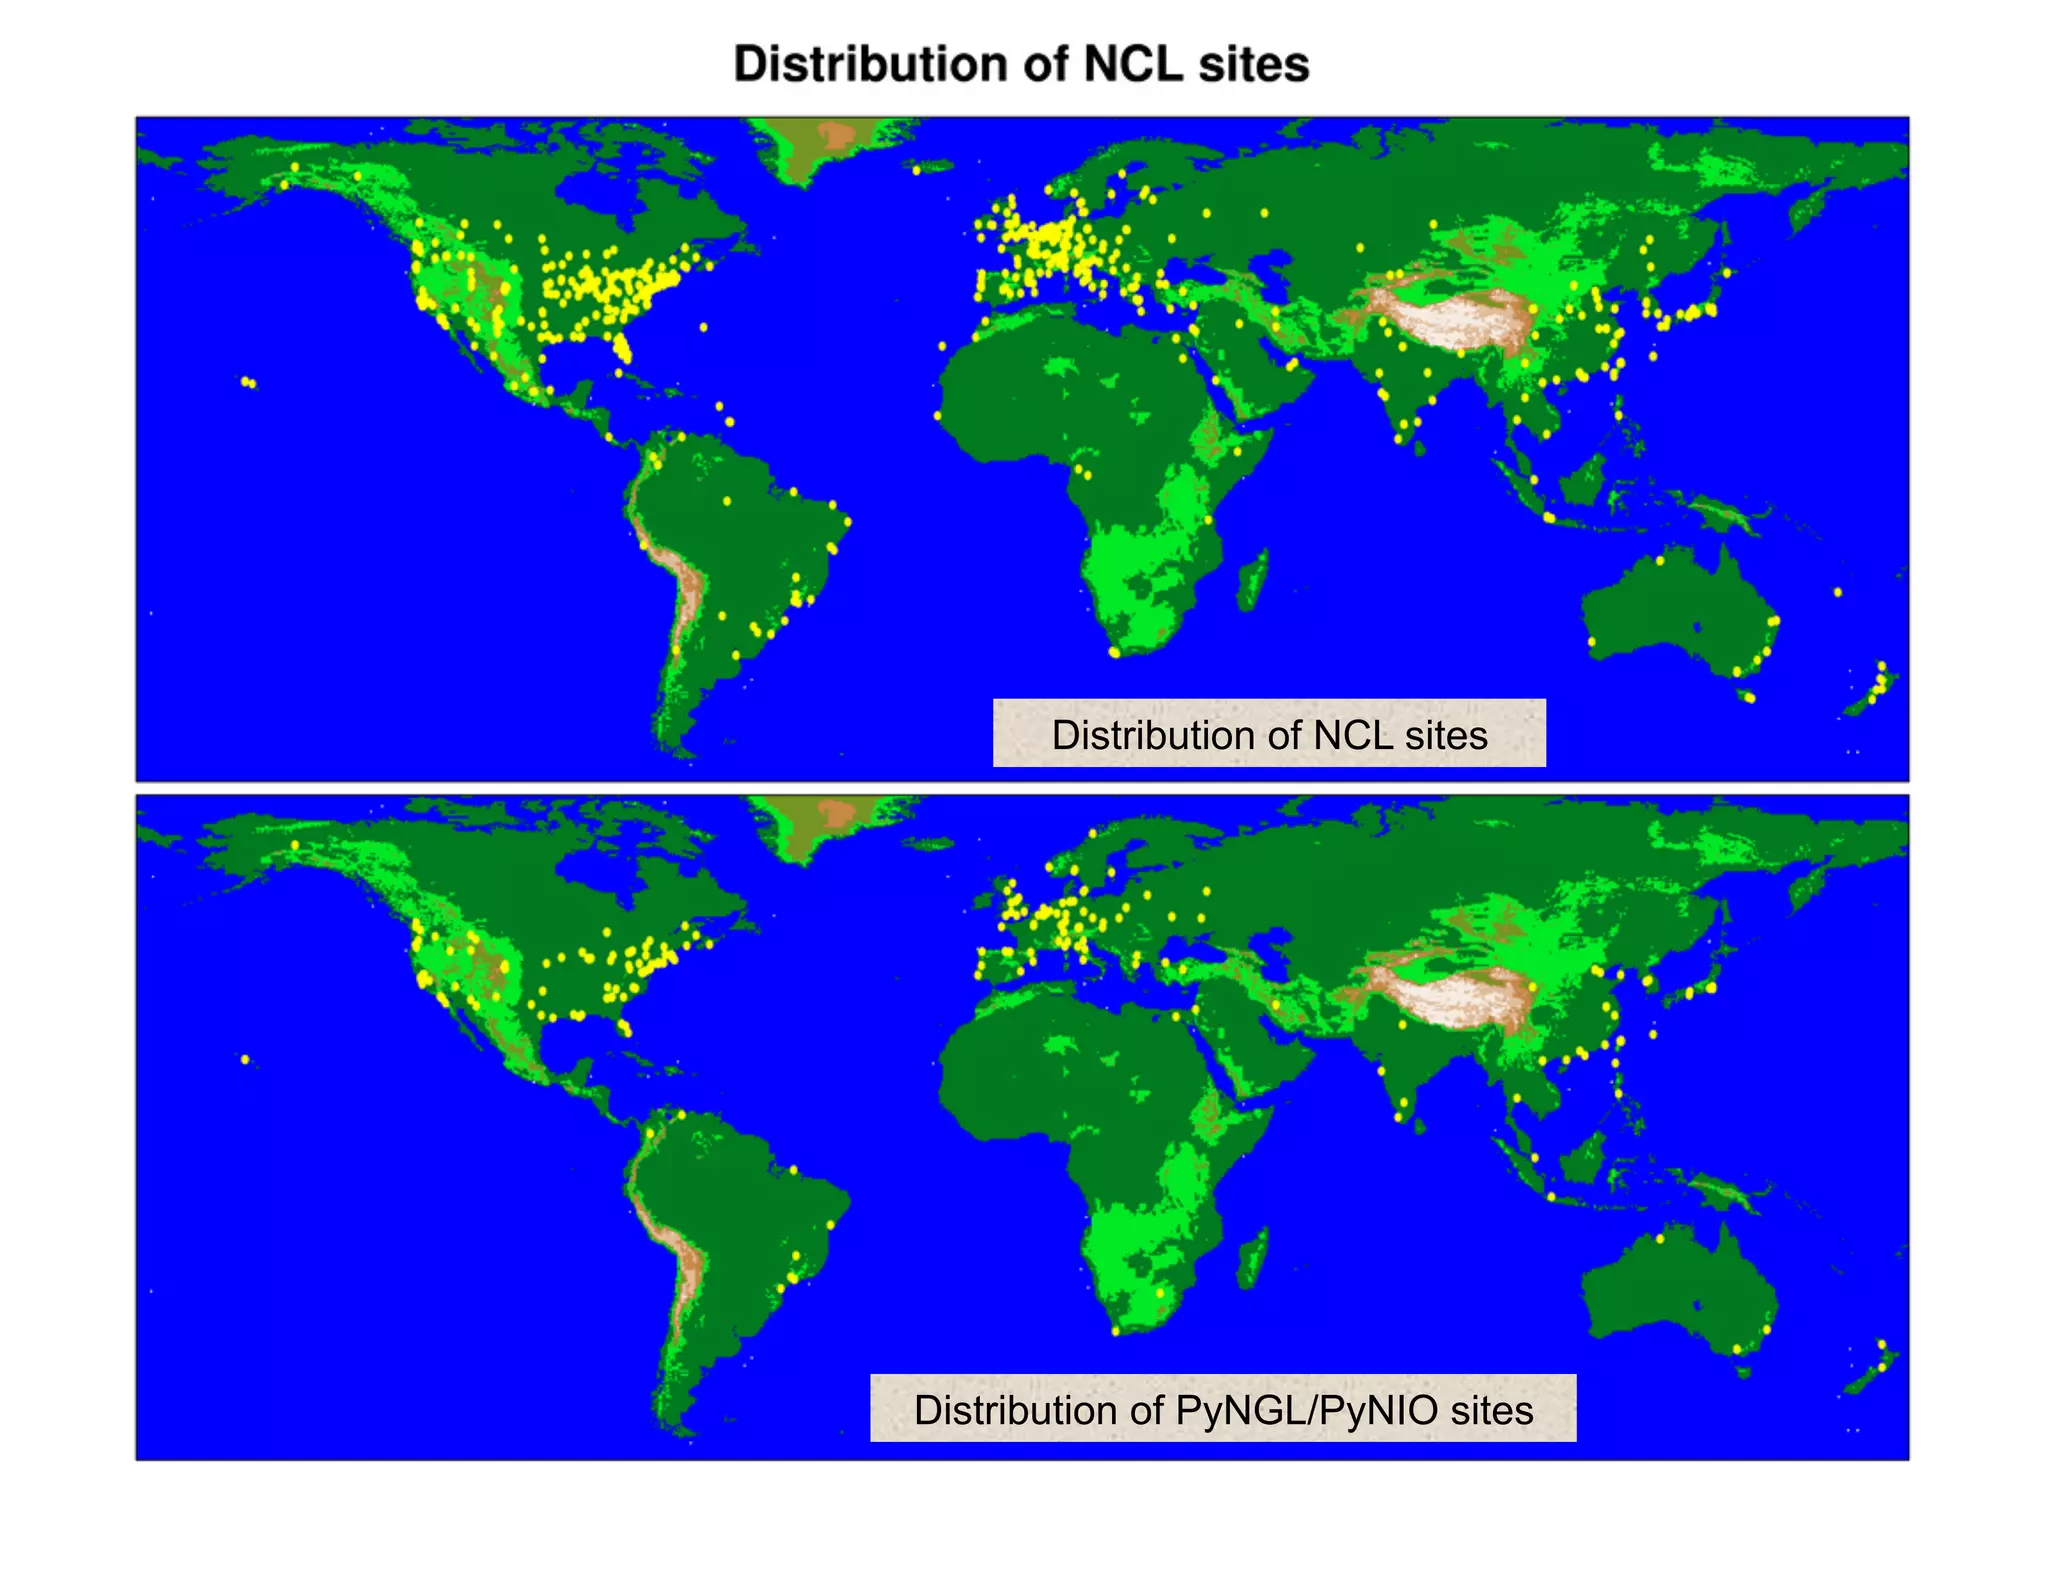

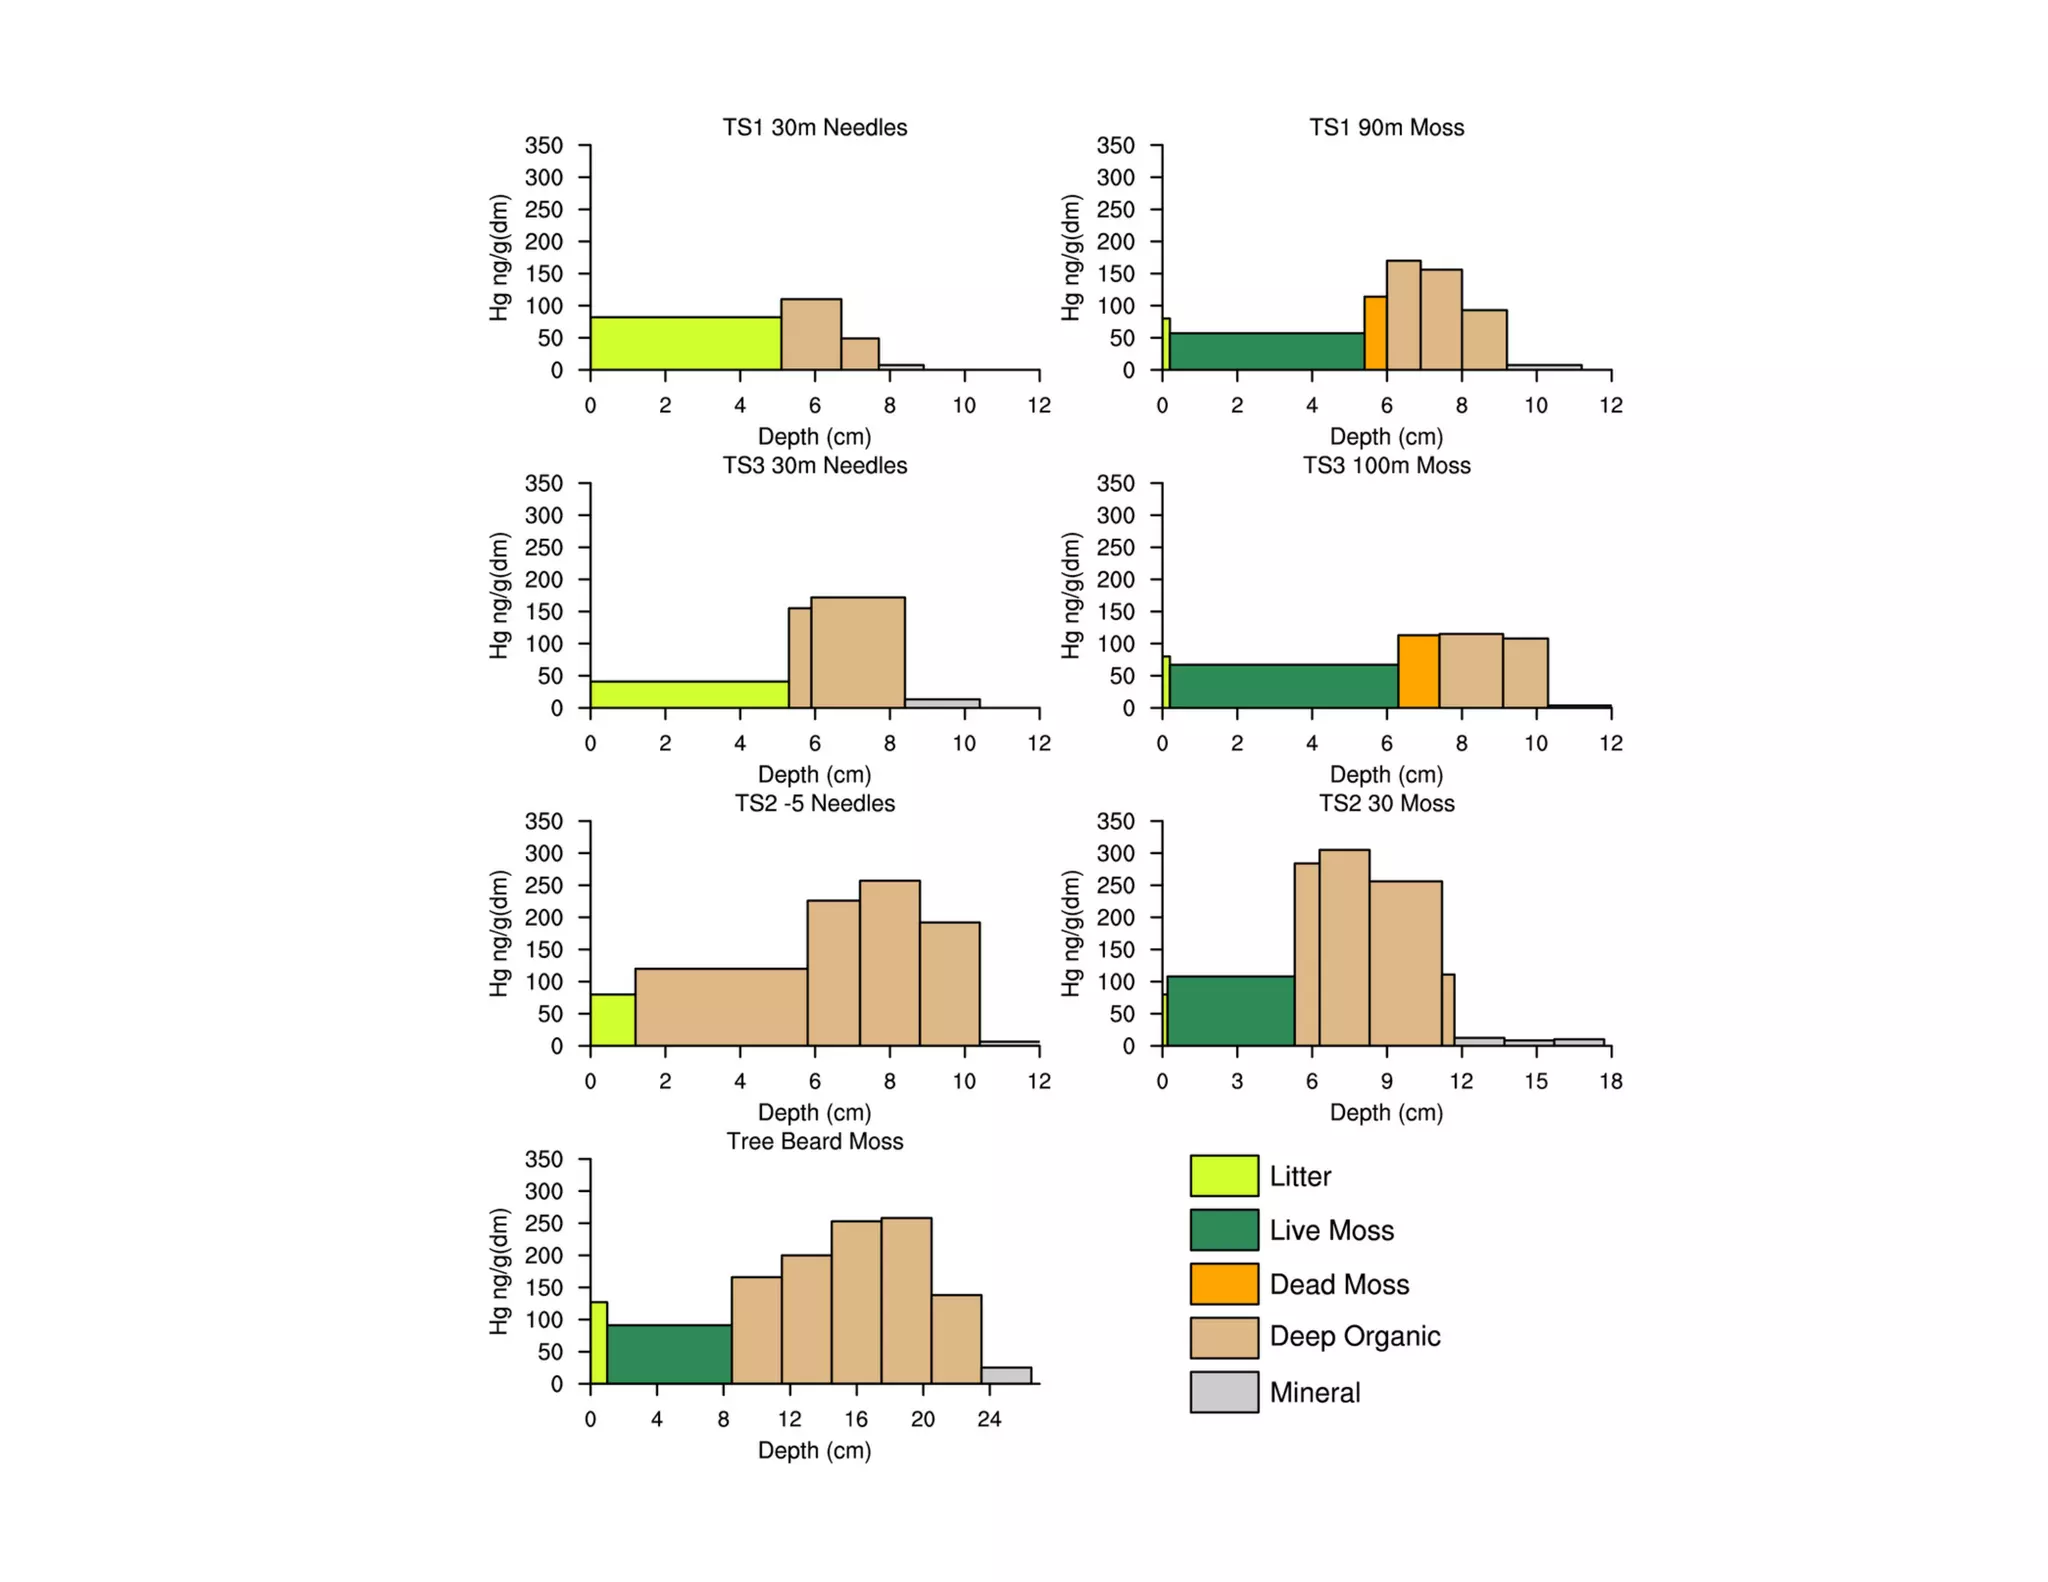
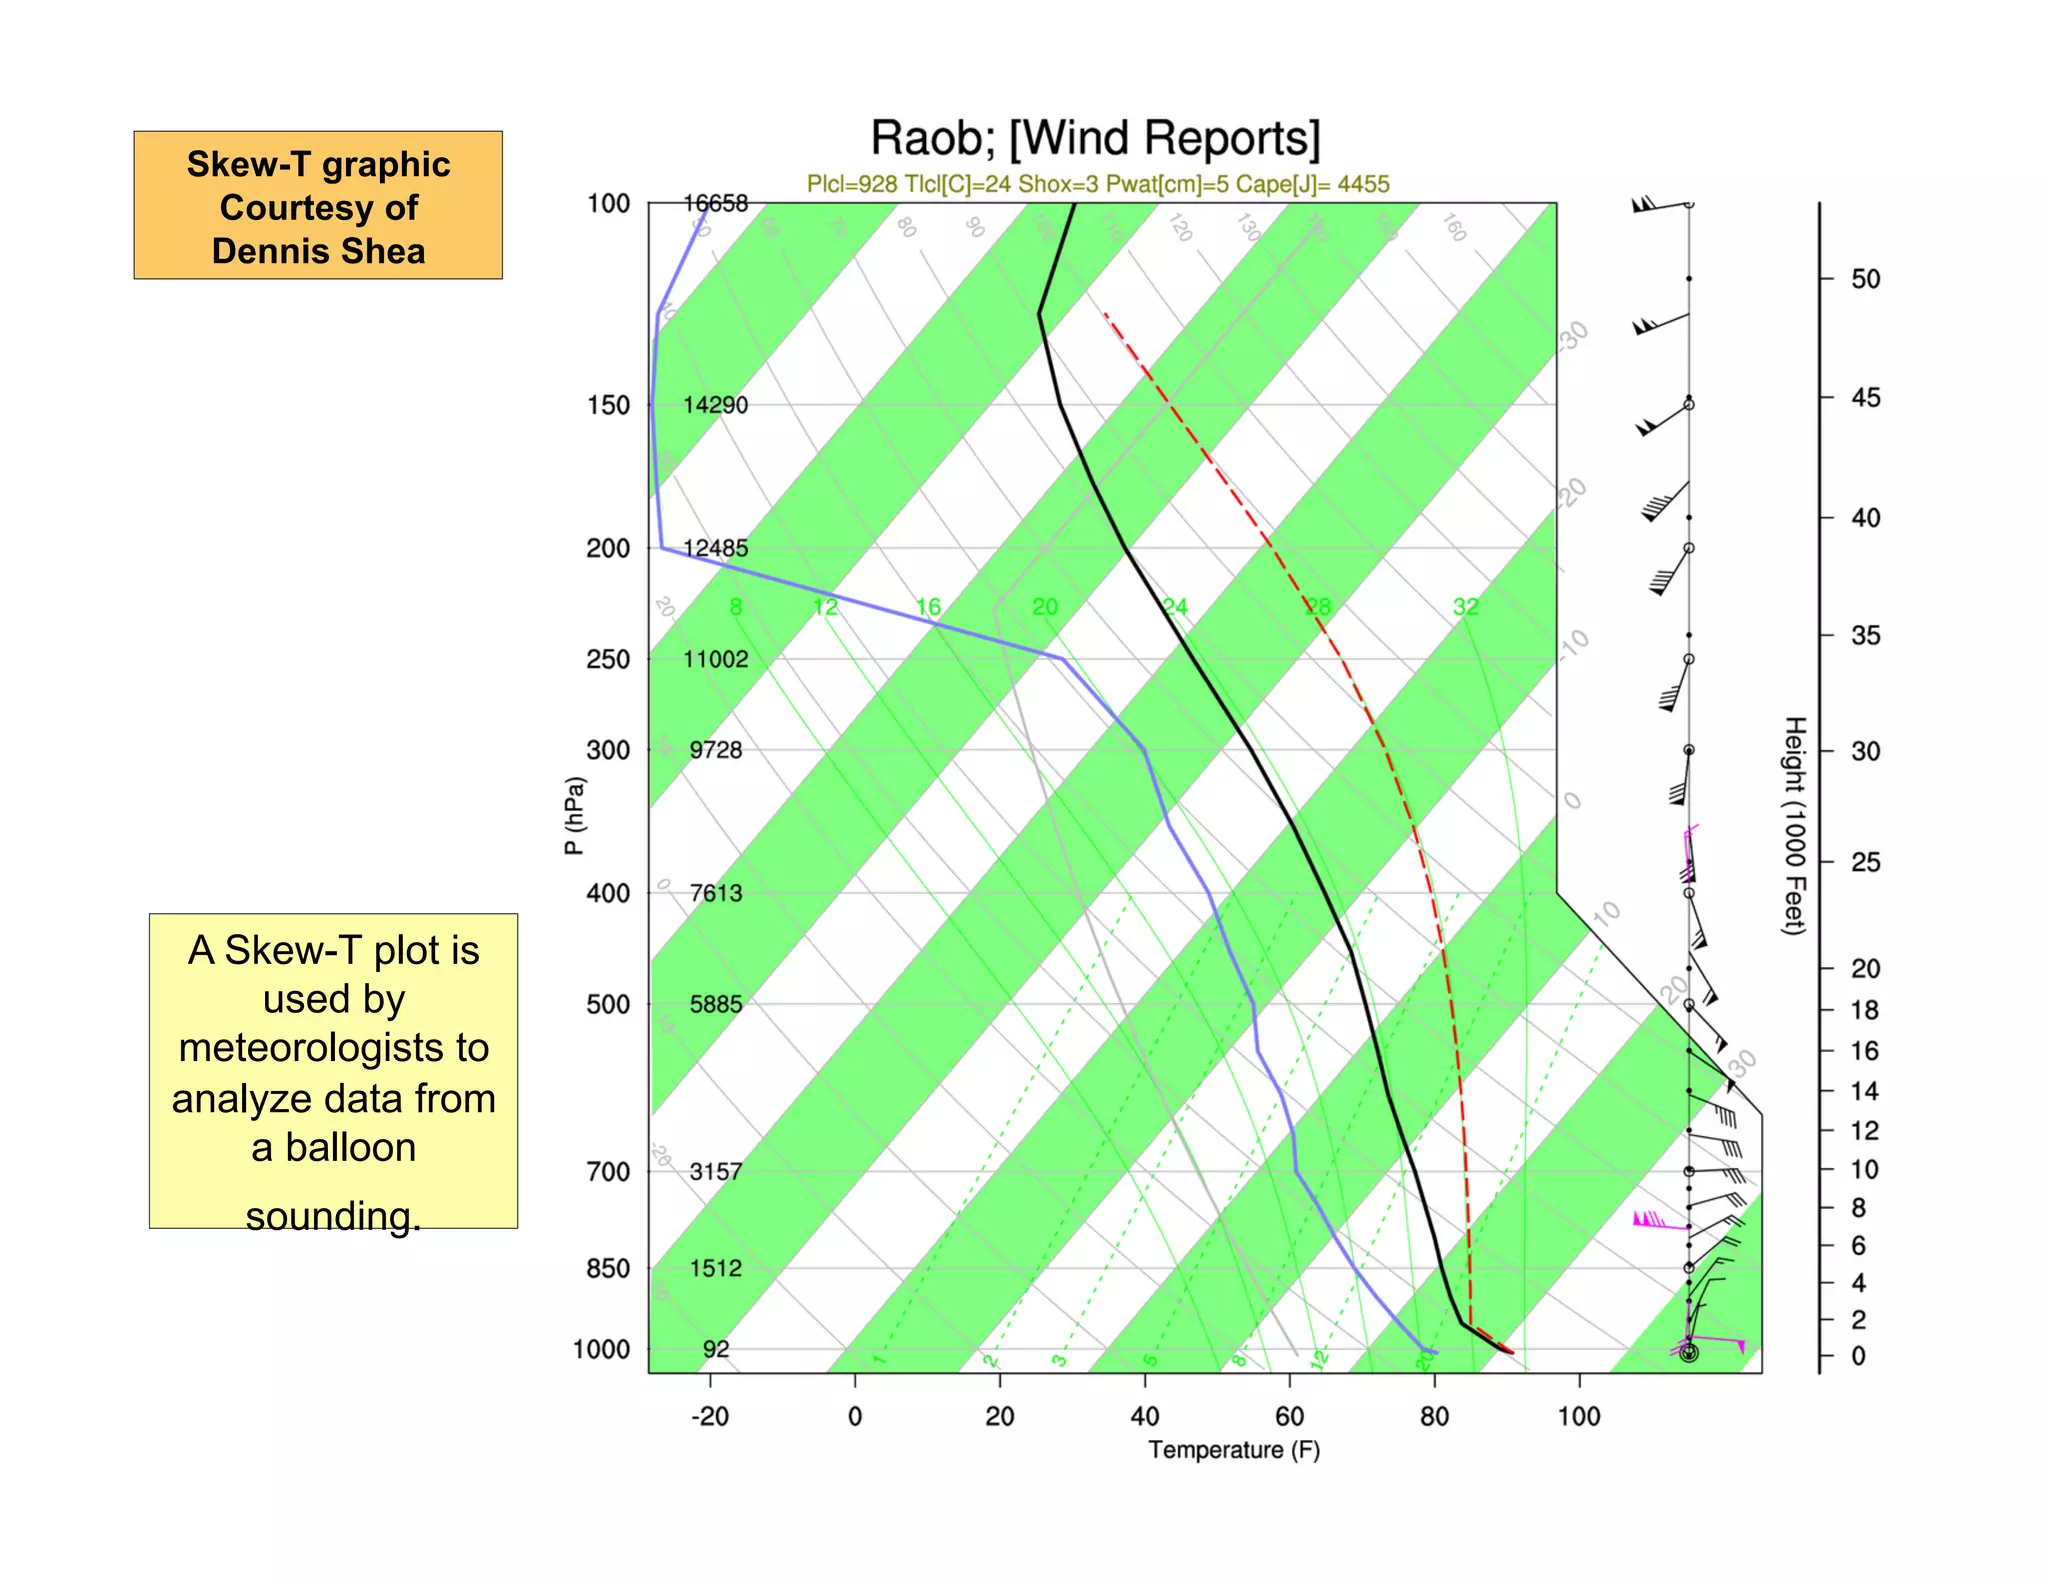
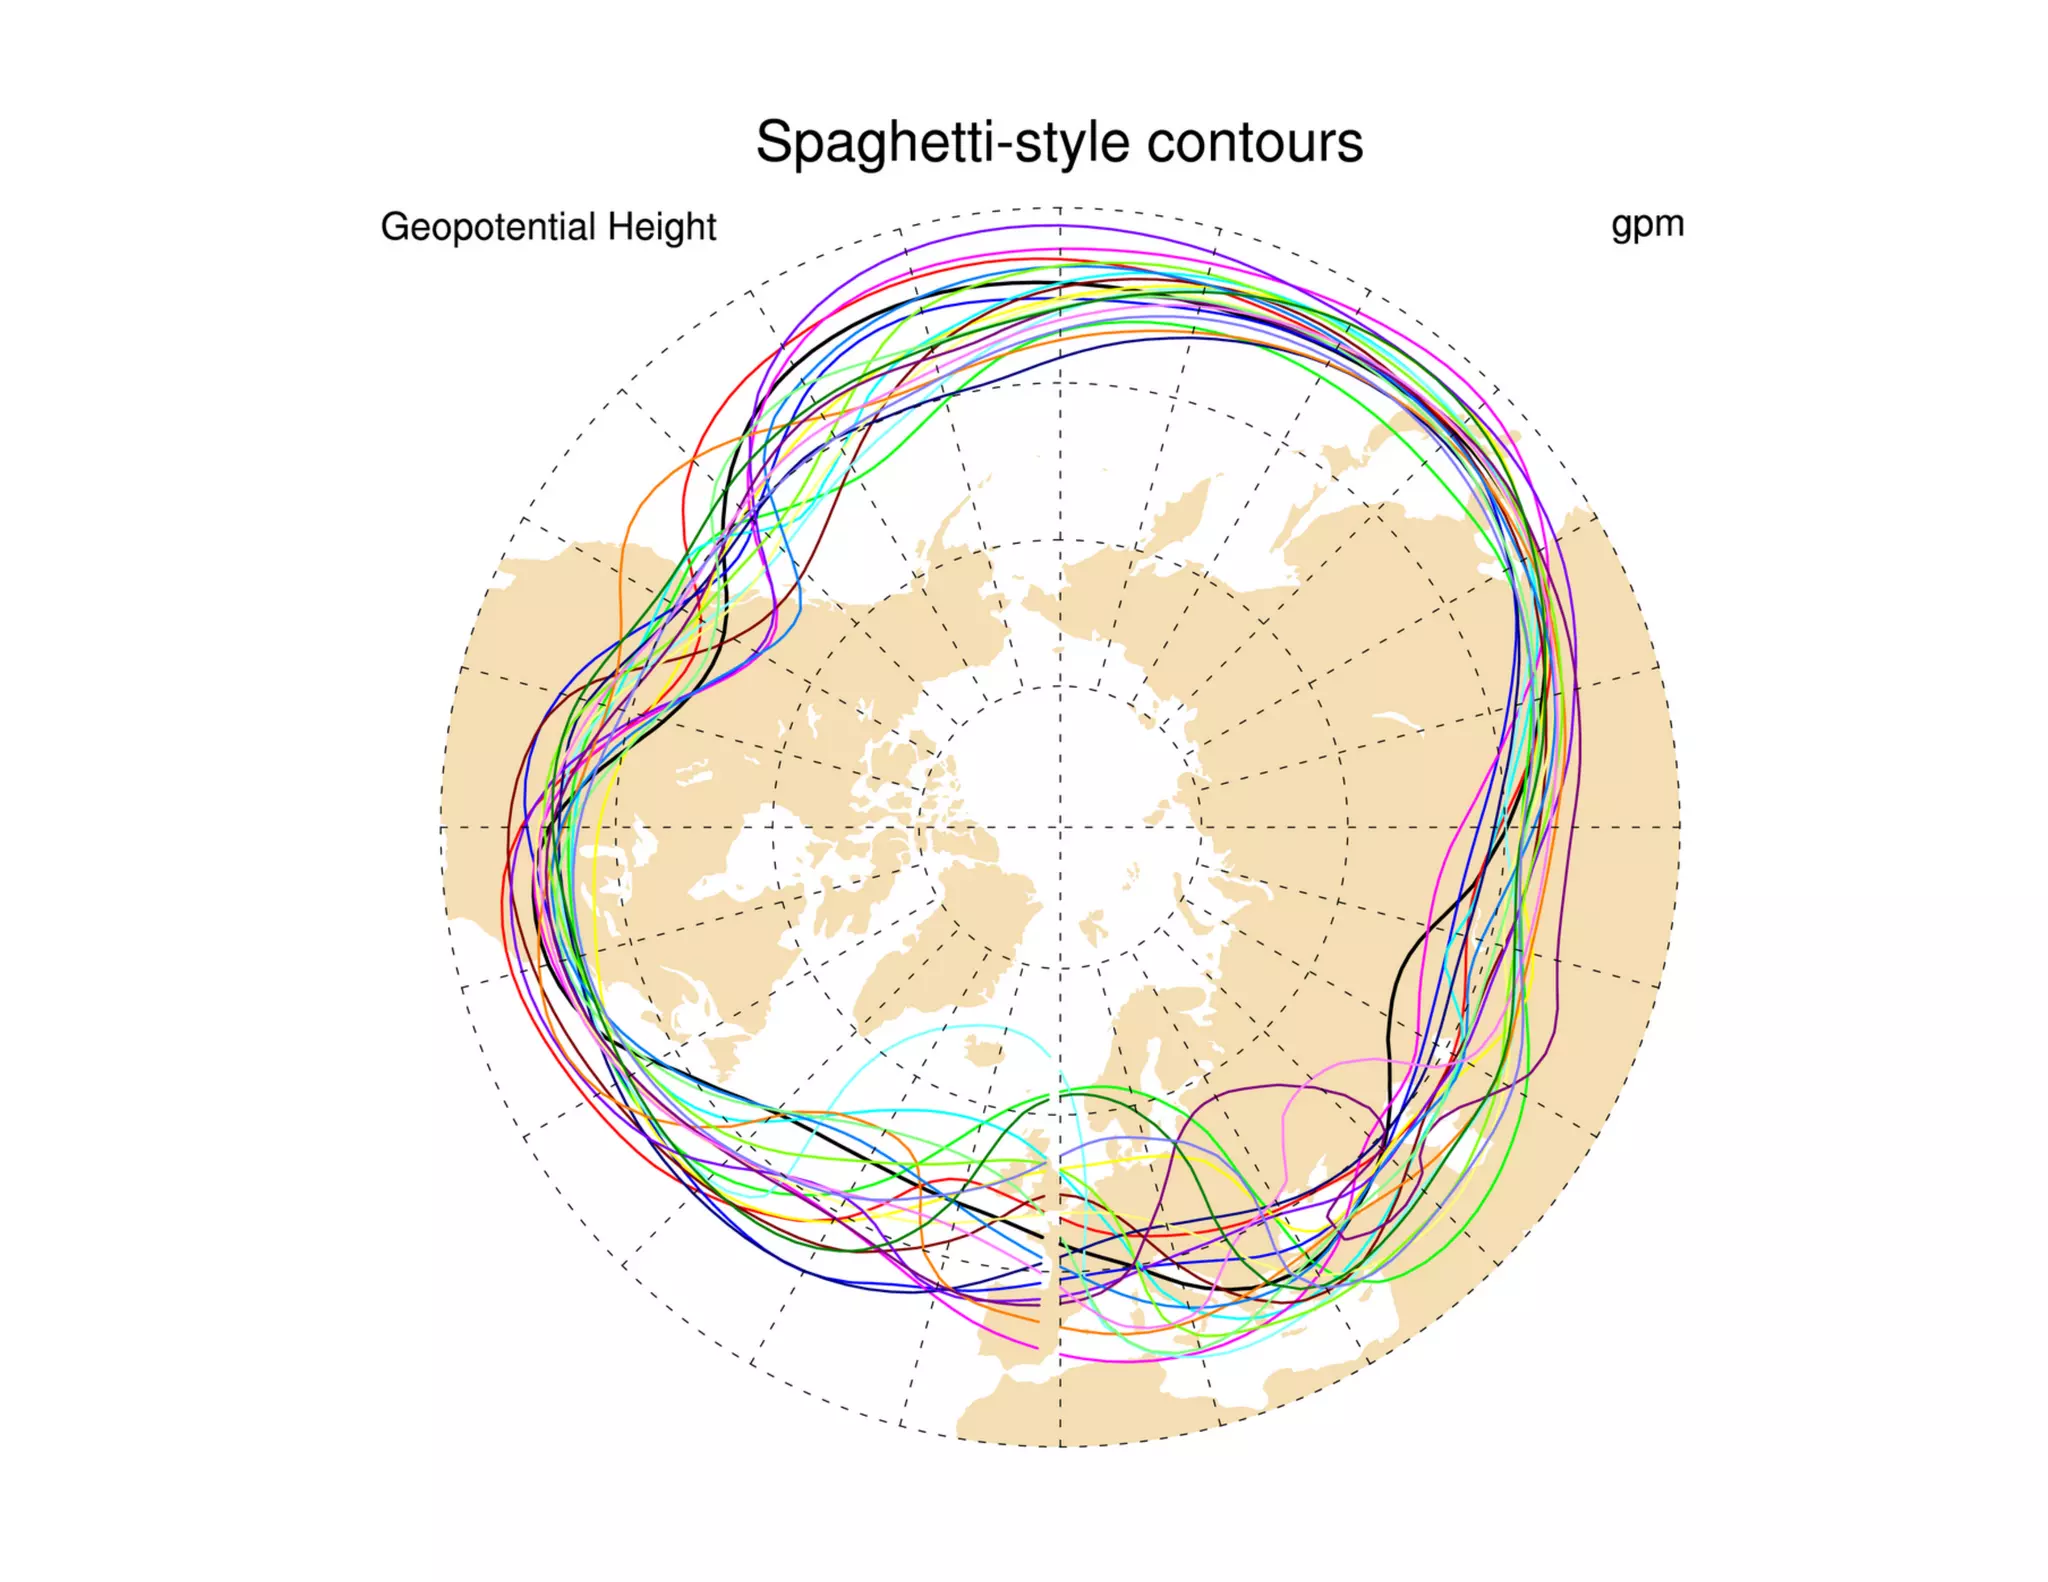
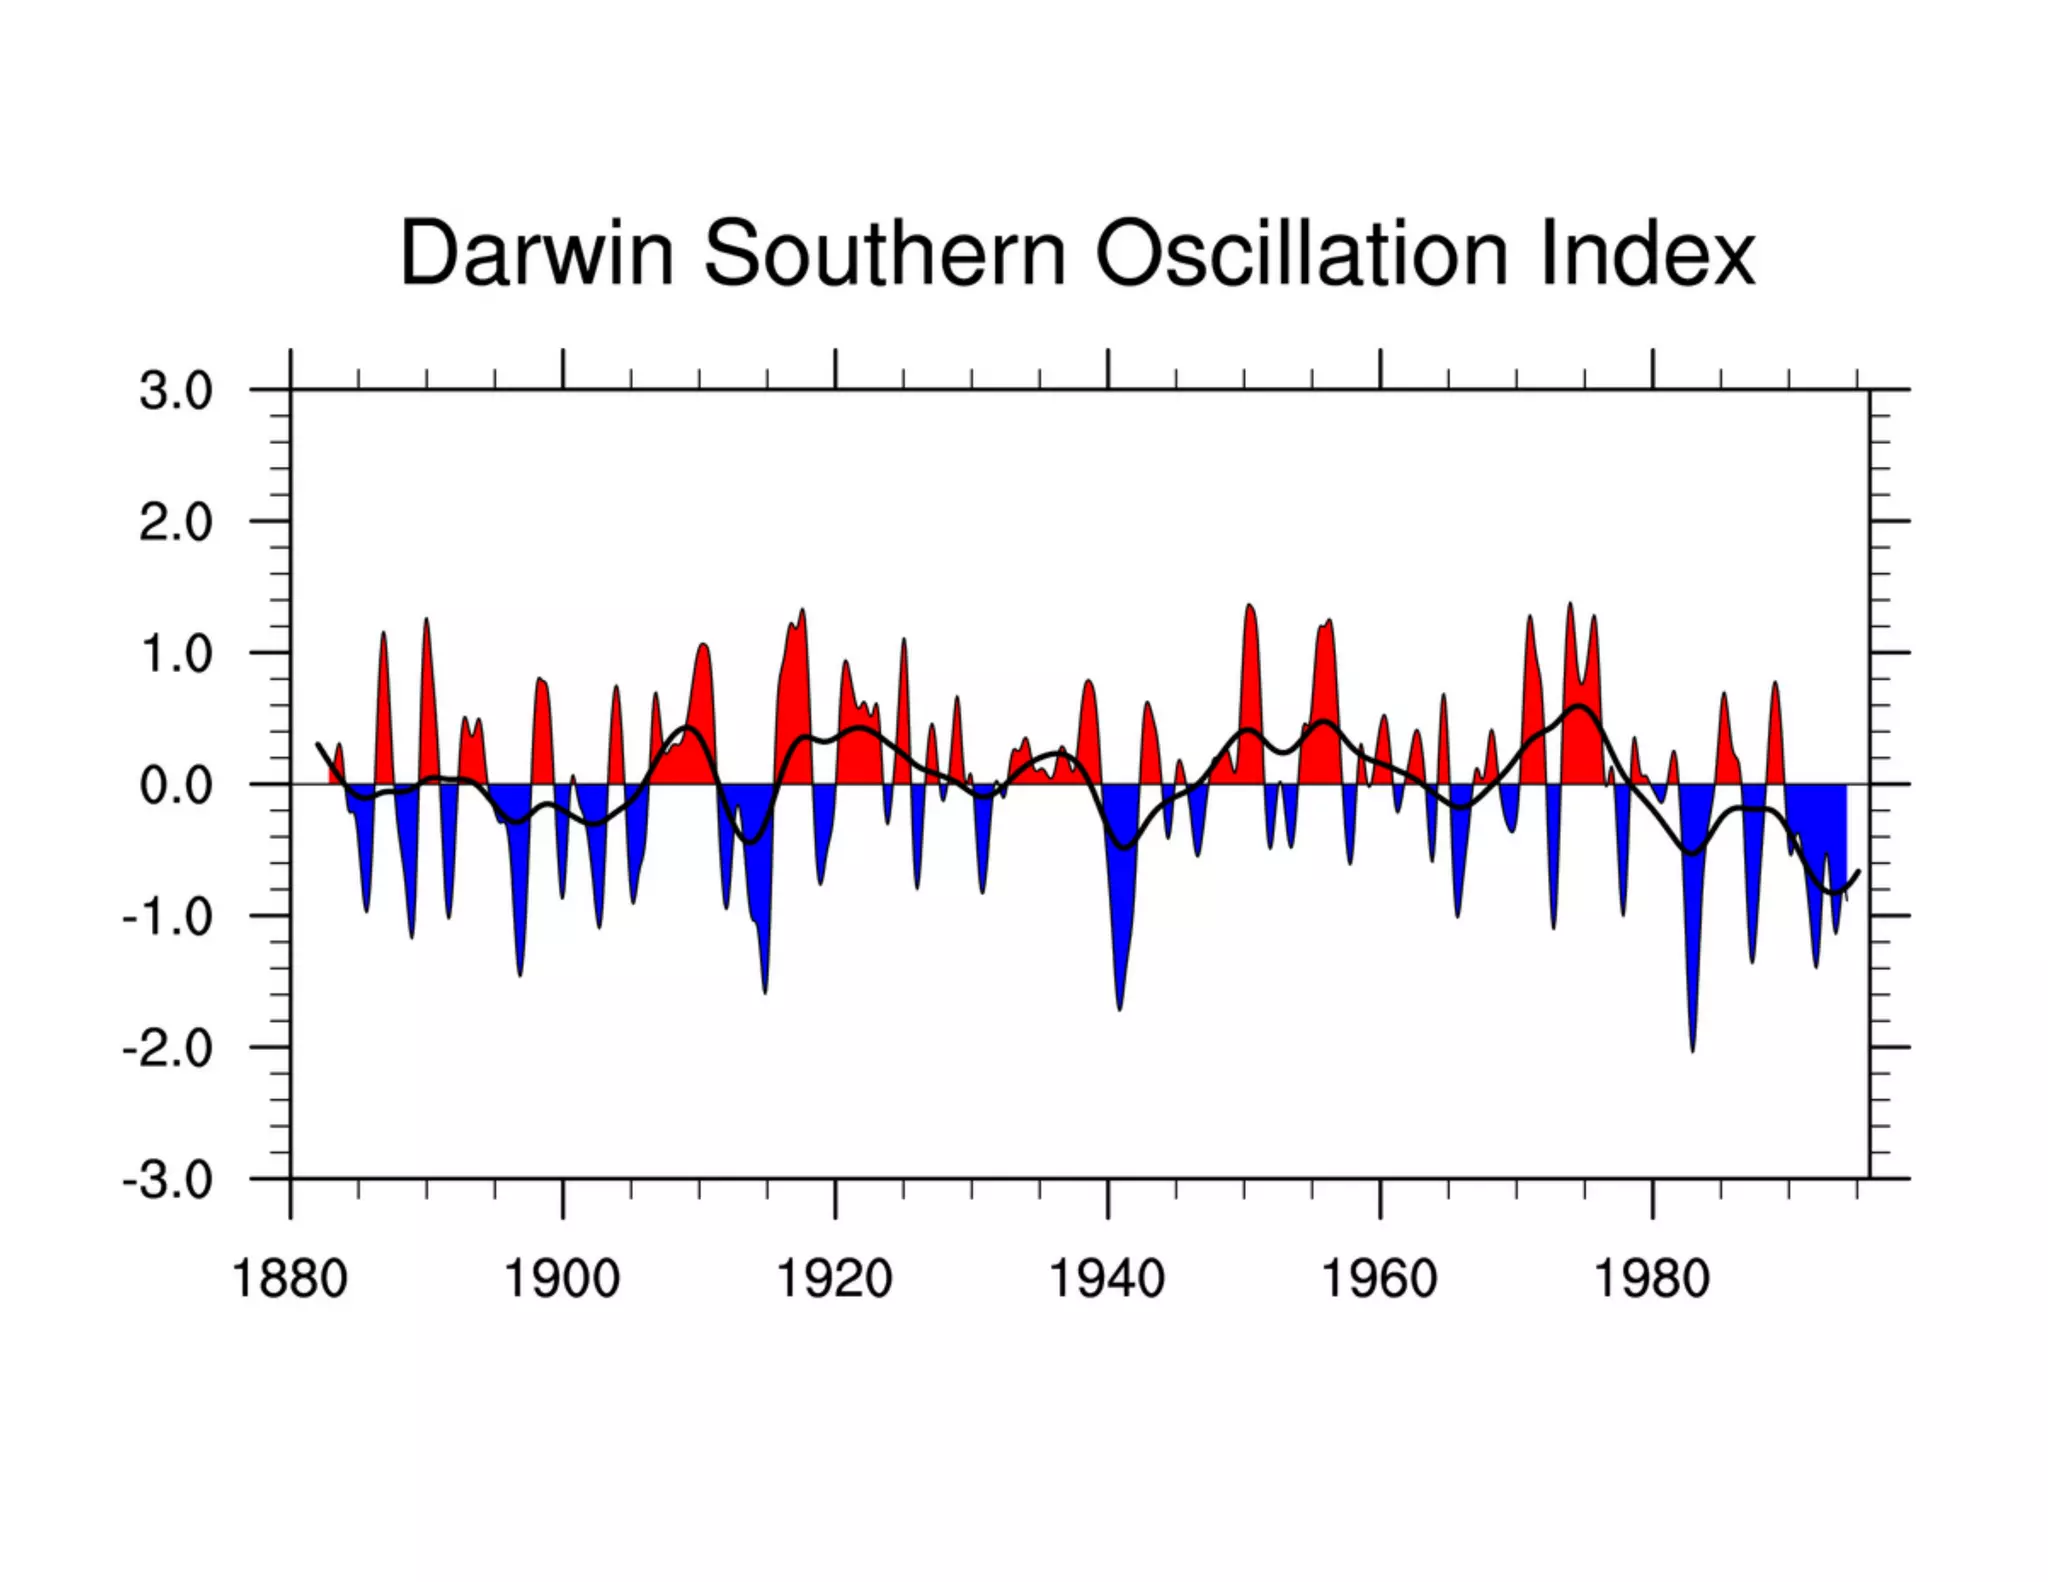
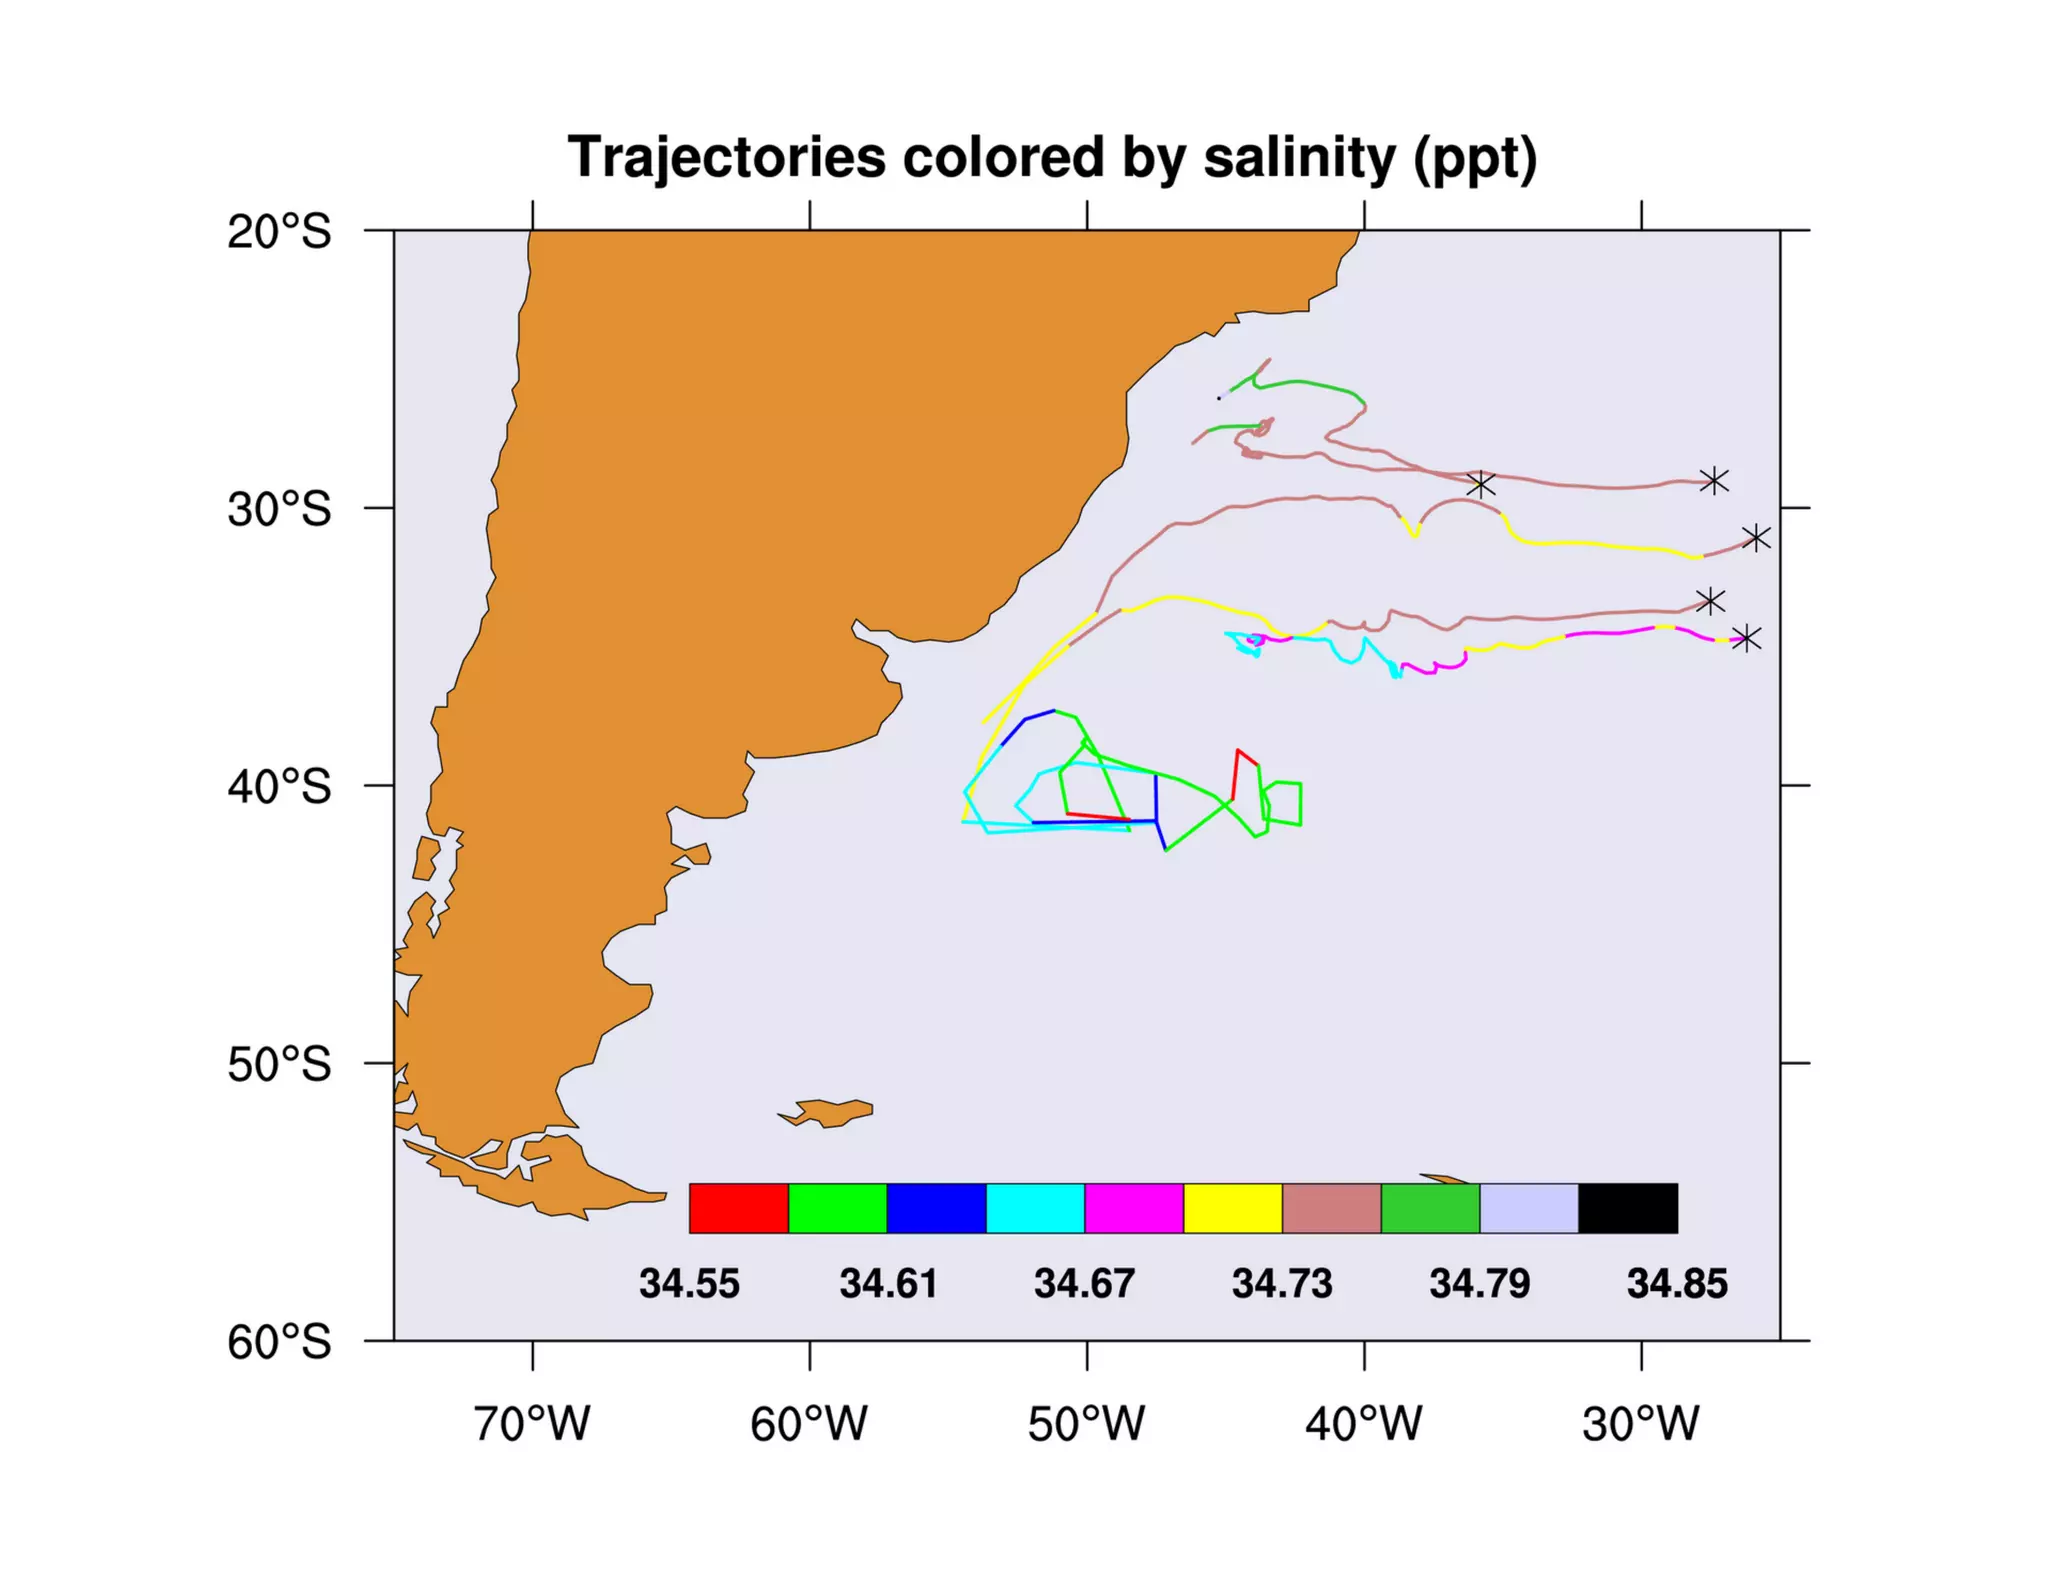
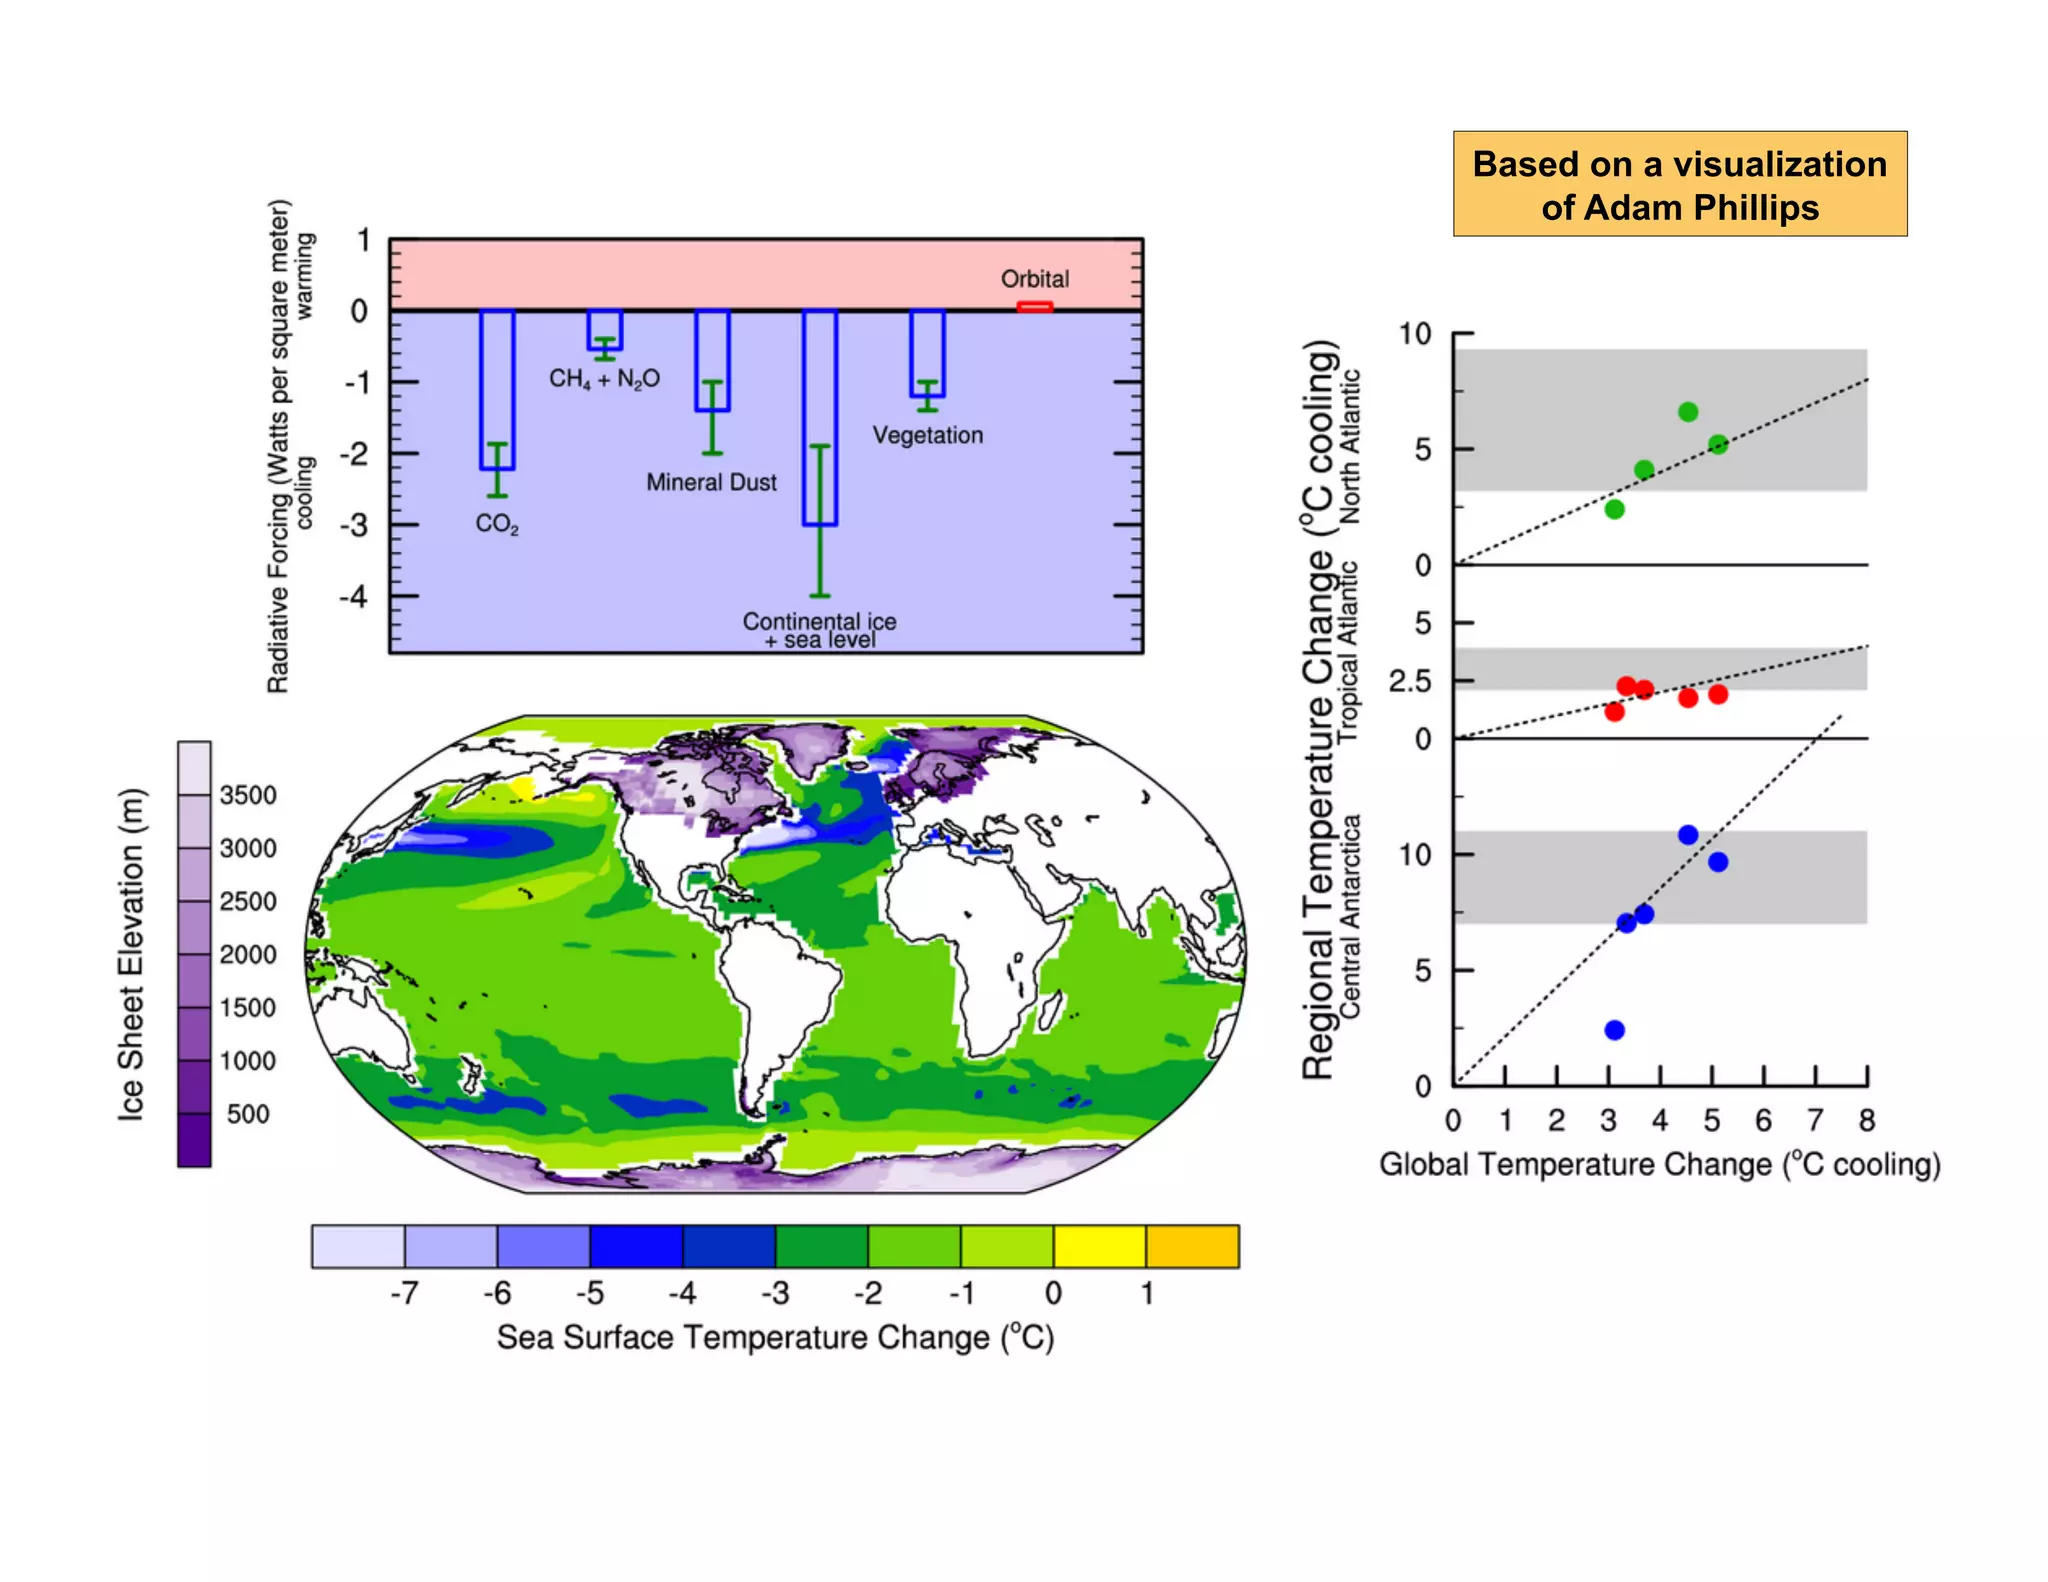
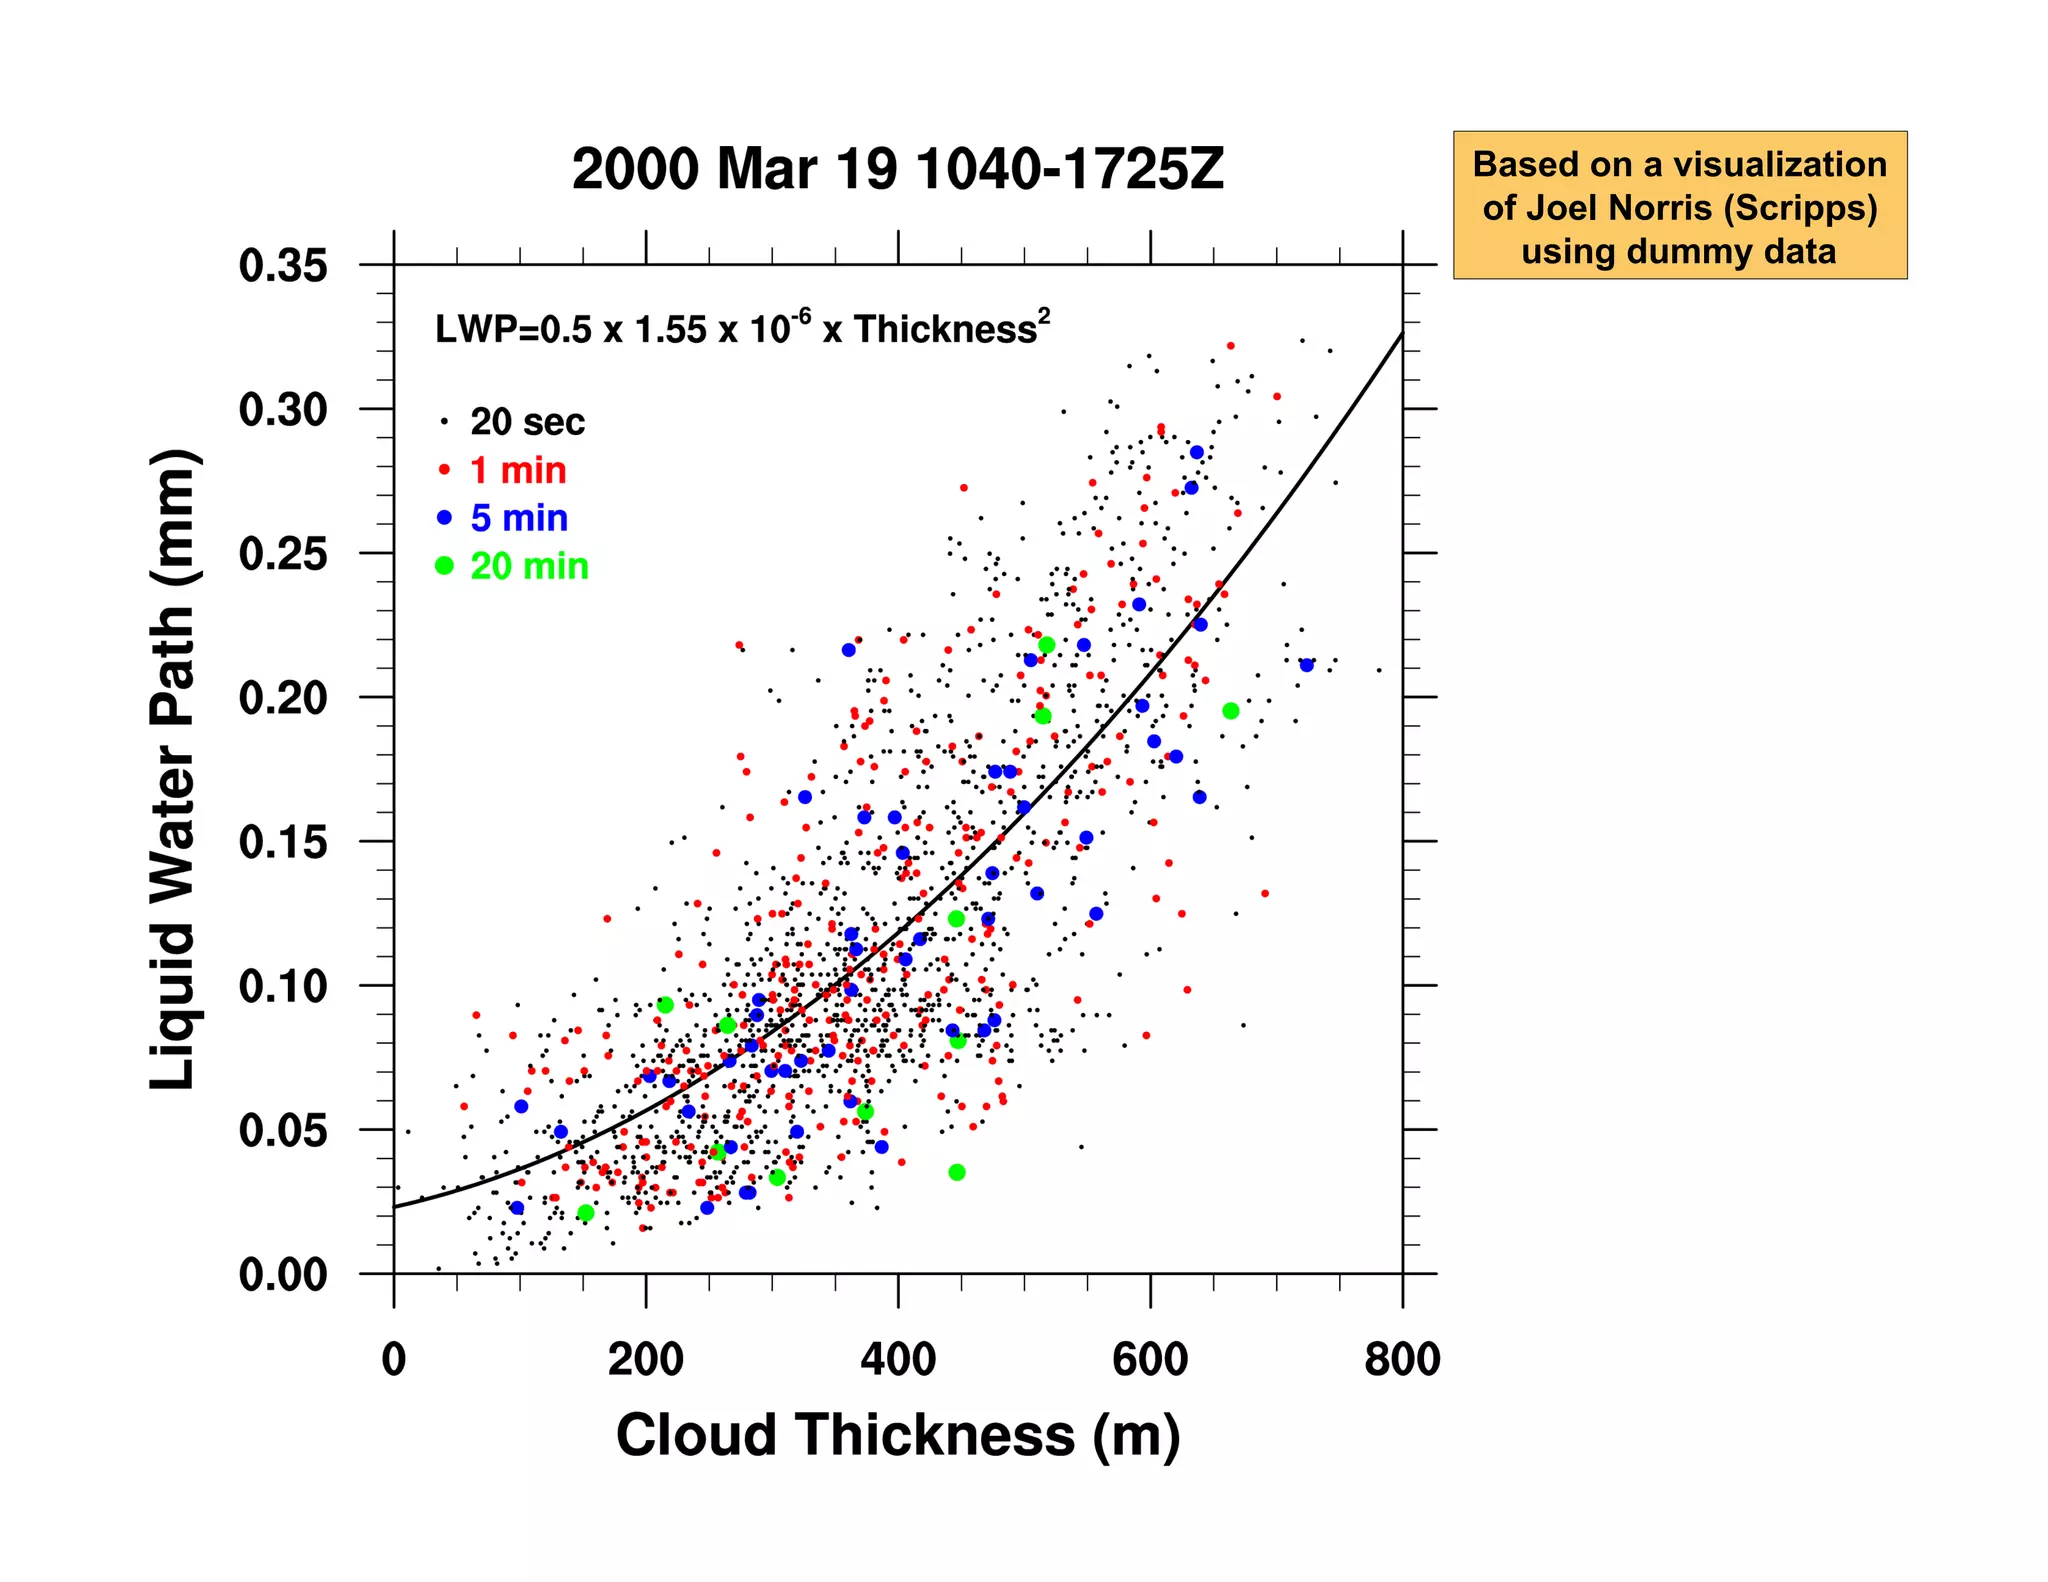
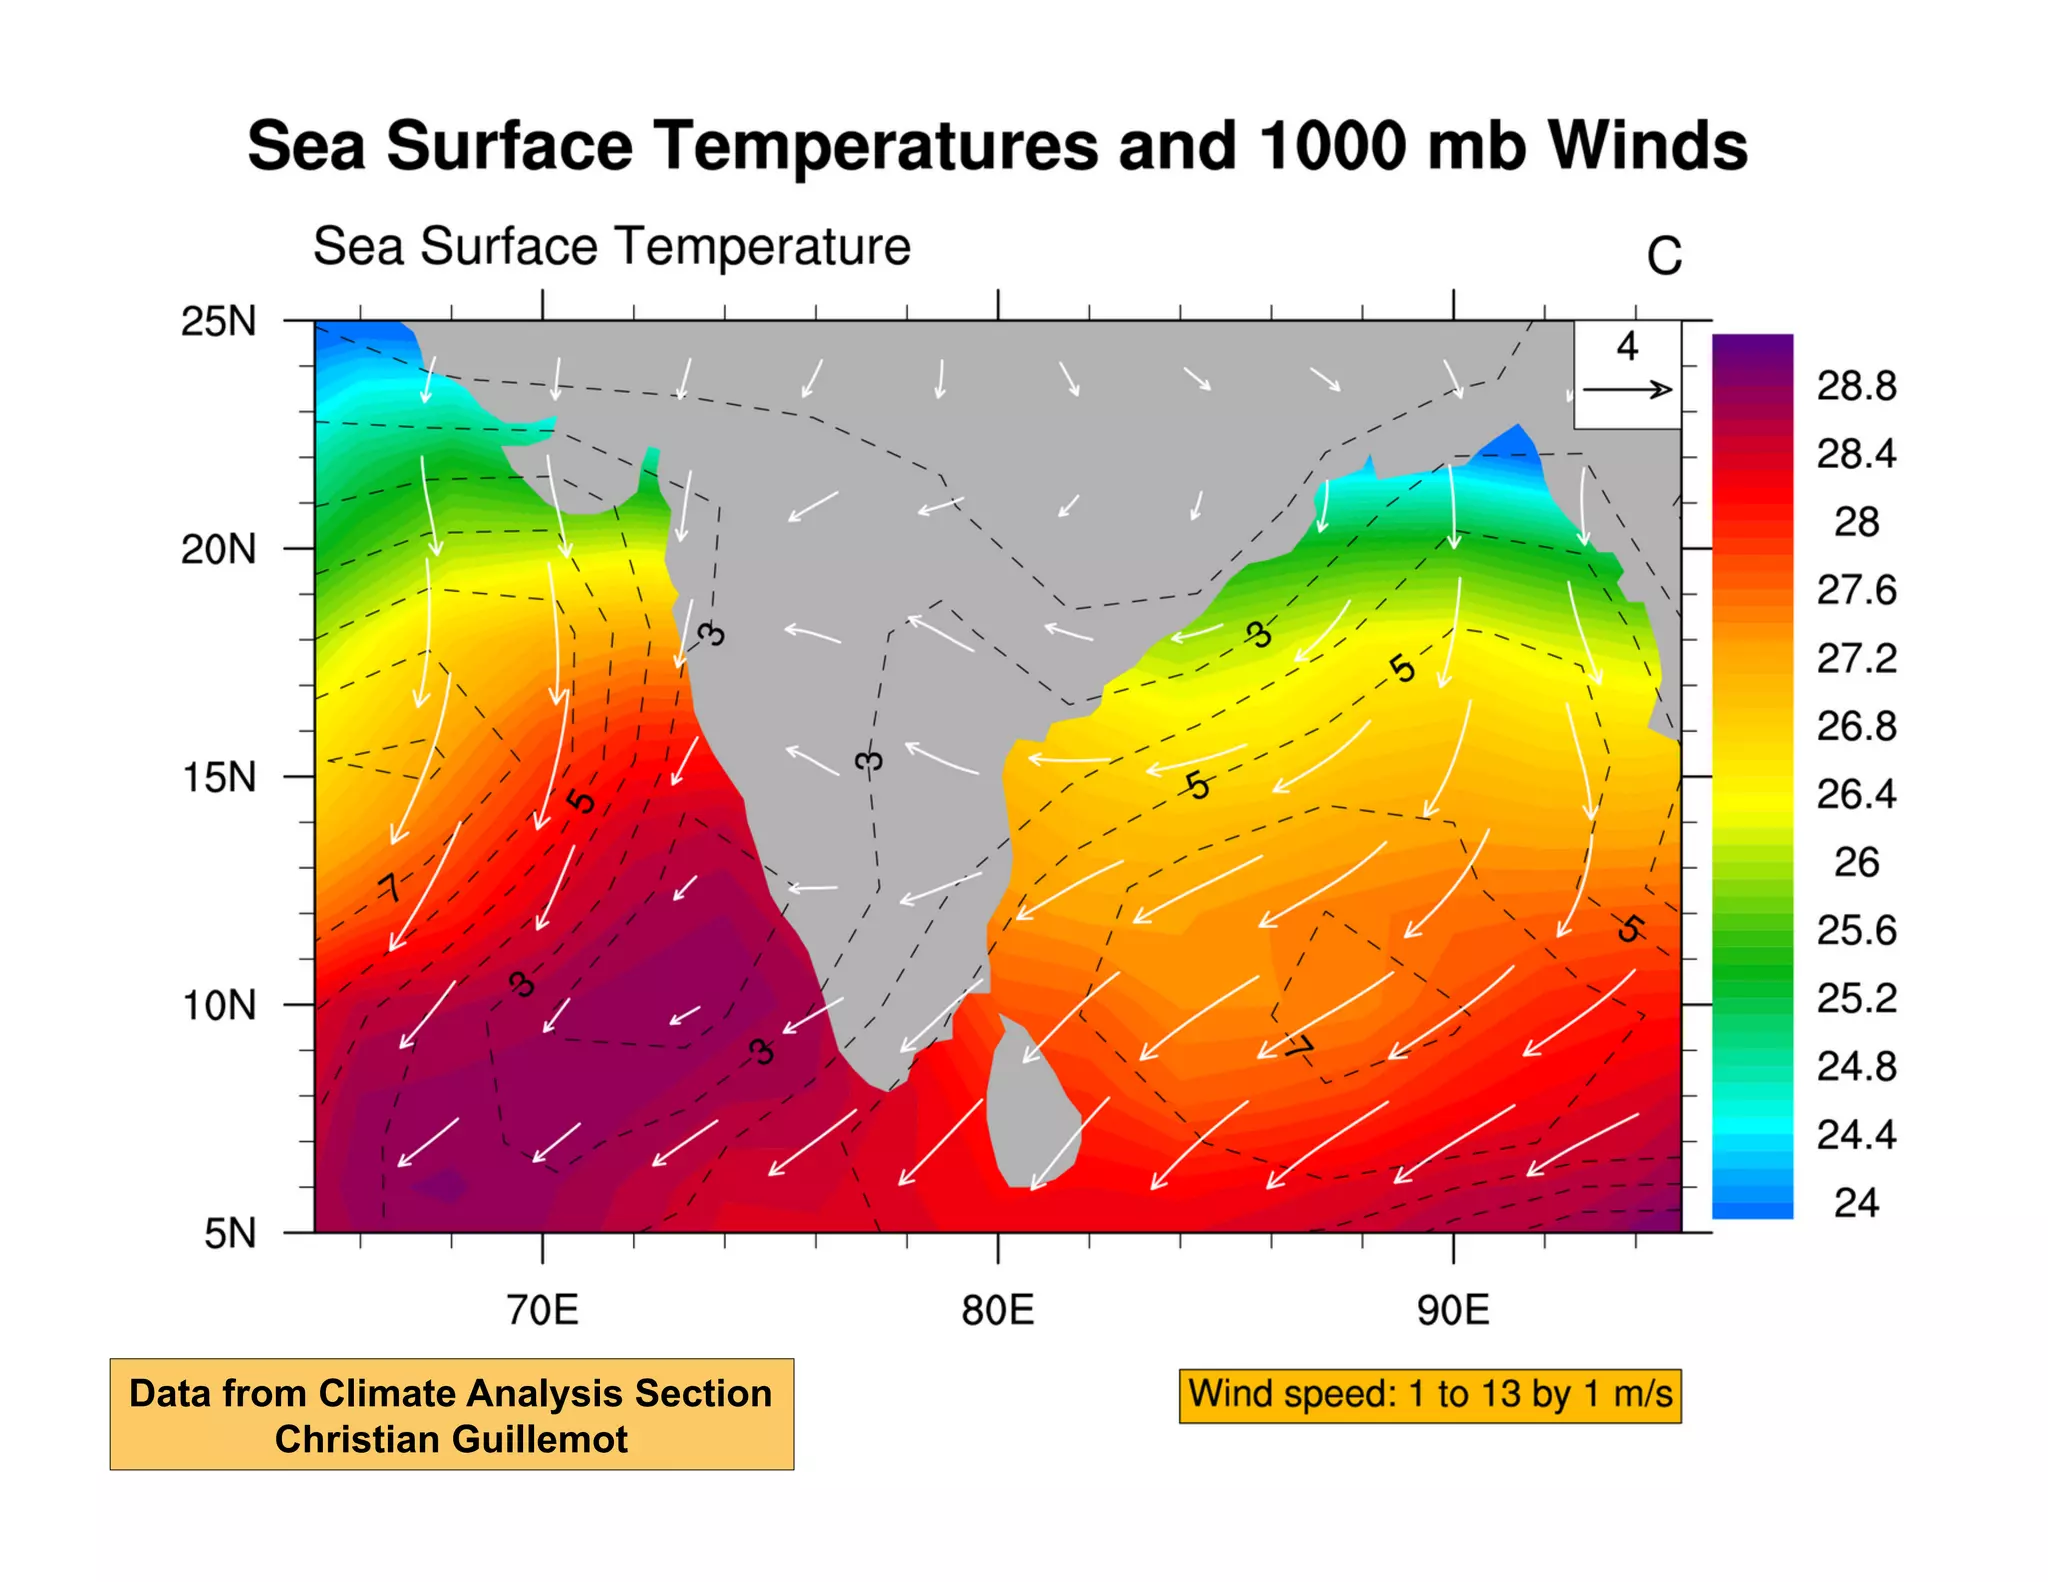

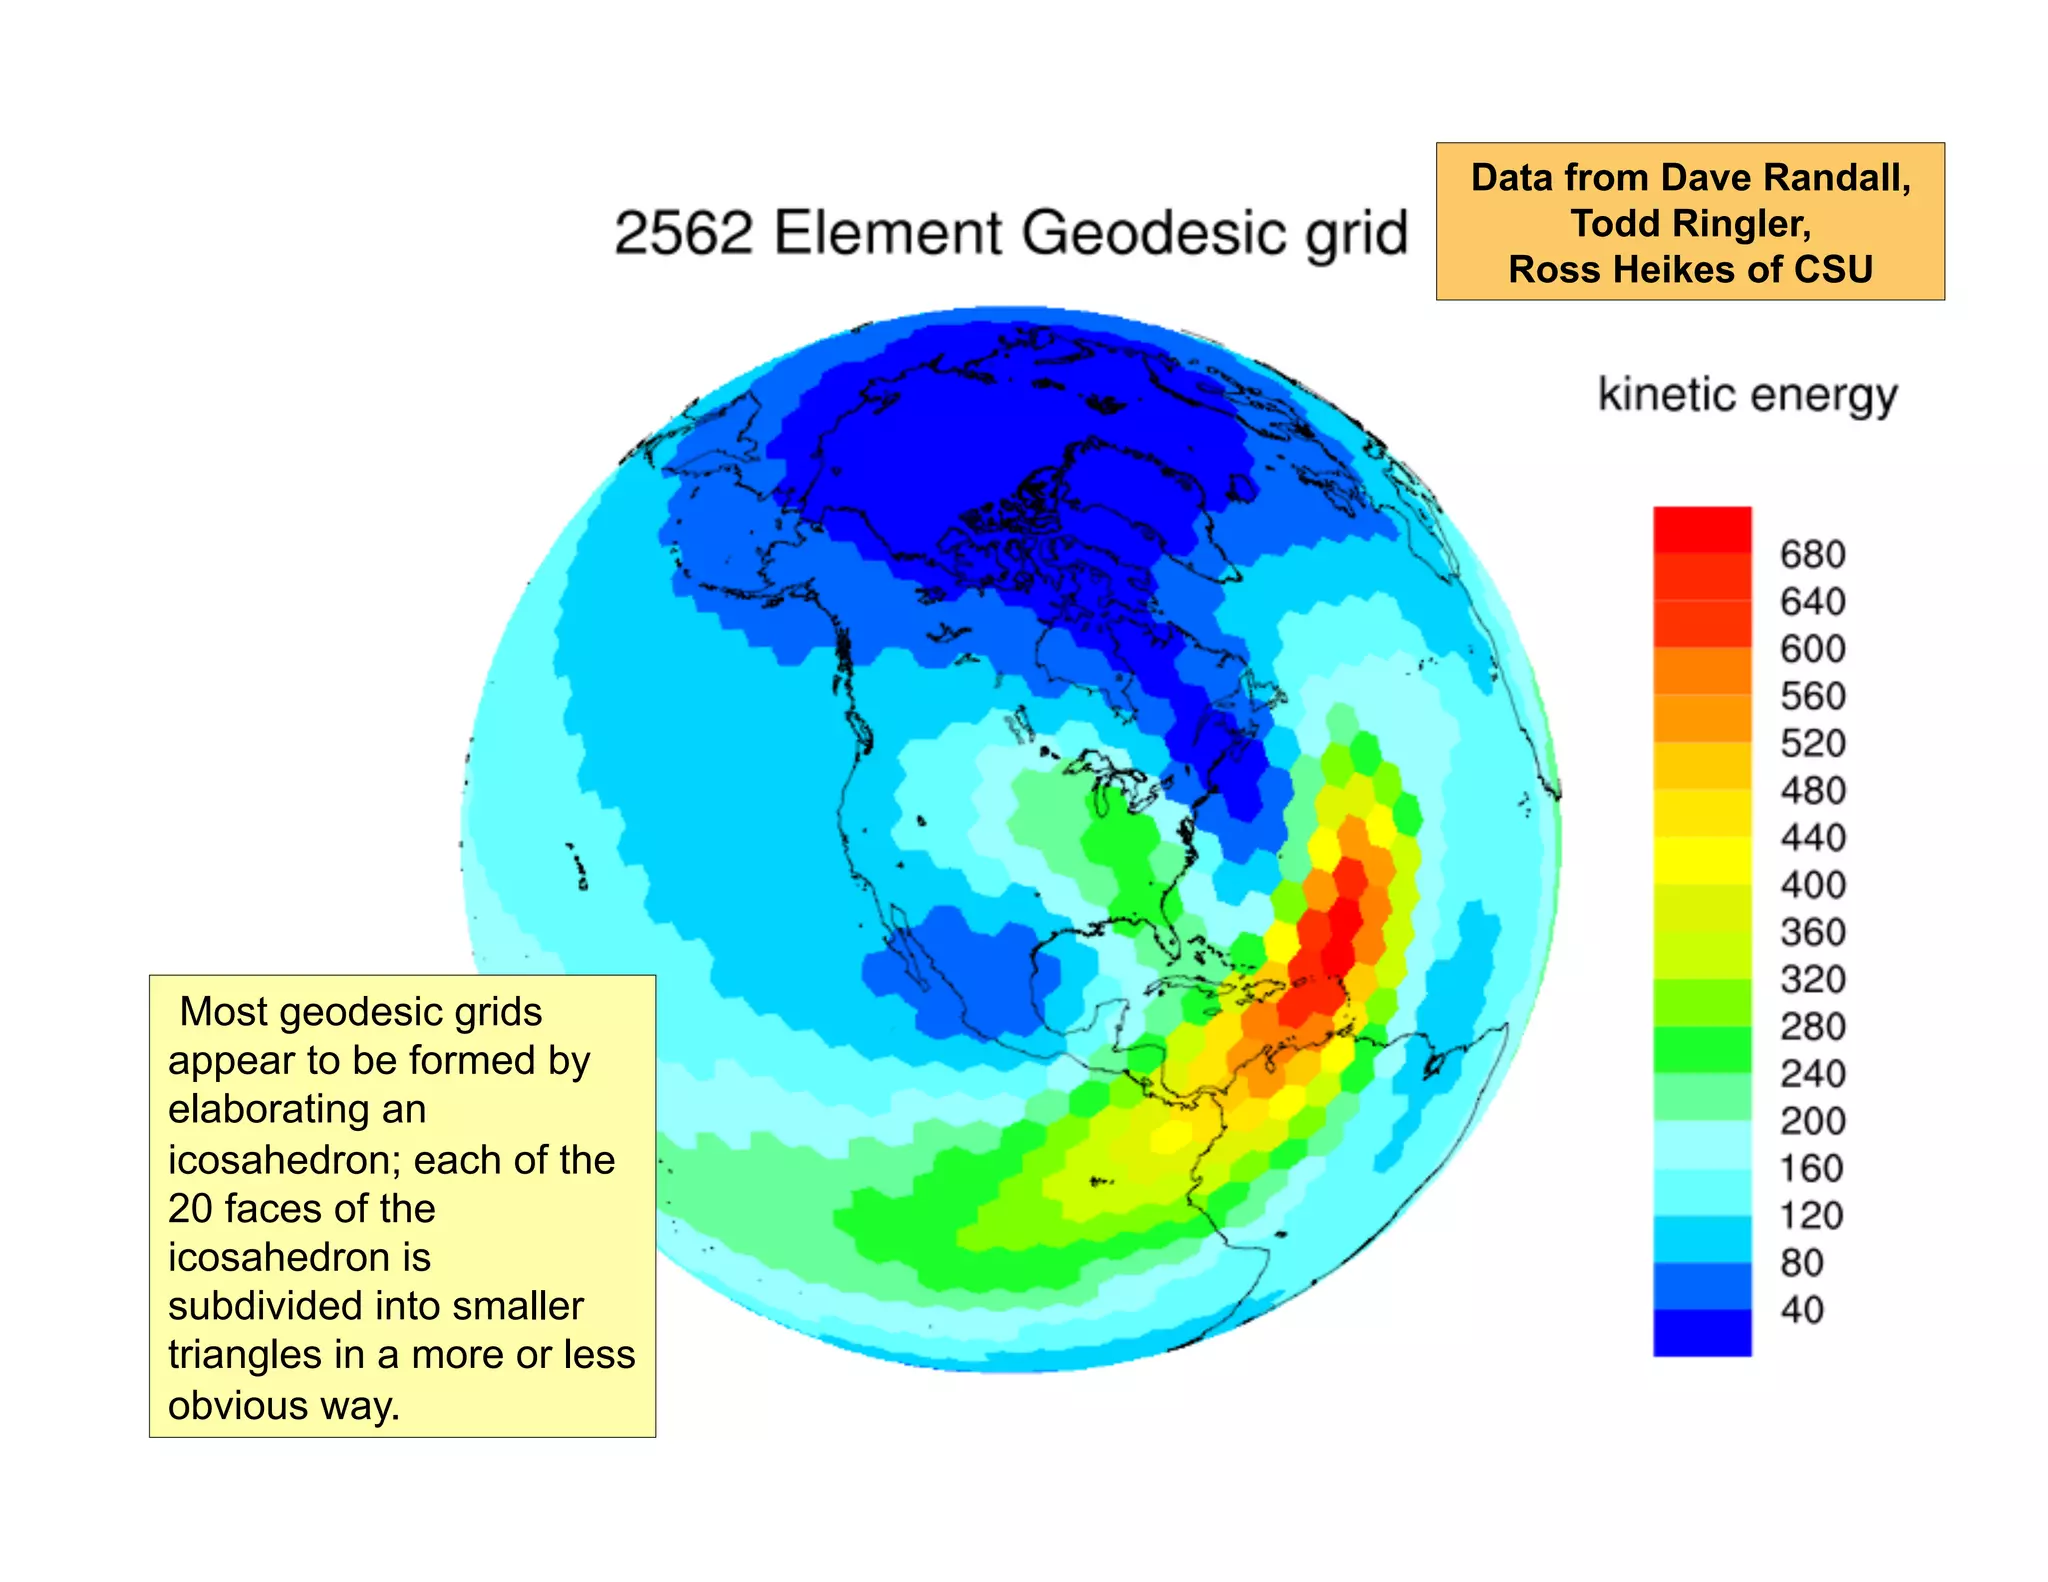
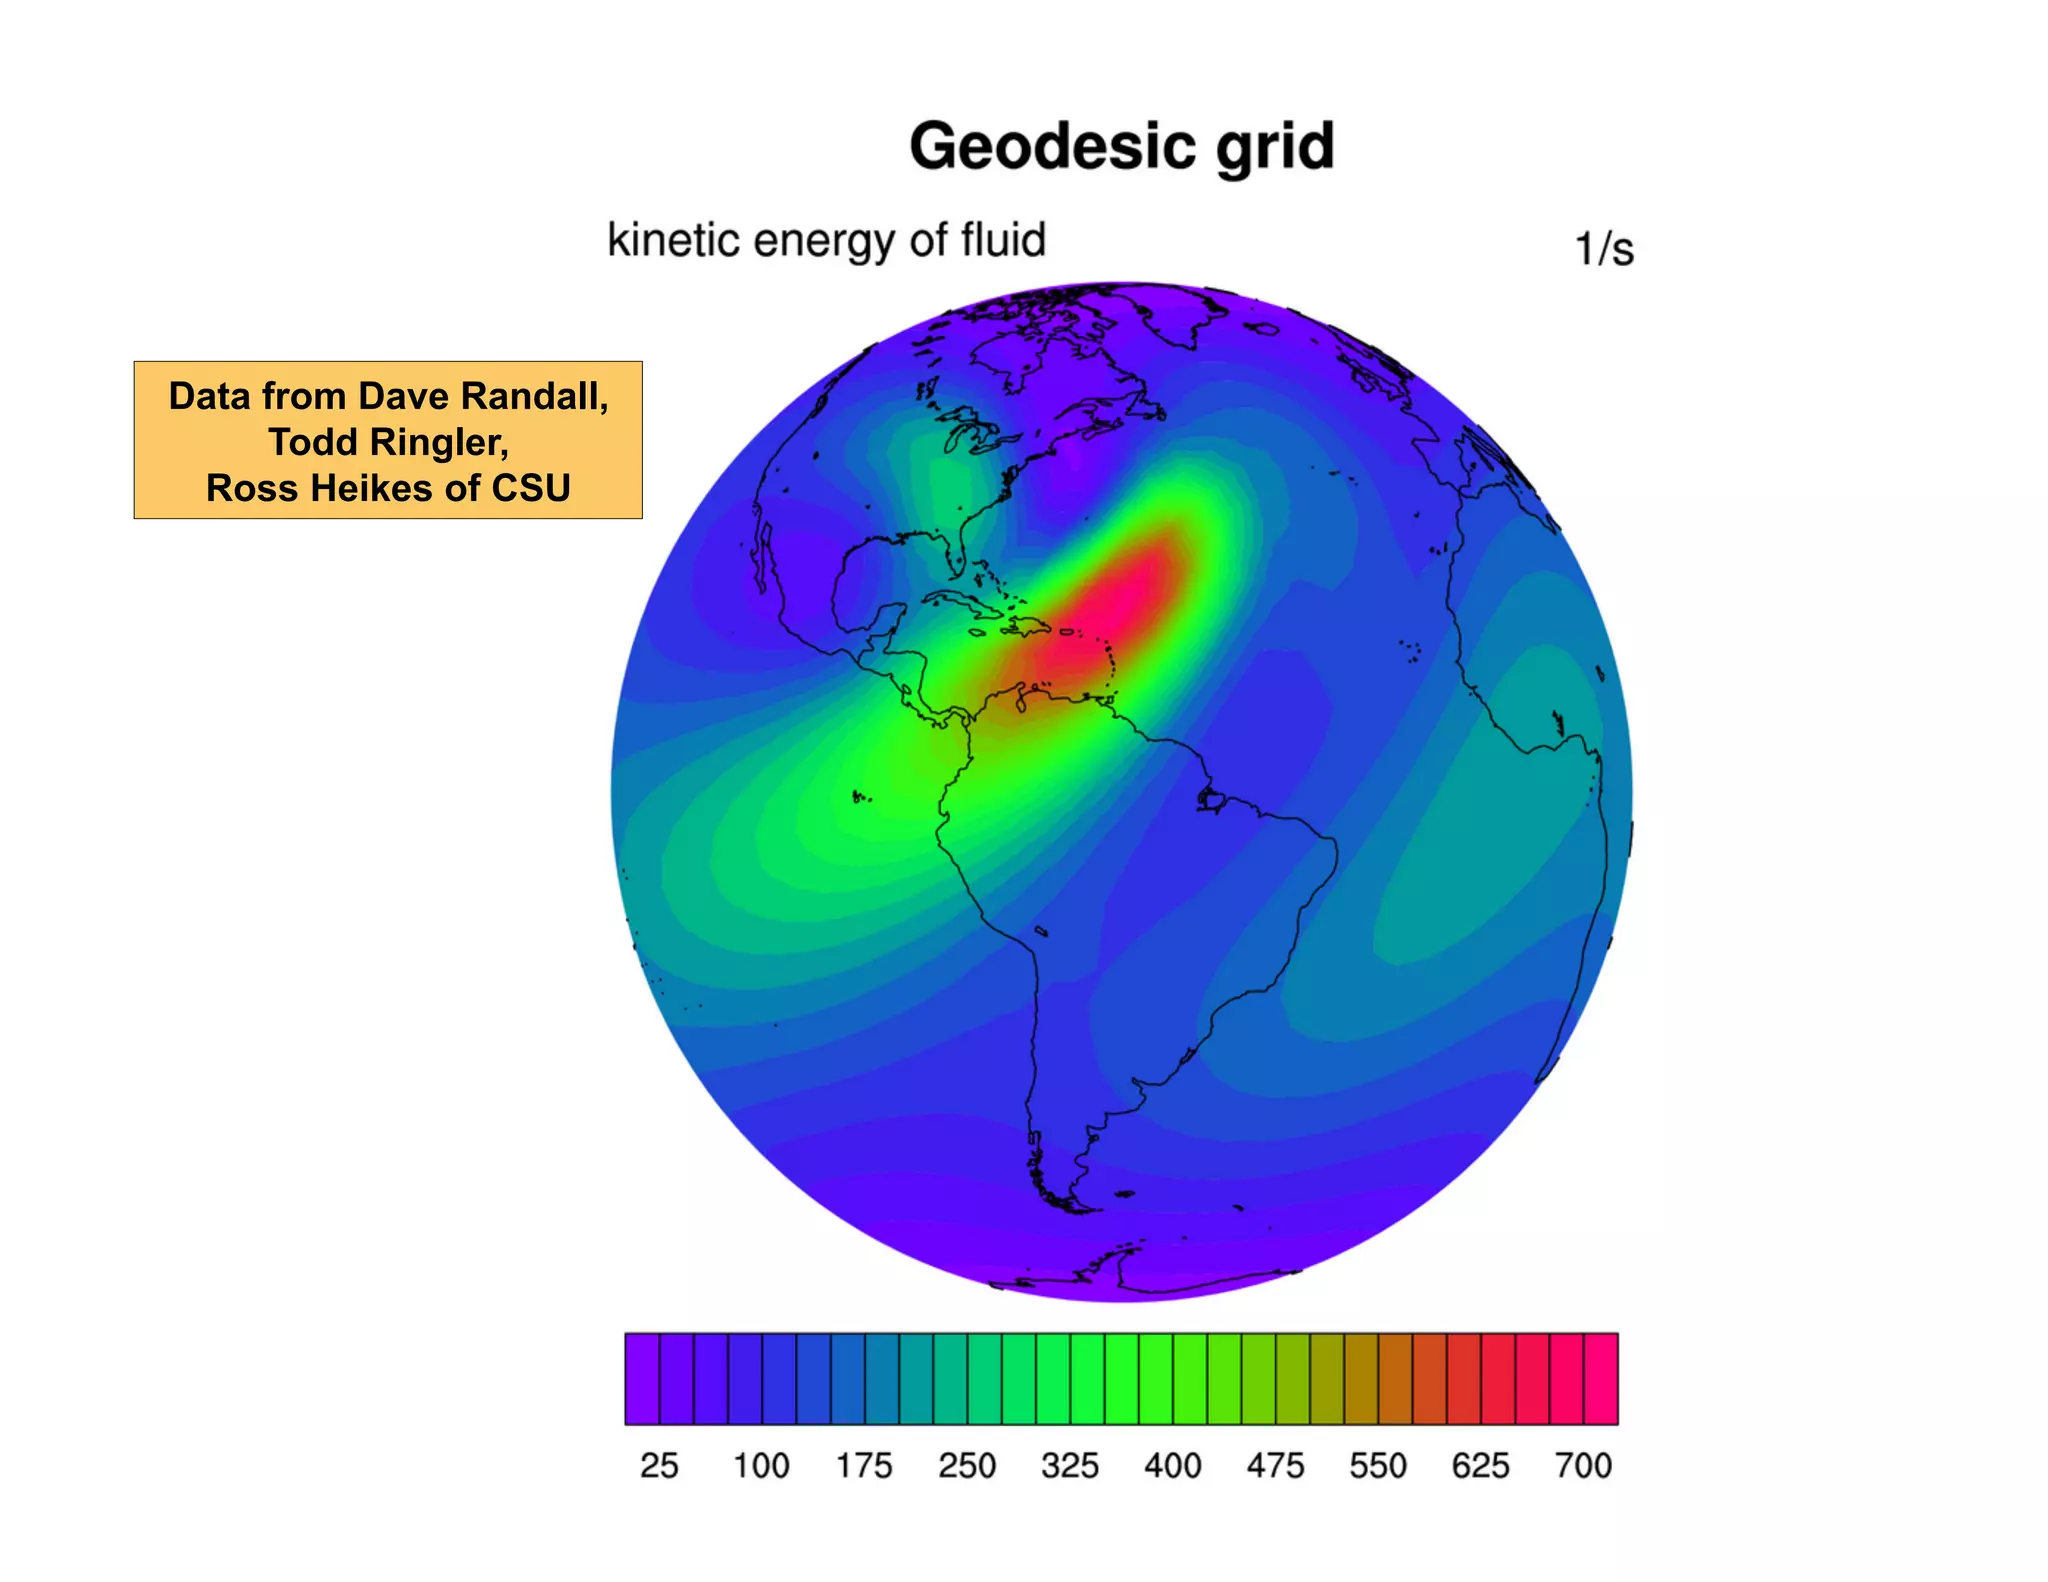
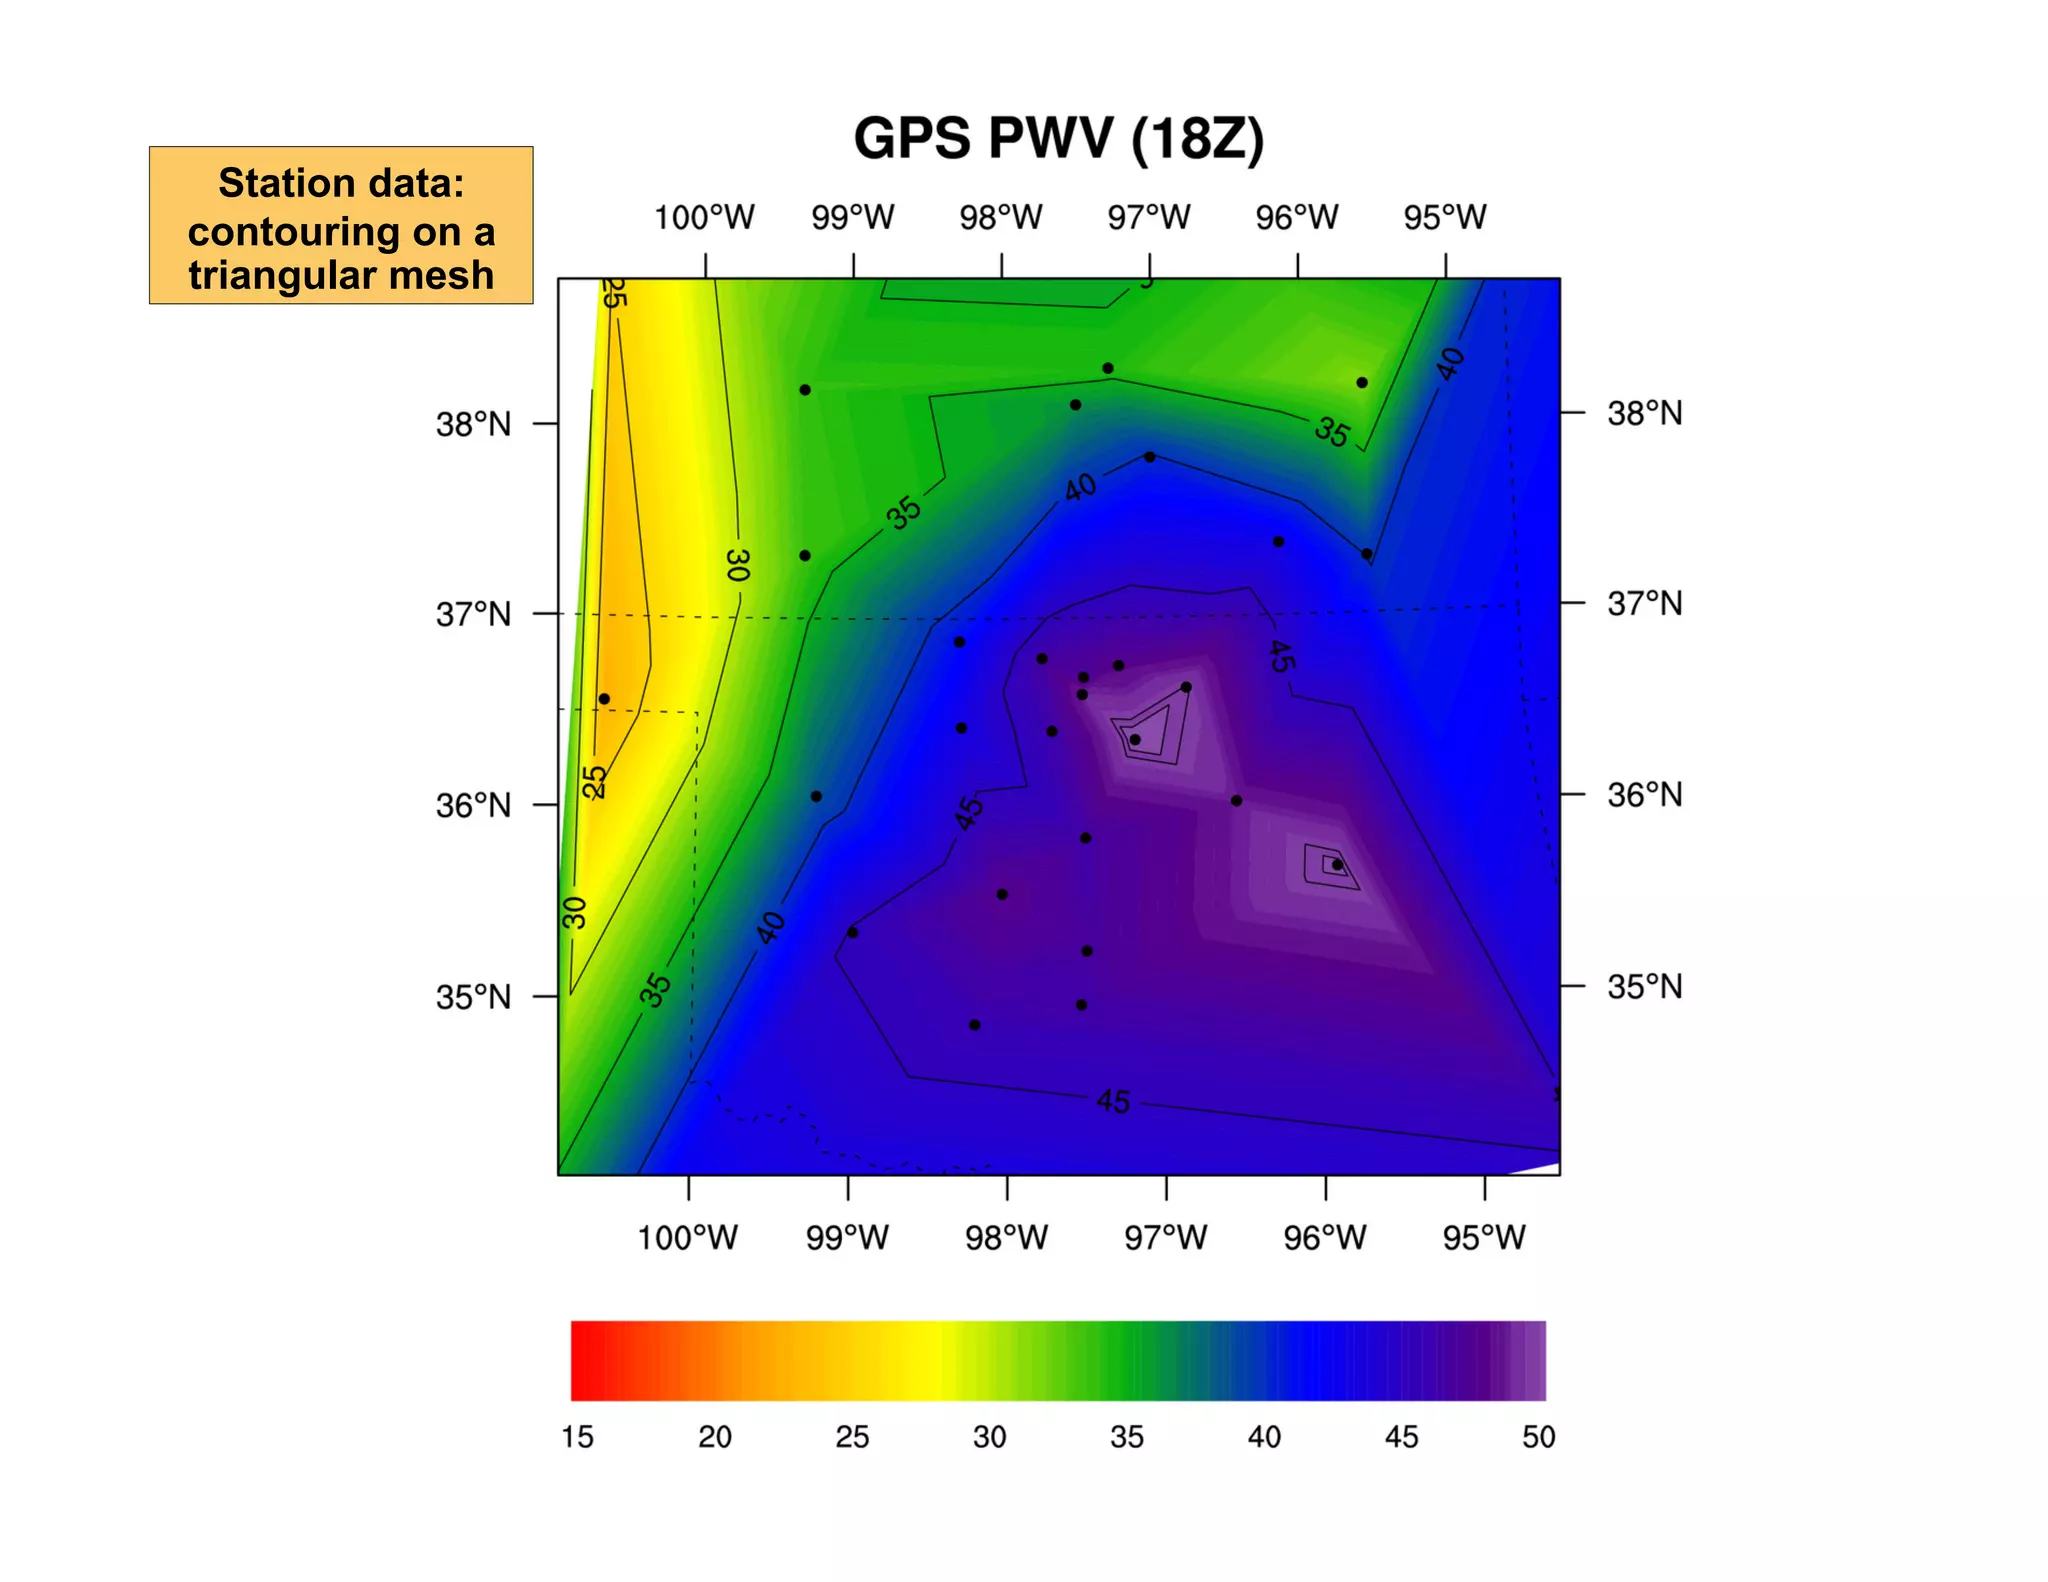
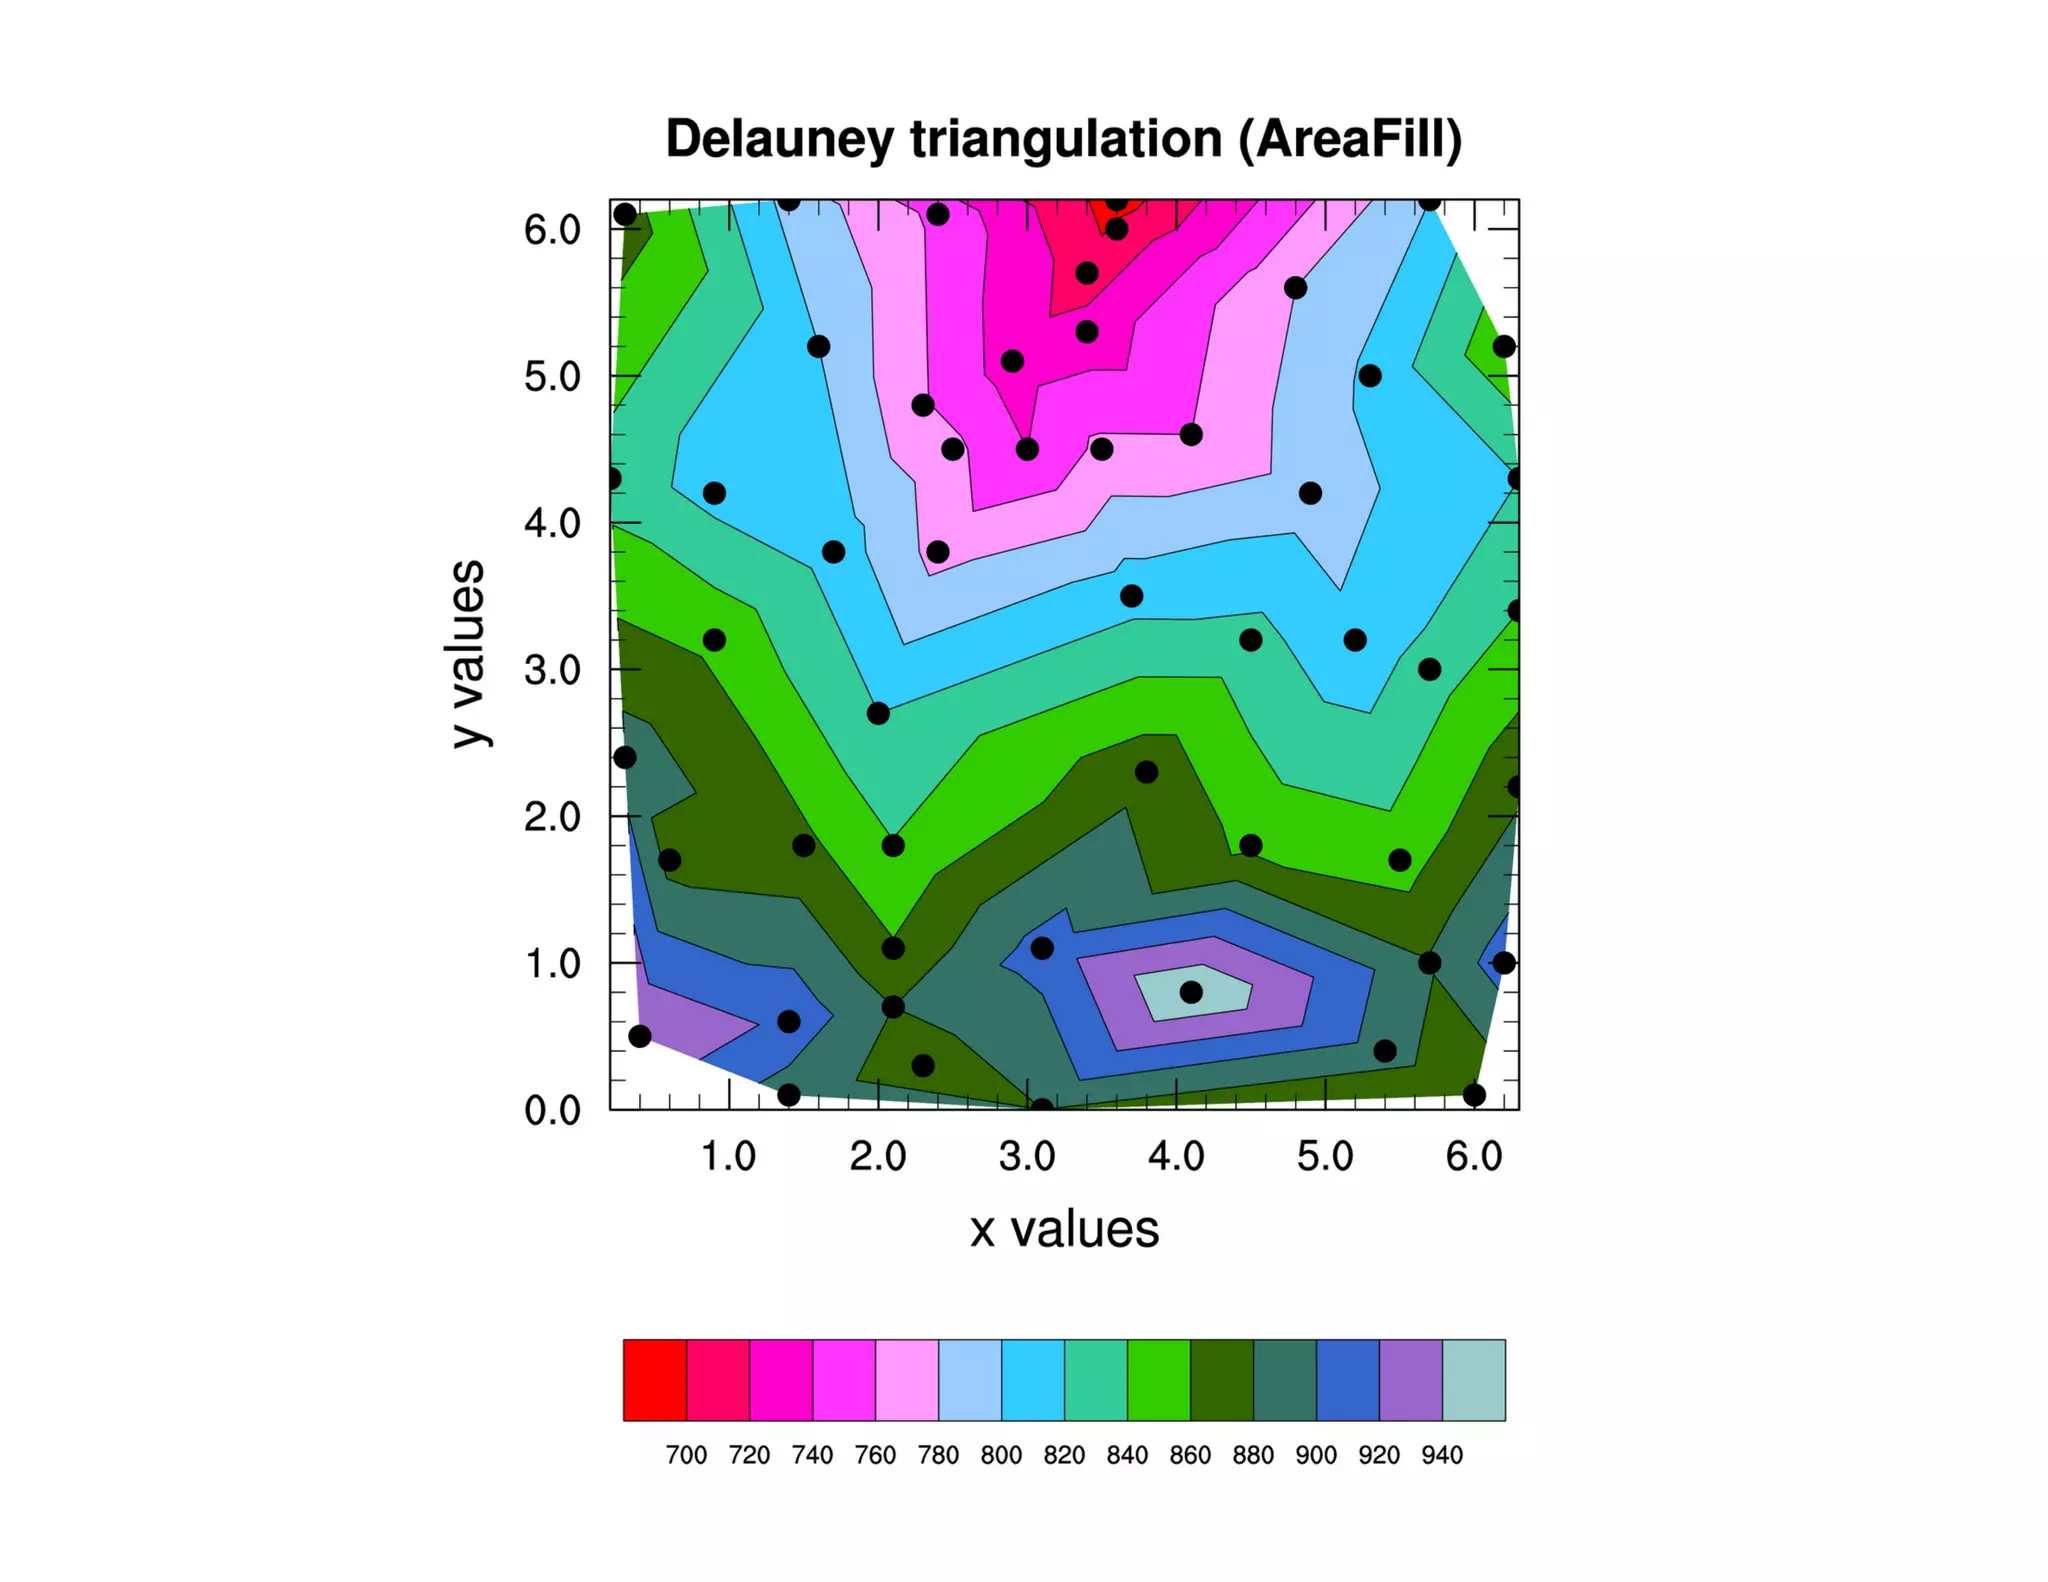

The document provides an overview of geoscience data analysis and visualization tools from the National Center for Atmospheric Research (NCAR). It describes two interfaces - the NCL scripting language and the Python modules PyNGL and PyNIO - that provide capabilities for data input/output, analysis, and visualization. Key topics covered include an introduction to NCL and PyNGL/PyNIO, the data model and file format support, visualization examples, and the status and distribution of the software.