Download to read offline


![Alcohol guidelines 7
2 Background
History of alcohol guidelines
5. Concerns about the rising number of alcohol-related deaths and illnesses in the 1970s
prompted the Government to produce a consultative document Prevention and Health:
Everybody’s Business.5
The focus of that document, however, was on overall levels of
alcohol consumption and on corresponding legal, fiscal and social controls. At the
individual level, alcohol consumption remained a matter of personal choice.6
In 1981, the
UK Health Departments published the booklet Drinking Sensibly, which provided a
definition of alcohol misuse and introduced the concept of sensible drinking. The booklet
called for a programme of public education about sensible drinking.7
It was not until 1984
that guidance on individual drinking was produced, in a pamphlet That’s the Limit,
published by the then Health Education Council. The pamphlet gave “safe limits” for
drinking, defined as 18 “standard drinks” a week for men and 9 for women. One standard
drink was equivalent to one alcohol unit—a concept that would be introduced in the next
edition. The pamphlet also defined “too much” alcohol as 56 standard drinks a week for
men and 35 for women.8
The 1987 edition of the leaflet described units for the first time
and revised the 1984 guidelines down to “sensible limits”—described as the amount to
which people should limit their drinking if they wanted to avoid damaging their health—as
21 units a week for men and 14 for women, with “too much” defined as 36 units for men
and 22 for women. A 1989 edition of the pamphlet contained the same guidelines.9
In 1986
and 1987, the three medical Royal Colleges—the Royal College of General Practitioners,
the Royal College of Physicians and the Royal College of Psychiatrists—produced reports
on alcohol that endorsed the Health Education Council’s 1987 guidelines on sensible
drinking.10
6. The advice of the Royal Colleges and Health Education Council was officially adopted by
government in 1987, in a report that stated “the Government does not wish to discourage
the sensible consumption of alcohol, but is committed to reducing alcohol related harm”.11
In 1992 the sensible drinking message was used to set targets for the reduction of alcohol
misuse in The Health of the Nation and other national health strategies.12
7. By the early 1990s, however, scientific evidence had emerged suggesting that alcohol
might reduce the risks of coronary heart disease (CHD), prompting the Government to set
up an inter-departmental working group to review the guidelines in 1994. The working
5
Department of Health, Sensible Drinking: Report of an inter-departmental working group, 1 December 1995, Annex E
6
Department of Health, Sensible Drinking: Report of an inter-departmental working group, 1 December 1995, Annex E
7
Department of Health, Sensible Drinking: Report of an inter-departmental working group, 1 December 1995, Annex E
8
Department of Health, Sensible Drinking: Report of an inter-departmental working group, 1 December 1995, Annex E
9
Department of Health, Sensible Drinking: Report of an inter-departmental working group, 1 December 1995, Annex E
10
Ev 27 [Department of Health] para 1; The Royal College of General Practitioners, Alcohol: a balanced view , 1987; The
Royal College of Psychiatrists, Alcohol: our favourite drug, 1986; and The Royal College of Physicians, A Great and
Growing Evil: the medical consequences of alcohol abuse, 1987
11
Department of Health, Sensible Drinking: Report of an inter-departmental working group, 1 December 1995, Annex E
12
Department of Health, Sensible Drinking: Report of an inter-departmental working group, 1 December 1995, Annex E](https://image.slidesharecdn.com/guiasalcoholuk-130415104347-phpapp02/85/Guias-alcohol-uk-9-320.jpg)
![8 Alcohol guidelines
group produced the 1995 report Sensible Drinking, that has formed the basis of individual
drinking guidelines since. The most significant change to the Government guidelines was
the move from weekly limits to daily limits. The Royal Colleges also revisited the issue in
1995, including a review of the evidence linking alcohol and CHD, and concluded that the
guidelines adopted in 1987 were still sufficient.13
This marked a divergence in opinion
between the Government and Royal Colleges that is explored further in the next chapter.
8. The Government’s sensible drinking message, based on the analysis in the 1995 report
and agreed by the devolved health departments, is that:
a. men should not regularly drink more than three to four units a day;
b. women should not regularly drink more than two to three units a day; and
c. after an episode of heavy drinking, it is advisable to refrain from drinking for 48
hours to allow tissues to recover.14
9. The 1995 Sensible Drinking report contained guidance for pregnant women, which was
that “to minimise risk to the developing fetus, women who are trying to become pregnant
or are at any stage of pregnancy, should not drink more than 1 or 2 units of alcohol once or
twice a week, and should avoid episodes of intoxication”.15
Following revised guidelines
published by the Chief Medical Officers in 2006 and advice from the National Institute of
Health and Clinical Excellence (NICE), current guidance for pregnant women in England
is that:
pregnant women or women trying to conceive should avoid drinking alcohol; if they do
choose to drink, to minimise the risk to the baby, they should not drink more than one
to two units of alcohol once or twice a week and should not get drunk.
NICE additionally advised that the risks of miscarriage in the first three months of
pregnancy mean that it is particularly important for a woman not to drink alcohol at all
during that period.16
10. Until 2009, alcohol consumption guidelines had been produced only for adults. The
1995 report considered alcohol consumption by children and young people “very briefly”.17
The Chief Medical Officer for England published specific guidance on the consumption of
alcohol by children and young people in 2009. The advice was that:
• An alcohol-free childhood is the healthiest and best option;
• If children do drink alcohol, they should not do so until at least 15 years old;
• If 15 to 17 year olds drink alcohol, it should be rarely, and never more than once a
week. They should always be supervised by a parent or carer; and
13
Department of Health, Sensible Drinking: Report of an inter-departmental working group, 1 December 1995, Annex E
14
Ev 27 [Department of Health] para 3
15
Department of Health, Sensible Drinking: Report of an inter-departmental working group, 1 December 1995, p 27
16
Ev 27 [Department of Health] para 6
17
Ev 27 [Department of Health] para 8](https://image.slidesharecdn.com/guiasalcoholuk-130415104347-phpapp02/85/Guias-alcohol-uk-10-320.jpg)
![Alcohol guidelines 9
• If 15 to 17 year olds drink alcohol, they should never exceed the recommended
adult daily limits (3-4 units of alcohol for men and 2-3 units for women).18
Alcohol units
11. Units are a fundamental concept used in alcohol guidelines. In the UK, one unit is 8
grams (g) of alcohol.19
One unit, or 8 g, is equivalent to 10 millilitres (ml) of pure ethanol
(alcohol), which is the amount of alcohol the average adult can process within an hour.20
This means that if the average adult consumes a drink containing one unit of alcohol,
within an hour there should in theory be no alcohol left in their bloodstream, although it
will of course differ according to the individual.21
Approximately, one unit equates to a 25
ml measure of spirit or half a pint of beer, whereas a 175 ml glass of wine contains two
units,22
although the situation is complicated by the differing strengths of alcoholic
beverages. The strength of an alcoholic beverage is commonly expressed as alcohol by
volume (ABV) or sometimes just “vol.”.23
For example, if a 750 ml bottle of wine contains
12 per cent ABV, this means that 12 per cent of the total volume of wine (750 ml) is pure
alcohol, which works out to 90 ml alcohol, or 9 units. Within a 175 ml glass of 12 per cent
ABV wine, there will be 2.1 units. A 750 ml bottle of wine with 13 per cent ABV, on the
other hand will contain 9.8 units of alcohol and a 175 ml glass of that wine will contain 2.3
units.
International comparisons
12. Table 1 summarises recommended drinking guidelines from a range of developed
countries.
18
Ev 28 [Department of Health] para 9
19
Ev 30 [Department of Health] para 28
20
Alcohol Units: your guide to alcohol units and measures”, Drinkaware, 25 Oct 2011, Drinkaware.co.uk
21
Alcohol Units: your guide to alcohol units and measures”, Drinkaware, 25 Oct 2011, Drinkaware.co.uk
22
Ev 55 [Drinkaware] para 2.6
23
Alcohol Units: your guide to alcohol units and measures”, Drinkaware, 25 Oct 2011, Drinkaware.co.uk](https://image.slidesharecdn.com/guiasalcoholuk-130415104347-phpapp02/85/Guias-alcohol-uk-11-320.jpg)
![10 Alcohol guidelines
Table 1: International comparisons of recommended alcohol consumption guidelines (countries
ranked according to male daily guidelines)24
Country
(ranked
low to
high)
Unit/
standard
drink
Men Women
Japan 19.75 g 1-2 units/day (19.75-39.5 g/day)
United
States
14 g
1-2 units/day (14-28 g/day), not to
exceed 14 units/week (196 g/week)
1 unit/day (14 g/day), not to exceed
7units/week (98 g/week)
Australia 10 g
no more than 2 standard drinks (20 g)
on any day reduces lifetime risk
no more than 2 standard drinks on any
day
Poland 10 g
2 units/day (20 g/day) up to 5
times/week (not to exceed 100 g/week)
1 unit/day (10 g/day) up to 5 times/week
(not to exceed 50 g/week)
Slovenia N/A
not to exceed 20 g/day and 50 g on a
drinking occasion
not to exceed 10 g/day and not to
exceed 30 g/drinking occasion
Sweden N/A not to exceed 20 g/day not to exceed 20 g/day
Czech
Republic
N/A less than 24 g per day less than 16 g per day
Austria 10 g 24 g pure ethanol per day 16 g pure ethanol per day
Finland 11 g
not to exceed 15 units/week (165
g/week) [equivalent to 24 g/day]
not to exceed 10 units/week (110
g/week)
Germany not to exceed 24 g/day not to exceed 12 g/day
United
Kingdom
8 g
should not regularly drink more
than 3-4 units/day (24-32 g/day)
should not regularly drink more than 2-
3 units/day (16-24 g/day)
Canada 13.6 g
not to exceed 2 units per day (27.2
g/day); 14 units per week (190 g/week)
not to exceed 2 units/day (27.2 g/day); 9
units per week (121.5 g/week)
Portugal
14 g
(unofficial)
2-3 units/day (28-42 g/day) 1-2 units/day (14-28 g/day)
Spain 10 g not to exceed 3 units/day (30 g/day) not to exceed 3 units/day (30 g/day)
New
Zealand
10 g
not to exceed 3 units/day (30 g/day),
21units/ week (210 g/week)
not to exceed 2 units/day (20 g/day), 14
units/week (140 g/week)
France 10 g not to exceed 30 g/day not to exceed 30 g/day
Ireland 10 g
21 units/week (210 g/week) [equivalent
to 30 g/day]
14 units/week (140 g/week)
Romania N/A
not to exceed 32.5 g beer/day or 20.7 g
wine/day
not to exceed 32.5 g beer/day or 20.7 g
wine/day
Denmark 12 g
not to exceed 21 alcohol units (252 g) a
week [equivalent to 36 g a day]
not to exceed 14 (168 g) units a week
South
Africa
N/A
not to exceed 21 units/week (252
g/week) [equivalent to 36 g/day]
not to exceed 14 units/week (168
g/week)
Nether-
lands
9.9 g not to exceed 4 units/day (39.6 g/day) not to exceed 2 units/day (19.8 g/day)
Italy 12 g less than 40 g per day less than 40 g per day
It is worth noting that units vary by country, for example one unit of alcohol in the United
States is 14 g and in Japan a unit is significantly larger at almost 20 g.25
International
24
Ev 45 [The British Beer & Pub Association, The National Association of Cider Makers, The Scotch Whisky Association and
The Wine and Spirit Trade Association]](https://image.slidesharecdn.com/guiasalcoholuk-130415104347-phpapp02/85/Guias-alcohol-uk-12-320.jpg)
![Alcohol guidelines 11
comparisons, therefore, should be adjusted to represent a like-for-like basis. The Sheffield
Addiction Research Group considered that “the UK drinking guidelines can be considered
as in line with other developed nations and there appears no case to be made for altering
them on the basis of international consensus” and stated:
As different nations define a unit of alcohol differently or base guidelines upon the
notion of a ‘standard drink’, it is easier to compare guidelines after converting
recommended levels into pure alcohol consumption in grams. [...]
The UK guidelines recommend not regularly drinking more than 24–32 g of pure
alcohol a day if you are a man and not more than 16-24 g if you are a woman. These
levels are similar to those used in many other nations such as Italy (24–36 g and 12–
24 g), the USA (24 g and 14 g), France (30 g and 20 g), Germany (36 g and 24 g) and
New Zealand (30 g and 20 g). Some nations do have slightly higher
recommendations, particularly for men, such as The Netherlands and Spain (both 40
g and 24 g). Few nations have significantly lower guidelines and those that do include
Denmark (21 g and 14 g), Poland (20 g and 10 g) and Slovenia (20 g and 10 g).26
Dr Richard Harding, member of the 1995 Sensible Drinking working group, told us:
World-wide recommendations on alcohol consumption show wide disparity among
countries. This is in some ways surprising, given that the science is the same
everywhere. But the objective of those who frame such guidance is to influence their
target populations. It follows therefore that several factors then become relevant, e.g.
the behaviour that is thought to be in need of change, the culture and mindset of the
target population, and the kind of message that is likely to be effective.
Therefore the best approach is to formulate advice firmly based on and argued from
the science, but that which is also appropriate to the problems that the UK face and is
likely to be effective, and not to take much notice of what other governments or
health bodies recommend.27
13. The UK’s alcohol guidelines are about average, compared with those of other
developed nations. However, national guidelines can reflect social objectives and
cultural differences as well as scientific evidence, and therefore we do not consider that
international comparisons should be relied on as an indicator of how appropriate the
UK’s alcohol guidelines are.
14. Aside from additions to the advice for pregnant women and children, the guidelines
have not been the subject of a formal review since 1995.28
The next chapter explores the
evidence base for the current guidelines.
25
Ev 45 [The British Beer & Pub Association, The National Association of Cider Makers, The Scotch Whisky Association and
The Wine and Spirit Trade Association] para 27
26
Ev w25, paras 4.1–4.3
27
Ev 50, paras 34-35
28
Ev 28 [Department of Health] para 10](https://image.slidesharecdn.com/guiasalcoholuk-130415104347-phpapp02/85/Guias-alcohol-uk-13-320.jpg)
![12 Alcohol guidelines
3 The evidence base
The 1995 Sensible Drinking report
15. As explained in the previous chapter, today’s alcohol guidelines arose from a review of
the Government’s sensible drinking message in the light of evidence which indicated that
drinking alcohol might give protection from coronary heart disease.29
The findings of the
review were published in the 1995 report Sensible Drinking.30
The Department of Health
explained the process that the working group had followed:
The authors of the 1995 report drew upon a wide range of research, including
epidemiological evidence, and written and oral advice of experts, as set out in the
report. The report considers the harmful effects of alcohol consumption to both
health and mortality and considers the evidence for its potential benefits. [...]
The 1995 report carefully described the scientific basis for its recommendations,
which included review by the authors of the major published research evidence,
review of written evidence submitted by a wide range of contributors, independent
assessment and critique of the medical and scientific evidence by an external
academic statistician, and receipt of oral evidence by invited key experts.31
16. Sources of evidence to the 1995 review included relevant reports of the various Royal
Colleges.32
As mentioned in paragraph 5, these reports had re-endorsed the 1987
consumption guidelines of no more than 21 units of alcohol for men and 14 for women per
week.33
Weekly vs. daily guidelines
17. Possibly the most significant change in the guidelines following the 1995 Sensible
Drinking report was the move from providing weekly guidelines to daily guidelines.
Dr Richard Harding, member of the 1995 Sensible Drinking working group, explained that
the working group had thought it sensible to move away from advice based on weekly
consumption in favour of daily consumption because “weekly drinking could mask
episodes of heavy drinking (21 units/week could be consumed in two binges of 10 units
each)”. The working group also considered that it was difficult for individuals to keep
account of their own consumption over a week. Furthermore, there was evidence that
showed there could be benefit in regular drinking, so long as it was moderate. As a result,
the working group decided to couch advice in terms of daily drinking.34
29
Department of Health, Sensible Drinking: Report of an inter-departmental working group, 1 December 1995
30
Department of Health, Sensible Drinking: Report of an inter-departmental working group, 1 December 1995
31
Ev 27, paras 1–2
32
Ev 27 [Department of Health] para 1; The Royal College of General Practitioners, Alcohol: a balanced view , 1987; The
Royal College of Psychiatrists, Alcohol: our favourite drug, 1986; and The Royal College of Physicians, A Great and
Growing Evil: the medical consequences of alcohol abuse, 1987
33
Department of Health, Sensible Drinking: Report of an inter-departmental working group, 1 December 1995, Annex E
34
Ev 48 [Dr Richard Harding] para 26](https://image.slidesharecdn.com/guiasalcoholuk-130415104347-phpapp02/85/Guias-alcohol-uk-14-320.jpg)
![Alcohol guidelines 13
The Sensible Drinking report therefore stated that for men:
Regular consumption of between 3 and 4 units a day by men of all ages will not
accrue significant health risk.
Consistently drinking 4 or more units a day is not advised as a sensible drinking level
because of the progressive health risk it carries.35
And for women:
Regular consumption of between 2 and 3 units a day by women of all ages will not
accrue any significant health risk.
Consistently drinking 3 or more units a day is not advised as a sensible drinking level
because of the progressive health risk it carries.36
18. Two concerns were raised about the shift to daily guidance. First, the change appeared
to increase the weekly “allowance” of alcohol from 21 for men and 14 for women to 28 for
men and 21 for women. The Institute of Alcohol Studies (IAS) argued that the move:
effectively increased the weekly limit for men by 33 per cent and women 50 per cent,
exceeding the recommended threshold for low risk drinking as presented by the
medical profession. These changes were met with concern by the health community,
as they contradicted the evidence base.37
Secondly, some felt that the move “appeared to endorse daily drinking”.38
This issue is
examined in paragraph 49 where we look at drinking patterns.
Health benefits of drinking alcohol
19. The primary rationale for the shift to daily guidelines was evidence that regularly
drinking alcohol at low quantities may confer health benefits, particularly in relation to
coronary heart disease (CHD), which, according to Dr Marsha Morgan, Institute of
Alcohol Studies, is where “the biggest body of evidence on the potential beneficial effects of
alcohol” lies.39
According to the 1995 Sensible Drinking report, “the evidence shows alcohol
consumption confers protection from CHD mortality, starting at levels as low as 1 unit a
day”.40
However, the report also cautioned that there was only a slight dose response
relationship, meaning that drinking more than one to two units a day “confers only a little
extra benefit” and that at very high levels of consumption, the risk of mortality increases.41
20. The report summarised possible biological mechanisms that would explain the
beneficial effect, although it acknowledged that a causative mechanism had not been firmly
35
Department of Health, Sensible Drinking: Report of an inter-departmental working group, 1 December 1995
36
Department of Health, Sensible Drinking: Report of an inter-departmental working group, 1 December 1995
37
Ev 74 [Institute of Alcohol Studies] para 1
38
Ev w32 [Grampian Alcohol and Drugs Partnerships] para 3.1.2
39
Q 10
40
Department of Health, Sensible Drinking: Report of an inter-departmental working group, 1 December 1995, para 5.5
41
Department of Health, Sensible Drinking: Report of an inter-departmental working group, 1 December 1995, para 5.5](https://image.slidesharecdn.com/guiasalcoholuk-130415104347-phpapp02/85/Guias-alcohol-uk-15-320.jpg)
![14 Alcohol guidelines
established. It explained that a major cause of CHD is deposition of fatty tissues in
coronary arteries, largely consisting of cholesterol, which cause narrowing or blockages of
arteries. In blood, two types of protein work to either increase or decrease cholesterol
levels. Simply put, low density lipoproteins (LDL) carry most of the cholesterol in blood
and high density lipoproteins (HDL) remove cholesterol. It is the ratio of LDL and HDL
that determines how much cholesterol is deposited in fatty tissues in arteries. The report
stated that:
Physical activity appears to raise HDL cholesterol but does not change LDL
cholesterol levels. Alcohol, more than any other dietary factor, raises HDL levels in
the blood. In addition, however, alcohol lowers LDL blood levels, and it has been
speculated that it is through these lipoprotein cholesterol pathways that alcohol
inhibits the formation of coronary [fatty tissues].42
Another significant biological mechanism was thought to be that alcohol reduced blood
clotting. Additional and less widely acknowledged mechanisms were also offered,
including that alcohol:
a) might lower blood pressure;
b) caused increased blood flow;
c) could reduce coronary artery spasm induced by stress.43
However the report noted that “the full significance of these additional mechanisms awaits
further research”.44
The submission from the International Scientific Forum and Alcohol in
Moderation stated that “the message is little and often as the blood thinning effect of
alcohol lasts for approximately 24 hours and one drink confers the benefit”.45
Interestingly,
the report also explored the theory that the low rates of CHD in predominantly wine
drinking countries could be caused by the presence of antioxidants and other constituents
in wine. The report concluded that “overall, current research indicates that the major factor
conferring benefit is probably alcohol rather than the other constituents of wine”.46
21. The report highlighted other potential benefits from drinking alcohol, including mixed
evidence for the effects of alcohol on stroke risks and a possible protective effect from
gallstones. It had also been reported that there could be a reduced risk of non insulin-
dependent diabetes, stress, rheumatoid arthritis, gastro-intestinal diseases and colds,
although the report stated that “in our view, this evidence is not sufficiently strong or
consistent to inform public policy”.47
42
Department of Health, Sensible Drinking: Report of an inter-departmental working group, 1 December 1995, para 5.7
43
Department of Health, Sensible Drinking: Report of an inter-departmental working group, 1 December 1995
44
Department of Health, Sensible Drinking: Report of an inter-departmental working group, 1 December 1995, paras
5.8–5.9
45
Ev w10, para 1.7
46
Department of Health, Sensible Drinking: Report of an inter-departmental working group, 1 December 1995, para 5.11
47
Department of Health, Sensible Drinking: Report of an inter-departmental working group, 1 December 1995, para 5.20](https://image.slidesharecdn.com/guiasalcoholuk-130415104347-phpapp02/85/Guias-alcohol-uk-16-320.jpg)
![Alcohol guidelines 15
22. The theory that drinking alcohol at low quantities might confer health benefits greater
than abstainers would enjoy, but that drinking alcohol at high quantities increases
mortality risk is represented by the J-shaped curve.
Figure 1: The J-shaped curve for all cause mortality and alcohol consumption48
Explanatory note: A confidence interval helps assess the likelihood of a result occurring by chance. A
confidence interval represents a range of values that is believed to encompass the “true” value with
high probability (usually 95%). In figure 1, this means that the wider the gaps between confidence
intervals surrounding the trends for men and women, the more uncertainty there is.
The International Scientific Forum on Alcohol Research and Alcohol in Moderation
explained that:
The J shaped curve shows that light and moderate drinkers of any form of alcohol
live longer than those who abstain or drink heavily. The relative risk of mortality is
lowest among moderate consumers (at the lowest point of the J), greater among
abstainers (on the left-hand side of the J), and much greater still among heavy
drinkers (on the right-hand side of the J). In addition to longevity in general, the J-
shaped relationship also exists for cardiovascular deaths, specifically for coronary
heart disease and ischemic stroke.49
The greater uncertainty for women, represented by the wider confidence intervals, may be
due to a lack of evidence: the Sensible Drinking report noted that “sufficient studies on all
cause mortality do not exist to indicate clearly the advantages or disadvantages of alcohol
to women as compared to men”.50
This issue is explored further in paragraph 29.
48
Ev w9 [International Scientific Forum on Alcohol Research and Alcohol in Moderation]
49
Ev w10, para 1.3
50
Department of Health, Sensible Drinking: Report of an inter-departmental working group, 1 December 1995
1.4
1.3
1.2
1.1
1.0
0.9
0.8
0.7
0.6
0 1 2 3 4 5 6 7
Men
Women
Confidence Intervals
RelativeRiskofTotalMortality
Drinks per Day Alcohol Consumption](https://image.slidesharecdn.com/guiasalcoholuk-130415104347-phpapp02/85/Guias-alcohol-uk-17-320.jpg)
![16 Alcohol guidelines
23. The evidence we took during this inquiry suggested that a number of experts were less
convinced that alcohol caused beneficial effects in the body. For example, Sir Ian Gilmore,
Royal College of Physicians, stated:
There probably is an effect, but it does not affect the main age group that is damaged
by alcohol. The peak deaths from alcohol are among 45 to 65-year-olds, who are in
the most productive phase of their lives. Certainly young people damaged by alcohol
get no cardio-vascular benefit whatsoever. There are serious scientists who still
believe that the apparent cardio-vascular benefits are spurious. [...] I believe it is
overplayed as a benefit.51
Professor Nick Heather, Alcohol Research UK, agreed, and stated:
when the “Sensible Drinking” report was written [...] there was much more
confidence in the cardio-protective effect, which is reflected in the report [...] That
consensus has now largely disappeared, which is the result of more careful research.52
Dr Marsha Morgan noted that “there is enormous contention [...] in general” and pointed
out that “if there were to be a cardio-protective effect, it would selectively be found in
middle-aged men and post-menopausal women, and you do not gain that protective effect
in middle life by drinking at a younger age”.53
She also disputed the evidence for other
beneficial effects of alcohol and highlighted evidence that had emerged since 1995 on
alcohol-related cancer risks:
The two other areas where there have been alleged protective effects are in the
development of diabetes and possibly [...] on the development of cancers. However,
the evidence is very thin. There is no body of evidence like that for the cardio-
protective effect. Much more important, since the guidelines were last considered in
1995, is that the major body of evidence has been on the detrimental effect of alcohol
and the cancer risk, particularly for breast cancer in women, and that the risk levels
are not far off the top end of the current guidelines. Although there have been some
reports in the press for a protective effect about diabetes and some types of cancer,
there is not a strong evidence base.
Equally, there is much more important evidence that we did not have in 1995 which
suggests a quite significant risk of cancer of the oropharynx, larynx and oesophagus
and cancers among people who already have liver damage, and there is evidence on
breast cancer and to a degree some early evidence on bowel cancer. As far as I am
concerned, those detrimental effects overwhelm any potential benefit that there
might be on diabetes.54
24. One reason why the beneficial effects of alcohol are disputed lies in the methods used to
gather data and produce studies. To determine whether alcohol has a beneficial effect, the
mortality risks of drinkers must be compared to lifelong non-drinkers, or abstainers. We
51
Q 8
52
Q 9
53
Q 10
54
Q 10](https://image.slidesharecdn.com/guiasalcoholuk-130415104347-phpapp02/85/Guias-alcohol-uk-18-320.jpg)
![Alcohol guidelines 17
heard that some studies had in fact included “sick quitters”—that is, individuals who
abstained from alcohol because “they have an alcohol problem or are unwell”—in the
abstainer category.55
This would make abstainers appears less healthy and thus indicate
that there could be health benefits gained from drinking alcohol. Professor Heather stated
that more careful research on the cardio-protective effects of alcohol had shown that
“people who were classified as lifetime abstainers were not really lifetime abstainers”.56
In
response, Dr Richard Harding, member of the working group, stated that:
The “sick quitter” hypothesis is that the abstainers are unwell and therefore have a
higher rate of disease. However, some studies have been large enough to take them
out, yet when you omit the sick quitters and lifetime abstainers you still see the effect.
In many studies, the confounding factor has been taken care of.57
In addition, there are methodological difficulties that arise from proving causation; that is,
whether alcohol itself confers health benefits rather than confounding factors such as
eating healthily and exercising, which may be common behaviours amongst moderate
drinkers. Studies may also be skewed by inaccurate reporting of alcohol consumption by
individuals.58
The Department of Health’s view on the matter was that:
A number of studies have been published since 1995 on the protective effects of low
level alcohol consumption. Some have suggested that the effect for coronary heart
disease may have been over-estimated [...] We think it likely that the conclusion of
the 1995 report that a risk reduction is likely from levels of regular consumption as
low as one unit per day, with limited additional benefit at levels above that, is still
correct. However, we have acknowledged in advice to the public that a similar
reduction of risk may be achieved through other means such as improved diet and
exercise.59
We asked Anne Milton MP, Parliamentary Under-Secretary of State for Public Health,
whether the Government believed that alcohol had beneficial effects. She responded:
There is, possibly, evidence to suggest that it remains true for older adults. However,
a number of experts and research books recently have raised some questions about
the robustness of that body of evidence.60
Dr Mark Prunty, Senior Medical Officer for Substance Misuse Policy, Department of
Health, added:
It is true that the number of studies has increased and multiplied. There have been
major reviews which have looked at the methodology underpinning those studies
and questioned their robustness. [...] There is still evidence of the health benefits,
particularly for coronary heart disease, but it is certainly true that the concerns about
55
Q 8
56
Q 8
57
Q 9
58
Ev 37 [Alcohol Research UK] paras 2.8.1–2.8.4
59
Ev 28, para 15
60
Q 94](https://image.slidesharecdn.com/guiasalcoholuk-130415104347-phpapp02/85/Guias-alcohol-uk-19-320.jpg)
![18 Alcohol guidelines
how robust the methodology is and whether there are other confounding factors has
strengthened considerably, particularly in the last five to 10 years.
There has also been increasing consensus that many of those benefits are likely to be
achieved by other methods as well, such as diet and exercise. Certainly, the British
Heart Foundation has come to the conclusion that equal or greater benefit may be
accrued by diet and exercise, to which the 1995 report did refer.61
25. There is a lack of consensus amongst experts over the health benefits of alcohol, but
it is not clear from the current evidence base how the benefits of drinking alcohol at low
quantities compare to those of lifelong abstention. In addition, it seems likely that the
same purported health benefits could be gained through a healthy lifestyle. Therefore
we are sceptical about using the alleged health benefits of alcohol as a basis for daily
alcohol guidelines for the general adult population, particularly as these benefits would
apply only to men over 40 years and post-menopausal women and the guidelines are
aimed at all adults.
Older people
26. As mentioned above, the CHD benefits of alcohol would be predominantly applicable
to men over 40 years and post-menopausal women. In June 2011, the Royal College of
Psychiatrists published a report on alcohol related harm in the elderly. The report
concluded that “because of physiological and metabolic changes associated with ageing,
these [Department of Health] ‘safe limits’ are too high for older people; recent evidence
suggests that the upper ‘safe limit’ for older people is 1.5 units per day or 11 units per
week”.62
The Institute of Alcohol Studies was critical of the report63
and the Royal College
of Physicians stated:
there is no arbitrary age when drinking patterns should be advised to change.
Individual factors also contribute to the risks of alcohol consumption, including
factors such as medication use, co-morbidity and frailty, as well as the physiological
changes associated with ageing.
Recommended limits for safe drinking by older people in the UK require further
consideration, especially considering the ageing UK population alongside changing
drinking patterns, which are expected to increase alcohol-related morbidity and
mortality.64
27. The International Scientific Forum on Alcohol Research and Alcohol in Moderation
considered that despite suggestions that older people should drink below daily guidelines,
“moderate, regular consumption within the guidelines helps protect against cardiovascular
disease, cognitive decline and all cause mortality, especially among post menopausal
women and men over 40”.65
Sir Ian Gilmore, Royal College of Physicians, considered there
61
Q 95
62
Ev w43, para 6
63
Ev 79, Attachment 4
64
Ev 73, paras 41-42
65
Ev w12, para 1.20](https://image.slidesharecdn.com/guiasalcoholuk-130415104347-phpapp02/85/Guias-alcohol-uk-20-320.jpg)
![Alcohol guidelines 19
was a rationale for setting lower limits for older people, based on their “propensity to fall”
as well as the prevalence of other diseases.66
However, he brought the question back to the
issue of complexity:
If you start saying that it should be different for men and women, different for people
under 65 and over, different for pregnant and not pregnant women, and different for
under age and over 18, you run the risk of getting to a level of complexity that will
not be understood by the public.67
28. As the Government provides guidelines for specific population groups such as
children and pregnant women already, we consider that there could be merit in
producing guidelines for older people, balancing evidence of beneficial effects of
alcohol with evidence of increased risks. We deal with the issues of guideline complexity
further in the next chapter.
Women and alcohol
Lower guidelines
29. The 1995 report Sensible Drinking recognised the difficulties of providing guidelines for
women and alcohol, stating that “the problems of giving accurate advice and information
about sensible drinking are nowhere more evident than in this area”, explaining that while
the broad spectrum of alcohol-related disease and social problems was similar for both
sexes, there was a “less secure scientific literature from which to make conclusions about
women as compared with men”.68
The report considered physiological differences between
men and women and health risks to women such as coronary heart disease, breast cancer
and liver disease. The tendency for women to drink less than men at that time was also
considered. The report stated that there was, in particular, “very little data linking high
levels of consumption in women with a variety of alcohol related diseases”.69
The
conclusion was that it was not possible to produce an authoritative statement about women
and alcohol as the scientific evidence did not allow that clarity. However, the report stated
there was “sufficient indication from the physiology and the patterns of illness for women
overall to be advised to drink at lower levels than men”.70
30. We were interested in exploring whether the basis for the guidelines for women were
still considered to be scientifically sound, 16 years after the Sensible Drinking report was
published. Dr Marsha Morgan explained that:
women have less body water [than men]. [...] the difference in how the body is made
up between fat and water means that, if a woman of 70 kg drinks a double gin, a man
of 70 kg would have to drink a triple gin to match her blood alcohol level. Her blood
alcohol tends to be about a third higher on a weight-for-weight basis. The tissue dose
66
Q 23
67
Q 23
68
Department of Health, Sensible Drinking: Report of an inter-departmental working group, 1 December 1995
69
Department of Health, Sensible Drinking: Report of an inter-departmental working group, 1 December 1995
70
Department of Health, Sensible Drinking: Report of an inter-departmental working group, 1 December 1995, para 8.7](https://image.slidesharecdn.com/guiasalcoholuk-130415104347-phpapp02/85/Guias-alcohol-uk-21-320.jpg)
![20 Alcohol guidelines
of alcohol that she receives is clearly higher. Overall, the propensity for her to
develop harm therefore kicks in earlier, after seemingly less alcohol. That is
beautifully demonstrated in studies of the 1970s from Germany, where they looked
at the risk of developing cirrhosis of the liver, which kicked in at as low as 20 grams
of alcohol per day for women and at about 40 or 50 grams for men. There is a
physiological basis to it, and there is epidemiological evidence showing that the risk
of harm is higher. That was very much behind the 21:14 differential [...] decided on
in 1987. [...] There is a physiological basis for assuming that women are at a different
risk, and there is epidemiological evidence that clearly shows that that is the case.71
Aside from a minority, such as the Association of Small Direct Wine Merchants, who
stated that “suggesting 2–3 units of alcohol a day for women or 3–4 alcohol units a day for
men without reference to body size [...] is akin to having driving speed limits of 20–30
MPH for women or 30–40 MPH for men”,72
most of the written submissions we received
did not challenge the advice that women should be advised to drink less than men, based
on health risks. In fact, it appeared that even more evidence had emerged to support this
since 1995. For example, Dr Morgan explained that “since the guidelines were last
considered in 1995, [...] the major body of evidence has been on the detrimental effect of
alcohol and the cancer risk, particularly for breast cancer in women”.73
However,
Dr Harding suggested that as women “are exposed to the risk of cardio-vascular diseases”
after the menopause, “the benefit that they gain from moderate consumption after the
menopause would outweigh any increased risk of cancer”.74
31. The issue of whether alcohol confers health benefits has already been discussed in
paragraph 19. We are content that there is sufficient physiological and epidemiological
evidence on health risks to support the retention of lower drinking guidelines for
women in general.
Drinking during pregnancy
32. The Sensible Drinking report’s advice on alcohol and pregnancy was that “to minimise
risk to the developing foetus, women who are trying to become pregnant or are at any stage
of pregnancy, should not drink more than 1 or 2 units of alcohol once or twice a week, and
should avoid episodes of intoxication”.75
In 2006, the UK Chief Medical Officers published
revised guidelines taking into account a report commissioned by the Department of Health
on the fetal effects of prenatal exposure.76
The UK Chief Medical Officers advised that
“pregnant women or women trying to conceive should avoid drinking alcohol; if they do
choose to drink, to minimise the risk to the baby, they should not drink more than one to
two units of alcohol once or twice a week and should not get drunk”.77
In England, this was
71
Q 22
72
Ev w4, para 3.3
73
Q 10
74
Q 10
75
Department of Health, Sensible Drinking: Report of an inter-departmental working group, 1 December 1995
76
Gray, R. and Henderson J., “Report to the Department of Health: Review of the fetal effects of prenatal alcohol
exposure”, May, 2006
77
Ev 27, para 6](https://image.slidesharecdn.com/guiasalcoholuk-130415104347-phpapp02/85/Guias-alcohol-uk-22-320.jpg)
![Alcohol guidelines 21
followed by guidance from the National Institute for Health and Clinical Excellence
(NICE) in 2007, who advised that the risks of miscarriage in the first three months of
pregnancy mean that it is particularly important for a woman not to drink alcohol at all
during that period.78
A slight divergence of advice occurs in Scotland, where the Scottish
Chief Medical Officer’s current advice on alcohol and pregnancy is that “there is no ‘safe’
time for drinking alcohol during pregnancy and there is no ‘safe’ amount”.79
33. It is generally accepted that high alcohol consumption levels can be harmful during
pregnancy.80
However, the expert views we received suggested that no “safe limit” of
alcohol consumption had been identified and that a great deal of uncertainty remains.81
This scientific uncertainty can be used to produce contrasting but equally probable
statements: (i) there is no evidence for a level of risk-free drinking during pregnancy;82
and
(ii) drinking one to two units once or twice a week has not been shown to be harmful.83
Faced with this uncertainty, the development of policy and provision of definitive advice is
difficult84
and a precautionary approach is clearly attractive to health advice providers. For
example, the Royal College of Obstetricians and Gynaecologists highlighted that the
positions of its counterparts in the USA, Canada, Australia and New Zealand were, based
on factors such as insufficient evidence and a lack of consensus, to encourage abstinence
during pregnancy.85
The UK’s Chief Medical Officers (CMOs) reviewed the guidelines
for drinking during pregnancy in 2006 and produced updated guidelines that
encouraged abstinence but also provided advice for women who chose to drink. We are
satisfied that the CMOs have recently reviewed the evidence base and consider that the
current guidance adequately balances the scientific uncertainty with a precautionary
approach. However, we note that the Scottish CMO has adopted different advice.
Consistency of advice across the UK would be desirable.
Sources of scientific advice
34. Sources of scientific advice to Government on alcohol guidelines include the Chief
Medical Officers and NICE. We asked Sir Ian Gilmore whether the Government used
advice from a wide enough range of sources, and he responded:
They do not use a sufficient evidence base when it comes to developing alcohol
policy. That evidence base can come from a wide range of sources, whether it is
social sciences, clinical sciences or basic sciences. The problem that I have is that the
evidence is out there on what will reduce alcohol-related harm, but it is true that we
need to persuade the Government to use that evidence.86
78
Ev 27, para 6
79
Ev 27, para 7
80
Royal College of Obstetricians and Gynaecologists, Alcohol consumption and the outcomes of pregnancy, March 2006
81
Royal College of Obstetricians and Gynaecologists, Alcohol consumption and the outcomes of pregnancy, March 2006
82
Ev 77 [Institute of Alcohol Studies] para 4
83
Ev w38 [Royal College of Obstetricians and Gynaecologists] paras 1.2-1.3
84
Ev 36 [Alcohol Research UK] para 2.6.1
85
Ev w39 [Royal College of Obstetricians and Gynaecologists] para 1.5
86
Q 27](https://image.slidesharecdn.com/guiasalcoholuk-130415104347-phpapp02/85/Guias-alcohol-uk-23-320.jpg)
![22 Alcohol guidelines
The Minister told us that the Department of Health monitors the evidence base “in a
variety of ways”, both by using its own internal experts and commissioning external advice
and support from various bodies.87
Chris Heffer, Deputy Director, Alcohol and Drugs,
Department of Health, described some of the “bespoke” research that had been
commissioned by the Department in recent years, including on pricing, licensing and other
alcohol policies. However, he noted that “we have not, to my knowledge, done specific
research on the guidelines of particular health risks”.88
35. The Institute of Alcohol Studies suggested that the Government establish a working
group, “with representation of health experts, to regularly review the evidence base and
provide scientific advice for public health messaging on alcohol”.89
Dr Harding said that
although all of the relevant information is published in the literature, “what is needed is a
mechanism that brings it all together in a fair and balanced way, so that sensible public
health messages can be crafted”.90
He suggested that a review of the relationship between
alcohol consumption and disease was “overdue” and recommended the establishment of “a
multidisciplinary team, involving experts in the appropriate fields [for example] alcohol
misuse, epidemiology, public health, heart disease, dementia, and social science, who are
knowledgeable about the current scientific data and who are capable of taking a broad
overview”.91
The Department of Health stated that it was “not currently planning a formal
review of the guidelines, but would be willing to consider this if it were felt to be useful”.92
36. When we announced our inquiry into alcohol guidelines in July 2011, there was some
media speculation about the possibility of increasing the guideline limits. This appeared to
be based on international comparisons with countries that set higher drinking limits in
public guidelines as well as the claim that the Royal College of Physicians’ 1987 guidelines
were “plucked out of the air”.93
However, none of our expert witnesses recommended an
increase, and several were in fact adamant that the guidelines should not be increased.94
Dr Richard Harding also cautioned against relying on international comparisons.95
When
we asked the Minister whether the guidelines should be lowered, she responded: “I do not
believe that there is currently any evidence available that would suggest that we ought to
alter those guidelines”.96
37. We have heard sufficient concerns from experts to suggest that a thorough review of
the evidence on alcohol and health risks is due. The Department of Health and the
devolved health departments should establish a nationwide working group to review
the evidence base and use the findings of the review to provide advice on whether the
87
Q 65
88
Q 66
89
Ev 74, para 2
90
Ev 49, para 31
91
Ev 49, para 32
92
Ev 29, para 19
93
“Healthy alcohol limits likely to be increased”, The Independent, 25 July 2011; “Cheers... An extra glass of wine is fine
as the daily allowance could be raised”, The Daily Mail, 26 July 2011.
94
Q 11 [Professor Nick Heather; Sir Ian Gilmore]
95
Q 11
96
Q 100](https://image.slidesharecdn.com/guiasalcoholuk-130415104347-phpapp02/85/Guias-alcohol-uk-24-320.jpg)

![Alcohol guidelines 25
c) being able to identify the unit content of alcoholic beverages; and
d) understanding the health risks of drinking.
41. A 2009 survey by the Office for National Statistics (ONS) showed that overall, 90 per
cent of respondents “said they had heard of measuring alcohol consumption in units”, up
from 79 per cent in 1997.100
This statistic was echoed by the Minister.101
The ONS noted
that “on the whole, the more people drank, the more likely they were to have heard of
units”.102
Awareness of alcohol units was consistently over 80 per cent across gender, age
and socio-economic groups (with the exception of women over 65, amongst whom
awareness was at 78 per cent).103
These figures were broadly in line with those supplied by
the charity Drinkaware.104
Moreover, public awareness of what the guidelines were had
increased since 1997. However, the ONS acknowledged that having heard of daily
recommended levels did not necessarily mean that people knew what they were:
Forty four percent of people thought correctly that, for men, drinking three or four
units a day was within the guidelines, and 52 per cent said correctly that for women,
drinking two or three units a day was a recommended maximum. These percentages
have increased significantly from 35 per cent and 39 per cent respectively in 1997.
[...] The percentage of people who said they had heard of but did not know the limits
decreased from around 44 per cent in 1997 to around 30 per cent in 2009.105
42. Awareness of the existence of alcohol units did not necessarily translate into an
understanding of the unit content of alcoholic drinks. While 69 per cent of respondents
correctly identified one unit as being equivalent to a 25 ml measure of spirits, and 63 per
cent correctly equated a unit with half a pint of beer, only 27 per cent accurately identified
how much one unit of wine was (“less than a small glass”).106
Around half of respondents
incorrectly thought that one unit of wine was equivalent to one glass of wine. The ONS
offered a partial explanation, which was that public information on the alcohol content of
wine had changed over time.107
Drinkaware’s findings were less positive: the charity
reported that only 38 per cent of adults were able to select a drink from a list which
correctly contained one unit of alcohol, and that this figure did not improve much if the
person was aware of the term “units”.108
Drinkaware stated that “for consumers who are
unable to make a direct correlation between “units” and “drinks” the practical impact of
100
Office for National Statistics, Opinions Survey report No. 42, Drinking: Adults’ behaviour and knowledge in 2009, 2010,
p 61
101
Q 73
102
Office for National Statistics, Opinions Survey report No. 42, Drinking: Adults’ behaviour and knowledge in 2009, 2010,
p 56
103
Office for National Statistics, Opinions Survey report No. 42, Drinking: Adults’ behaviour and knowledge in 2009, 2010,
p 61
104
Ev 56, paras 6.1–6.2
105
Office for National Statistics, Opinions Survey report No. 42, Drinking: Adults’ behaviour and knowledge in 2009, 2010,
p 14
106
Office for National Statistics, Opinions Survey report No. 42, Drinking: Adults’ behaviour and knowledge in 2009, 2010,
p 64
107
Office for National Statistics, Opinions Survey report No. 42, Drinking: Adults’ behaviour and knowledge in 2009, 2010,
p 56
108
Ev 56, para 6.2](https://image.slidesharecdn.com/guiasalcoholuk-130415104347-phpapp02/85/Guias-alcohol-uk-27-320.jpg)
![26 Alcohol guidelines
guidelines will be limited”.109
The Department of Health (DH) has acknowledged that
“public understanding of both unit measures (especially for wine) [...] needs to improve”.110
43. The Association of Small Direct Wine Merchants pointed out that “a UK unit just
happens to be the same as [one centilitre] of alcohol”, (which is equivalent to 10 ml) and
suggested that units should be replaced by centilitres (cl).111
In contrast, Professor Averil
Mansfield, British Medical Association, said:
It is pretty clear that the units that we have at present are as good a way as any of
describing the amount of alcohol that we consume. A lot of effort has been put into
making them understood by the general public. For better or worse, the message
should be retained because it is now fairly widely understood. [...] The other ways, in
milligrams or millilitres, are rather complicated, and we need something simple and
straightforward.112
Jeremy Beadles, Chief Executive of the Wine and Spirit Trade Association added that “the
important thing is that we stick with what we have. Changing now would set us back a long
way”.113
Drinkaware was optimistic, and stated:
Between 2007 and 2010, the UK Government carried out a series of unit guideline
campaigns, spending about £4 million in 2008–2009. The impact of these campaigns
alongside those run by Drinkaware has led directly to an increased awareness and
understanding of unit guidelines and how they translate to individual drinks. It is
our belief that although there are still significant numbers of consumers to inform,
we are certainly approaching a ‘tipping point’ with consumers and that many more
are beginning to understand units on a practical level.114
44. Public awareness of alcohol units appears to be high, but there are problems with
public understanding of how many units are in alcoholic beverages. We see no reason
why the established concept of alcohol units should be changed. We consider that
efforts should be focused on helping people to translate the concept of alcohol units
and sensible drinking guidelines into practice.
Changing behaviour
45. Despite high levels of awareness of units, the ONS survey showed that of the 90 per cent
of drinkers in the survey group who had heard of units, only 13 per cent kept a check on
the units they drank on a daily, weekly and/or other basis.115
This had not improved
noticeably since 1997: the average between 1997 and 2009 was around 13 per cent, with
women slightly more likely to keep a check than men (despite the fact that men were more
109
Ev 56, para 6.2
110
Ev 30, para 26
111
Ev w4, para 3.3
112
Q 35
113
Q 35
114
Ev 56, paras 6.1–6.2
115
Office for National Statistics, Opinions Survey report No. 42, Drinking: Adults’ behaviour and knowledge in 2009, 2010](https://image.slidesharecdn.com/guiasalcoholuk-130415104347-phpapp02/85/Guias-alcohol-uk-28-320.jpg)
![Alcohol guidelines 27
likely to drink heavily). Furthermore, women who did keep a check on units were slightly
more likely to do so on a weekly basis (6 per cent) than on the daily basis (2 per cent)
suggested by the government’s current advice on sensible drinking, but there was no
difference among men. 116
The ONS added that “it should be noted, however, that since by
no means everyone who drank each type of drink knew what a unit of that drink was, it is
likely that in some cases the check they were keeping was inaccurate”.117
46. The Institute of Alcohol Studies (IAS) stated that “there is much debate both in the UK
and internationally about the efficacy of drinking guidelines as a policy to reduce alcohol
harm”.118
The IAS considered that:
whilst guidelines have a role to play in educating the public and increasing
knowledge about the risks of alcohol, they have not been proven to be effective at
changing behaviour. The pharmacological properties of alcohol, which include loss
of inhibitions in the short term and dependence in the long term, make it impractical
to rely on a ‘nudge’ framework119
of ‘rational man making informed decisions’ about
drinking alcohol to effect behaviour change.120
Dr Marsha Morgan, IAS, stated:
The Government have an obligation to provide, on the basis of the best evidence,
information about the risks of alcohol intake so that the general public can make
informed decisions. [...] the purpose of the guidelines [...] is to inform.121
We queried whether it would be possible to conduct research that would identify whether
the guidelines had an effect on changing drinking behaviour. Dr Morgan replied:
One of the difficulties is that it would have to be a two-tiered approach. If our basic
premise is to provide guidelines in order to inform the public, we would first have to
see whether they are actually informed. In other words, you would have to look at a
scenario whereby you questioned a group of people, provided information on the
guidelines and then revisited the matter. Running in parallel, or even sequentially,
you would then look at individuals’ drinking behaviour and see whether the
acquisition of knowledge had changed it. It would be a two-step procedure; whether
it was done in parallel or sequentially would be up to the individuals designing the
studies. It could be done, but it would be a difficult piece of research.122
47. The joint written submission from the British Beer & Pub Association, The National
Association of Cider Makers, The Scotch Whisky Association and The Wine and Spirit
116
Office for National Statistics, Opinions Survey report No. 42, Drinking: Adults’ behaviour and knowledge in 2009, 2010,
p 58
117
Office for National Statistics, Opinions Survey report No. 42, Drinking: Adults’ behaviour and knowledge in 2009, 2010,
p 58
118
Ev 75, para 2
119
The nudge framework refers to the use of non-regulatory interventions that seek to influence behaviour by altering
the context or environment in which people make choices.
120
Ev 75, para 2
121
Q 2
122
Q 6](https://image.slidesharecdn.com/guiasalcoholuk-130415104347-phpapp02/85/Guias-alcohol-uk-29-320.jpg)
![28 Alcohol guidelines
Trade Association stated that “there does not appear to be a correlation between
recommended drinking guidelines and consumption patterns”.123
They stated that
“countries such as Germany and Ireland have higher overall alcohol consumption but
similar recommended daily guidelines to the UK” and Italy and Netherlands have lower
overall alcohol consumption but higher recommended guidelines”.124
48. There is little evidence that the Government’s alcohol guidelines are effective in
changing behaviour. We recognise that it would be difficult to establish whether guidelines
had had a direct effect on behaviour and also that it is a challenging area of research,
particularly given the problems caused by inaccurate reporting. Behaviour could be
changed by other interventions such as alcohol pricing and availability and it would be
difficult to disentangle the effects of these from those of the guidelines to establish a
causative effect. We are concerned that the Government views the guidelines as a tool to
influence drinking behaviour when there is very little evidence that the guidelines have
been effective at this. The Government should treat the guidelines as a source of
information for the public.
Drinking patterns
49. In paragraph 18 we noted concerns that the move from weekly to daily guidelines had
appeared to endorse daily drinking. The current guidelines advise that men and women
should “not regularly drink” more than a certain number of units a day.125
According to the
DH, “regularly” means drinking every day or most days of the week”.126
The IAS stated
that:
the recommendation that ‘regular drinking’, defined as ‘drinking every day or most
days of the week’ does not pose a significant health risk is a direct contradiction to
the evidence base on the health harms associated with alcohol. Daily and frequent
drinking is associated with a greater risk of developing dependency problems with
alcohol and alcoholic liver disease and cannot therefore be considered a ‘safe’ or ‘low
risk’ practice. Furthermore, the guideline for men to drink up to 4 alcoholic drinks
per day on a regular basis would be classified as “hazardous” drinking under the
[World Health Organisation] standards for assessing risky alcohol consumption.127
The Sensible Drinking guidelines were supplemented with advice that “after an episode of
heavy drinking, it is advisable to refrain from drinking for 48 hours to allow tissues to
recover”.128
However, the report stated that “this is a short term measure and people whose
pattern of drinking places them at significant risk should seek professional advice. Such
breaks are not required on health grounds for people drinking within the recommended
benchmarks”.129
In other words, a 48 hour break from drinking was not deemed necessary
123
Ev 44, para 27
124
Ev 44, para 27
125
Ev 27 [Department of Health] para 3
126
“Alcohol advice”, Department of Health, 22 March 2011, dh.gov.uk
127
Ev 74, para 2
128
Ev 27 [Department of Health] para 3
129
Department of Health, Sensible Drinking: Report of an inter-departmental working group, 1 December 1995](https://image.slidesharecdn.com/guiasalcoholuk-130415104347-phpapp02/85/Guias-alcohol-uk-30-320.jpg)
![Alcohol guidelines 29
for those drinking within guidelines. The DH website clarified that “‘regularly’ means
drinking every day or most days of the week”.130
We were interested in whether the DH
definition of “regular” was well communicated and understood by the public given that
“most days of the week” was not quantified. However, it appears that many people may not
be aware that advice is framed in terms of regular drinking, let alone what the definition of
“regular” is. Professor Nick Heather, Alcohol Research UK, said that: “unfortunately [...]
the word “regularly” in information given out by health authorities is sometimes dropped,
so that it appears as an absolute maximum upper limit, which it was not intended to be”.131
He explained that “it is intended as guidance on the average amount of consumption”.132
Professor Averil Mansfield, British Medical Association, told us that she would be in favour
of daily rather than weekly limits but added:
what matters most is that the message should not be that you should drink two to
three units a day. Somehow, we have to get the message over that you do not have to
drink at all, and that you certainly should not drink at all on a couple of days a week.
It almost gives the green light to go ahead and drink two, three or four units a day;
the Government guidelines seem to indicate that that is okay. We need to tone that
down so that people know it is the maximum and not something that is desirable
every day, and it will not give you added health, but if they do consume that amount
there will inevitably be a health risk.133
50. The differing risks of regular drinking and binge drinking were raised during our
inquiry. Binge drinkers were defined by 2020Health as men who drink 8 or more units in a
single session and women who drink 6 or more units in a single session.134
Grampian
Drugs and Alcohol Partnerships considered that “the implication that daily drinking is less
risky contradicts the evidence which shows that the frequency of consumption is a key risk
factor”.135
Similarly, 2020Health stated that those who drank regularly but did not binge
drink or get drunk:
may be drinking several drinks every day, and are increasing the risk of developing
long‐term health conditions. Given the time lag between alcohol consumption and
the development of conditions such as liver disease or cancer, the harm caused by
drinking is often not seen for up to 10 or 20 years.136
The Royal College of Physicians suggested that a simple remedy to the problem would be
to recommend that people should have three alcohol-free days a week to stay within safe
drinking limits.137
In Scotland, the advice is to “aim to have at least two alcohol-free days a
week”.138
130
“Alcohol advice”, Department of Health, 22 March 2011, dh.gov.uk
131
Q 16
132
Q 16
133
Q 38
134
Ev w7, para 4.6
135
Ev w32, para 3.1.2
136
Ev w7, para 4.4
137
Ev 72, para 32
138
“Keeping within the limits”, DrinkSmarter, December 2011, drinksmarter.org](https://image.slidesharecdn.com/guiasalcoholuk-130415104347-phpapp02/85/Guias-alcohol-uk-31-320.jpg)
![30 Alcohol guidelines
51. Professor Heather explained the different types of harm that could be expected from
different drinking patterns:
Long-term average drinking is related to chronic illnesses. Binge drinking [...] leads
to intoxication-related harms such as accidents and violence. [...] There are two types
of harm. In my view, therefore, there should be two types of guideline.139
[...] my advice is that the guidelines should take this form. For example, men should
not drink more than X units a week, probably 21, and never more than Y units in a
day, whatever that might be—perhaps eight units, as at present, or a bit lower.140
As
well as that, there should be at least two days’ abstinence. We should revert to the old
weekly limits of 21 and 14 for the average guideline, and have another daily limit that
should never be exceeded on any day. That would help communication.141
The Sheffield Addiction Research group and 2020Health both broadly agreed with this
suggestion.142
The International Scientific Forum on Alcohol Research and Alcohol in
Moderation drew attention to guidelines in the USA and Australia that had upper limits
for individual drinking episodes.143
The DH stated:
We are aware that some governments do offer advice on levels of consumption for
individual drinking episodes, in addition to advice for regular drinking. For example,
the 2009 Australian Government’s guidelines, do include such advice. [...] The
recommendations are based on statistical evidence of the lifetime risk of death from
injury related to individual drinking episodes. While we do see some possible value
in such a guideline, we have no plans at present to introduce this within the UK. We
believe that this would require particular consideration of its likely impact and its
real value in influencing the behaviour of individuals who currently choose to engage
in ‘binge’ drinking.144
52. It is unclear to us how the term “regular”, as applied to all adults who drink, relates
to the advice to take a 48 hour break after heavy drinking episodes. We suggest that, if
daily guidelines are retained, the Government consider simplifying the guidelines so
that, as is the case in Scotland, all individuals are advised to take at least two alcohol-
free days a week. This would enforce the message that drinking every day should be
avoided, and would helpfully quantify what “regular” drinking means to the public.
53. On balance, we consider that introducing guidance for individual drinking episodes
could be helpful to inform the public and we invite the Department of Health to
consider the suggestion as part of a review of the evidence base, taking into account
social science evidence, including evidence from other countries on the impact that
similar guidelines have had on drinking patterns. Guidance for individual drinking
139
Q 17
140
Note by witness: Within the context of the weekly limit.
141
Q 13
142
Ev w23, para 2.2.3; Ev w6-7, para 3.3
143
Ev w13, para 4.6
144
Ev 29, para 20](https://image.slidesharecdn.com/guiasalcoholuk-130415104347-phpapp02/85/Guias-alcohol-uk-32-320.jpg)
![Alcohol guidelines 31
episodes should only be introduced if guidance is provided in a weekly context again, as
having two daily drinking limits would be confusing to the public.
The role of the drinks industry
54. In March 2011, the Government published The Public Health Responsibility Deal. It
said:
Businesses have both the technical expertise to make healthier products and the
marketing expertise to influence purchasing habits. If the full strength of these skills
can be directed towards activities to encourage and enable people to make healthier
choices—as many responsible businesses do already—the benefits could be great.
The Public Health Responsibility Deal has been established to maximise these
benefits. By working in partnership, public health, commercial, and voluntary
organisations can agree practical actions to secure more progress, more quickly, with
less cost than legislation.145
The Government’s core commitment on alcohol is to “foster a culture of responsible
drinking, which will help people to drink within guidelines”.146
Specific pledges include
ensuring that over 80% of products on shelf (by December 2013) will have labels with clear
unit content, NHS guidelines and a warning about drinking when pregnant.147
55. There have been strong criticisms about the increased involvement of industry in
communicating messages about sensible drinking. For example, the Royal College of
Obstetricians and Gynaecologists (RCOG) argued “there is a conflict of interest in
engaging with business to promote products” although it acknowledged that “there are
examples of responsible drinking programmes developed by the drinks industry, such as
[Drinkaware]”.148
The British Medical Association (BMA) stated that “industry self-
regulation has at its heart a conflict of interest that does not adequately address individual
or public health”.149
Sir Ian Gilmore considered that “it is a great disappointment to me
that the present Government’s policy seems to be against funding public health
information; they are devolving it to other organisations, including those funded by the
drinks industry”.150
A 2009 report by the House of Commons Health Committee on
Alcohol stated:
It is time the Government listened more to the [Chief Medical Officer] and the
President of the [Royal College of Physicians] and less to the drinks and retail
industry. If everyone drank responsibly the alcohol industry might lose about 40% of
its sales and some estimates are higher. In formulating its alcohol strategy, the
145
Department of Health, The Public Health Responsibility Deal, 22 March 2011
146
Department of Health, The Public Health Responsibility Deal, 22 March 2011
147
Department of Health, The Public Health Responsibility Deal, 22 March 2011
148
Ev w41, para 4.4
149
Ev 80, paras 3 and 5
150
Q 13](https://image.slidesharecdn.com/guiasalcoholuk-130415104347-phpapp02/85/Guias-alcohol-uk-33-320.jpg)
![32 Alcohol guidelines
Government must be more sceptical about the industry's claims that it is in favour of
responsible drinking.151
56. When we put these concerns to Jeremy Beadles, Chief Executive of the Wine and Spirit
Trades Association and co-chair of the Alcohol Responsibility Deal, he replied:
[The Public Health Responsibility Deal] is not about setting or dictating Government
policy; it is about the alcohol industry and other organisations finding ways of
delivering things that the Government wish to have delivered, such as unit labelling
and point of sale information. To be frank, it would be extremely time-consuming
and costly putting it through Europe and getting the legislation out on the other side,
and frankly impossible in terms of providing unit information in a pub environment.
The evidence base would be extremely difficult to put together, and the cost of
administering a scheme of that nature would be disproportionate. If the industry is
prepared, willing and happy to do this stuff and can roll it out through its
mechanisms, I am not sure that I see a problem. [...] the Responsibility Deal now has
more than 220 businesses signed up to it. It is one of the largest voluntary
agreements ever put together.152
The Minister acknowledged the importance of being aware that all interest groups had
their own agenda and added “we have to judge it on the results that we see. In 2013 [...] we
will be having an independent analysis as to how much progress has been made”.153
She
stated:
the drinks industry are interested in their brands, so, if a brand is associated with
crime, anti-social behaviour and people being paralytically drunk, it is not necessarily
a positive brand. However, they are there to sell alcohol. We have to work in those
areas that we can, make sure it is properly scrutinised and analysed so that we have
confidence, and be aware of the fact that there are legislative and regulatory tools
which we can take into account.154
Drinks labelling
57. The labelling of alcoholic beverages with guideline advice is an important way of
communicating alcohol content and guidelines, and was a key focus of our inquiry. Figure
2 shows what information will be included on labels under the alcohol pledge.
151
Health Committee, First Report of Session 2009-10, Alcohol, HC 151-I
152
Q 43
153
Q 81
154
Q 81](https://image.slidesharecdn.com/guiasalcoholuk-130415104347-phpapp02/85/Guias-alcohol-uk-34-320.jpg)
![Alcohol guidelines 33
Figure 2: Format of alcoholic beverage label155
58. The pledge to have over 80 per cent of products on the shelf with “labels with clear unit
content, NHS guidelines and a warning about drinking when pregnant” by 2013 is
voluntary, although some, such as the BMA, considered that mandation was necessary.156
59. We asked the Minister how close the Government was to achieving the 80 per cent
target. She responded that the process had just started recently, noting “how difficult it is
for the industry to get it in place” and that there had been a lot of concerns about the Public
Health Responsibility Deal.157
We were also informed that around 100 companies covered
approximately 80 per cent of the industry and that most of them were signing up to the
pledge.158
Mr Heffer, Deputy Director, Alcohol and Drugs, DH, added that:
the advantage to them is that they are doing this voluntarily—some of their brands
do not have to comply. If you are bringing in a special product from America for the
whole of Europe, they can exclude that brand while offering a choice of products to
consumers across the rest of Europe. A mandatory approach would mean that that
brand was probably not stocked. Most of the brands have signed up for most of their
products. That should add up to 80 per cent. There will be an independent verifier by
December 2013.159
155
Ev 46 [The British Beer & Pub Association, The National Association of Cider Makers, The Scotch Whisky Association
and The Wine and Spirit Trade Association]
156
Ev 80, paras 3 and 5
157
Q 86
158
Q 85
159
Q 85
recommend adults do not regularly
exceed
Men 3-4 units a day
Women 2-3 units a day
(x)
UK
Units
www.drinkaware.co.uk
Drink Responsibly
Number of UK units in
the container
( x - insert the correct number
of units for your drink)
Drinkaware
logo or website
(optional)
Pregnancy logo or
wording (‘Avoid alcohol
if pregnant or trying to
conceive’)
Responsibility
message
(optional)
Government safe
drinking guidelines
Information in a
boxed format](https://image.slidesharecdn.com/guiasalcoholuk-130415104347-phpapp02/85/Guias-alcohol-uk-35-320.jpg)
![34 Alcohol guidelines
60. In addition to labelling of alcoholic drinks, the drinks industry is involved with
campaigns to increase consumer awareness of units in “the on and off trades”, working
with Drinkaware.160
61. We are mindful of the concerns expressed by medical experts and relevant
organisations about the involvement of the drinks industry in communicating public
health messages concerning alcohol. There is clearly a risk that drinks companies could
face a conflict of interest as promoting a sensible drinking message could affect profits.
However we have heard no evidence to suggest that the alcohol labelling pledges within
the Public Health Responsibility Deal could be achieved without the cooperation of
drinks companies. Nor have we heard sufficient evidence to suggest that, given the
Government exercises proper scrutiny and oversight, a conflict of interest would
jeopardise the progress of the alcohol pledges.
62. We are concerned that there will not be an independent assessment of the
programme until the target date of December 2013. We recommend that the
Government immediately set an interim labelling target for December 2012. It should
then conduct a preliminary assessment of the progress of the alcohol pledges in the
Public Health Responsibility Deal in December 2012. If through the voluntary
involvement of the drinks industry, the intermediate target has not been met by
December 2012, the Government should review the initiative, including the possible
need to mandate compliance with labelling requirements.
160
Ev 44 [The British Beer & Pub Association, The National Association of Cider Makers, The Scotch Whisky Association
and The Wine and Spirit Trade Association] paras 23-24](https://image.slidesharecdn.com/guiasalcoholuk-130415104347-phpapp02/85/Guias-alcohol-uk-36-320.jpg)
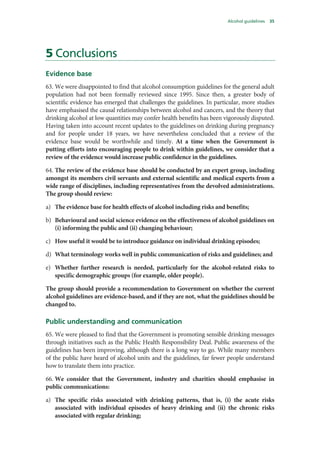
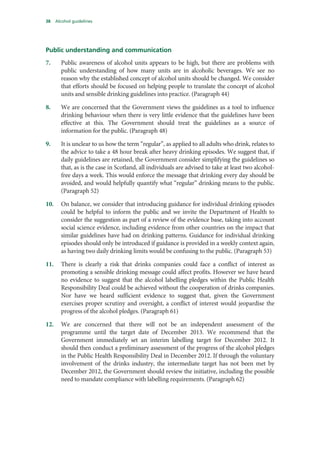
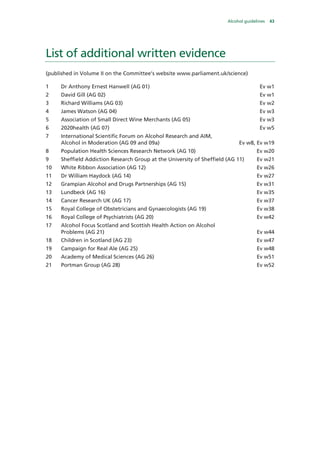


![cobber Pack: U PL: COE1 [SO] Processed: [03-01-2012 16:30] Job: 015231 Unit: PG01
Source: /MILES/PKU/INPUT/015231/015231_o001_th_S&T 111012 Alcohol Guidelines HC 1536-i FINAL.xml
Science and Technology Committee: Evidence Ev 1
Oral evidence
Taken before the Science and Technology Committee
on Wednesday 12 October 2011
Members present:
Andrew Miller (Chair)
Gavin Barwell
Stephen McPartland
Stephen Metcalfe
Stephen Mosley
________________
Examination of Witnesses
Witnesses: Sir Ian Gilmore, Royal College of Physicians (by video-link), Dr Richard Harding, Member of
the 1995 Interdepartmental Working Group on Sensible Drinking, Professor Nick Heather, Alcohol Research
UK, and Dr Marsha Morgan Institute of Alcohol Studies, gave evidence.
Q1 Chair: Good morning, everyone—particularly to
Sir Ian, who I hope can hear us in Australia.
Sir Ian Gilmore: Yes, Chairman, very clearly thank
you.
Q2 Chair: We want to probe some issues around the
current alcohol guidelines. First, what is their
purpose? What do the Government seek to achieve?
Who wants to start?
Dr Harding: It seems to me that the purpose of the
alcohol guidelines is to give general advice to adults
on the level of drinking at which no significant harm
accrues, or the level at which there is likely benefit,
based on an analysis of the most recent scientific
evidence, in such a way that it is meaningful to them
as individuals.
Professor Heather: First, the public have a right to
information about what level of drinking increases the
risk of harm. Of course they have a right to ignore
that advice, but they certainly have a right to know
what those levels are.
Drinking guidelines are also essential for a concept of
something called hazardous drinking, which forms the
basis of screening and brief interventions, a way of
helping people who are drinking excessively to cut
down; it is carried out by general practitioners and
other generalists. The point is that, without what I
might call official drinking guidelines, there would be
no way of describing the concept of risky or
hazardous drinking. They are essential for that
purpose.
Finally, there is no research on whether drinking
guidelines will lead directly to people cutting down
on their drinking. There is no answer one way or the
other on that, but that is not the point. Even if they
did not directly lead to people reducing their
consumption—I would be surprised if it did not—
there would still be a role for drinking guidelines in
reducing alcohol- related harm.
Chair: We can come back to that point in a moment.
Dr Morgan: I echo what my two colleagues have
said. The Government have an obligation to provide,
on the basis of the best evidence, information about
the risks of alcohol intake so that the general public
can make informed decisions. If we were working in a
Pamela Nash
Graham Stringer
Roger Williams
nudge framework, we would assume that given decent
information, a reasonable man drinking outside those
guidelines would moderate them, but that is not
necessarily the purpose of the guidelines. Their
purpose is to inform.
Picking up on Nick’s point, when you have identified
low risk levels of consumption, then health care
workers can use levels of consumption above that to
classify drinking behaviour into hazardous and
harmful. However, that is a different process. That is
not a guideline; it is using it to determine classification
of drinking behaviour that is above the
recommended levels.
Q3 Chair: Do you wish to add anything, Sir Ian?
Sir Ian Gilmore: Just this: as well as using the best
evidence available, the guidelines have to be
understandable. They have to be a tool that is useful
to health professionals in conveying the information,
but the information must be presented in such a way
that the general public have a reasonable chance of
understanding it. It is up to individuals whether they
act on it, but the guidelines must be in a form that
allows a reasonable prospect of people engaging
with them.
Q4 Chair: Are the guidelines set because of the need
to improve the general health of the population, giving
people advice about looking after their own health, or
are they influenced by the social behaviour of people
who drink excessively?
Sir Ian Gilmore: The aim of the guidelines must be
to improve health, and that includes the health of the
population as well as of individuals. Yes, I would
agree with your summary.
Q5 Chair: Professor Heather, you said that there is
no specific research about whether the guidelines
influence behaviour, but you assume that they do.
Would it be a valuable piece of research to see
whether there is a cause and effect?
Professor Heather: It would be valuable but difficult.
It would be hard to prove that there was a direct effect,
but you could start by simply asking people whether](https://image.slidesharecdn.com/guiasalcoholuk-130415104347-phpapp02/85/Guias-alcohol-uk-49-320.jpg)
![cobber Pack: U PL: COE1 [E] Processed: [03-01-2012 16:30] Job: 015231 Unit: PG01
Source: /MILES/PKU/INPUT/015231/015231_o001_th_S&T 111012 Alcohol Guidelines HC 1536-i FINAL.xml
Ev 2 Science and Technology Committee: Evidence
12 October 2011 Sir Ian Gilmore, Dr Richard Harding, Professor Nick Heather and Dr Marsha Morgan
they think that their drinking has been influenced. You
could start from there and then find other ways.
Q6 Chair: Over the years, the various medicals that
I have undertaken have included questions about
alcohol, but there is a varied way in which doctors
collect that information. Is there some merit in finding
a consistent way of posing the questions and seeing
whether there could be some interpretation of that
information?
Professor Heather: There is a strong impetus to
standardise that form of questioning, using particular
screening instruments and particular forms of
questioning. That is already under way. It would also
be advantageous if people answered questions in the
same way.
Dr Morgan: One of the difficulties is that it would
have to be a two-tiered approach. If our basic premise
is to provide guidelines in order to inform the public,
we would first have to see whether they are actually
informed. In other words, you would have to look at
a scenario whereby you questioned a group of people,
provided information on the guidelines and then
revisited the matter. Running in parallel, or even
sequentially, you would then look at individuals’
drinking behaviour and see whether the acquisition of
knowledge had changed it. It would be a two-step
procedure; whether it was done in parallel or
sequentially would be up to the individuals designing
the studies. It could be done, but it would be a difficult
piece of research.
Q7 Stephen Mosley: Different countries take
different approaches to this. For instance, Canada
takes a zero net risk approach but Australia uses
absolute risk. In the UK, we use the J-shaped curve to
assess risk. Is there a best approach?
Professor Heather: The Canadian approach uses the
J-shaped curve as well. Its zero net risk is assessed
relative to abstainers, whereas the 1995 committee
that Dr Harding was on—he will confirm this—took
advice from Sir Richard Doll that the reference point
should be the lowest point on the J-shaped curve. That
is a technical difference. The Australian and Canadian
exercises have their merits, and both are impressive
pieces of work, but there is no need to go into an
analysis of the underlying research again, because it
has been done for us. How to interpret it would be
different, but the analysis has been done both in
Australia and Canada. I much prefer the Canadian
approach, and my advice to the Committee is that the
Canadian approach is the better way to go. I could tell
you why if you want.
Stephen Mosley: Yes please; it would be useful.
Professor Heather: The Australian absolute risk
approach, although it was very logical and although
its time may come, has resulted in advice to the public
that I think the public are not ready to accept. What it
amounts to is that the guidelines come down to
advising that people, both men and women, should
never exceed 1 pint of normal strength beer or the
equivalent a day. My view, and I hope yours too, is
that the British public would find that incredible and
derisory, however impeccable the logic.
The Canadian guidelines come up with much more
credible advice. That takes us back to what Sir Ian
said at the beginning—that the credibility of
guidelines is most important. By the way, they are not
so different from the guidelines that we have had since
1987, with the Royal College of Physicians report of
21, 14 and so on. Rather than them being plucked out
of the air, those guidelines have stood the test of time.
After the huge amount of research that has been done
since, we have arrived at guidelines that are roughly
similar to those of 1987—the Canadian ones.
Dr Morgan: There is a discrepancy between what the
public want and what policy setters want. If you speak
to epidemiologists—I am certain that you will in your
further ferreting for information—you may hear that
the advantage of absolute risk is that it is a cleaner
piece of evidence on which policy makers can set
policy, as opposed to the ease with which the
population can be given sensible advice. Without
going into the nuances, as Nick said, there is merit in
both approaches. One approach may suit one group
more readily than it suits another. There is merit in
both, and running in parallel would probably not be a
bad idea.1
Dr Harding: As you have seen from my submission,
I am rather sceptical about the extent to which work
in other countries is relevant to problems here. The
reasons are that the problem that they are trying to
solve might be different; they may be entirely focused
on the reduction of misuse rather than general advice
to the population; the target population might be
different; you do not know what evidence they are
taking into account and you might know the rationale
of their analysis; and sometimes political judgment is
involved, which introduces other factors. My view is
that plenty of competent people in Britain do a very
competent job.
Professor Heather: We obviously have competent
people in Britain, but the evidence base is the same.
Sir Ian Gilmore: I am in Australia, and therefore feel
duty-bound to comment that, as Marsha Morgan said,
the absolute risk is the cleanest one. In many other
areas of life, people accept that a risk of less than one
in 100 of dying from something such as an
environmental factor is reasonable.
The Australians have been careful not to say that it is
an upper limit. They have said, “You should be aware
that, if you drink more than two standard units a day,
your risk of dying from an alcohol-related cause will
rise.” The risk can rise quite sharply above that level.
They are not saying that you should never do it, but
there is a good evidence base that people know that
they are taking greater risks—and risks greater than
they would accept in other walks of life—if they go
above that level. We should not overplay the
difference between the Canadian and Australian
approach. The matter will be discussed in a
forthcoming edition of Drug and Alcohol Review, and
I believe that there will be a reasonable consensus.
1
Note by witness: See Attachment 1 [Ev 78] for analysis of
the approaches used to derive the drinking guidelines in
Canada and Australia; important clarification of the approach
used by the Canadian workers which is said to be based on
relative risk but does take baseline risk into account; both
methods produce roughly the same end point](https://image.slidesharecdn.com/guiasalcoholuk-130415104347-phpapp02/85/Guias-alcohol-uk-50-320.jpg)
![cobber Pack: U PL: COE1 [O] Processed: [03-01-2012 16:30] Job: 015231 Unit: PG01
Source: /MILES/PKU/INPUT/015231/015231_o001_th_S&T 111012 Alcohol Guidelines HC 1536-i FINAL.xml
Science and Technology Committee: Evidence Ev 3
12 October 2011 Sir Ian Gilmore, Dr Richard Harding, Professor Nick Heather and Dr Marsha Morgan
Professor Heather: The evidence base was the same;
if we had our own exercise in this country we would
be looking at the same papers and the same meta-
analyses. They are mostly from English-speaking
Anglo-Saxon cultures around the world. That is where
most of the research comes from, so it is biased to
that extent, but it is not a different evidence base. We
have experts in this country, but they would be
looking at the same stuff.
The other point is that, if one decided on a relative
risk approach for deciding guidelines for the general
public, one could at the same time have a website
where interested people could examine the absolute
risk, based on gender, age and other characteristics,
which would contain more detailed information. But
for simplicity and credibility, in my opinion the
relative risk approach is far better.
Q8 Graham Stringer: What are the key difficulties
in assessing the risks of alcohol consumption? A GP
who was an MP until the last election said that, when
people came to his surgery who told him that they
drank 10 pints a week, he wrote down 20. What are
the difficulties in sussing the risk, given that aspect?
Dr Morgan: There are intrinsic difficulties in
collecting data. In particular, you have highlighted the
possibility of people under-reporting. That will always
be a problem. However, the odd individual will over-
report, usually young men.
There are also difficulties in the fact that you are
collecting data over a relative period. A lot of the
questioning is normally about what you are drinking
now and takes no account of what you may have
drunk in the past and therefore what burden of illness
you may already be carrying. There are intrinsic
difficulties not only in under-reporting but in the way
in which the data are collected. As our Chairman
mentioned earlier, there is the way in which you are
questioned and the way in which the information is
put down—for instance, whether it is frequency or
amount. There are intrinsic difficulties in collecting
the data and being sure of the data that you have
collected.
Equally, there are difficulties in collecting information
on the alleged harms. Unless someone has florid
evidence of liver disease or pancreatic disease, you
may not know that they are already damaged in that
respect. I have spoken of the intrinsic overall
difficulties of the collection of the data, but then we
come to the interpretation of the data—the way in
which the studies are done, whether they are case-
controlled studies or cohort studies. Those are fairly
well entrenched and well respected, in terms of the
large epidemiological studies that have been done.
The actual statistical analysis of the data, once
collected, is fairly robust, but there are difficulties
with its collection.
Dr Harding: There are hundreds of studies that show
a correlation between alcohol consumption by
individuals and chronic disease outcomes. Some of
those diseases are underpinned by observations of
changing biological markers as well, so there is a
credible hypothesis as to why those effects actually
happen. With the relationship between alcohol
consumption and coronary heart disease there is, as
you know, a decrease in risk, but it eventually goes
up with consumption. When I was on the 1995
committee, there seemed to be two ways in which
alcohol might do that. One was an increase in HDL
cholesterol, and the other was the anti-clotting factor
effect that alcohol has. There are now many ways in
which researchers see that moderate consumption
could have a beneficial effect, which is then seen in
population studies. With other diseases, you see the
relationship between consumption and disease
outcome, but there is not yet the underpinning
biological hypothesis to support it.
Sir Ian Gilmore: Some of us are less taken with that
link, with the protection from cardio-vascular disease
given by alcohol. There probably is an effect, but it
does not affect the main age group that is damaged by
alcohol. The peak deaths from alcohol are among 45
to 65-year-olds, who are in the most productive phase
of their lives. Certainly young people damaged by
alcohol get no cardio-vascular benefit whatsoever.
There are serious scientists who still believe that the
apparent cardio-vascular benefits are spurious. I am
not going down that line, but I believe it is overplayed
as a benefit.
Professor Heather: To answer your question, the
main difficulty for the researcher is what are known
technically as confounds—that is unknown factors
that might influence the relationship between drinking
and morality, heart disease and so on.
In relation to the cardio-protective effect, when the
“Sensible Drinking” report was written in 1995, which
was the last time that the Government addressed this
problem, there was much more confidence in the
cardio-protective effect, which is reflected in the
report by the committee of which Dr Harding was a
member, and also in the report of the three royal
colleges that came out at roughly the same time. That
consensus has now largely disappeared, which is the
result of more careful research. For example, it shows
that people who were classified as lifetime abstainers
were not really lifetime abstainers. It is known as the
“sick quitter” hypothesis; in other words, the objection
is that people saying that they are abstainers may be
abstaining because they have an alcohol problem or
are unwell. The other kind of possible confound,
which is now quite easy to understand, is that the
moderate drinkers at the bottom of the J-shaped curve
are in fact healthy, well-living people, and that low
alcohol consumption is not so much a cause of
longevity as a marker of a health lifestyle.
Q9 Graham Stringer: Is it a correlation rather than
a causality?
Professor Heather: It is a confounder to the
relationship. It is a difficult area of research, but it is
clear now—I agree with Sir Ian on this—that there is
far less confidence in the cardio-protective effect than
there was a few years ago.
Dr Harding: I would not agree with that. It seems to
me that the evidence has got stronger over the years.
The “sick quitter” hypothesis is that the abstainers are
unwell and therefore have a higher rate of disease.
However, some studies have been large enough to take
them out, yet when you omit the sick quitters and](https://image.slidesharecdn.com/guiasalcoholuk-130415104347-phpapp02/85/Guias-alcohol-uk-51-320.jpg)
![cobber Pack: U PL: COE1 [E] Processed: [03-01-2012 16:30] Job: 015231 Unit: PG01
Source: /MILES/PKU/INPUT/015231/015231_o001_th_S&T 111012 Alcohol Guidelines HC 1536-i FINAL.xml
Ev 4 Science and Technology Committee: Evidence
12 October 2011 Sir Ian Gilmore, Dr Richard Harding, Professor Nick Heather and Dr Marsha Morgan
lifetime abstainers you still see the effect. In many
studies, the confounding factor has been taken care of.
Chair: Shall we rest there, as there is clearly a
difference of opinion? Any supportive evidence you
have to support your views would be welcomed in
further submissions.
Q10 Pamela Nash: The British public over the past
few years have been bombarded with various news
reports on the benefits and risks of alcohol
consumption. What credible evidence has appeared
since 1995 on the risks and benefits? As a result of
any such evidence, should the guidelines be changed?
Dr Morgan: I do not want to revisit the cardio-
vascular risk again, but may I explain that the biggest
body of evidence on the potential beneficial effects of
alcohol relates to the cardio-protective effect.
However, as you can see, there is enormous
contention among the team here and in general.
Again, I emphasise that, if there were to be a cardio-
protective effect, it would selectively be found in
middle-aged men and post-menopausal women, and
you do not gain that protective effect in middle life
by drinking at a younger age. You cannot justify
someone in that age group who does not drink starting
to drink for the cardio-protective effect. After all, it is
still within guidelines at between one and two units.
The two other areas where there have been alleged
protective effects are in the development of diabetes
and possibly, from the recent Million Women Study,
on the development of cancers. However, the evidence
is very thin. There is no body of evidence like that
for the cardio-protective effect. Much more important,
since the guidelines were last considered in 1995, is
that the major body of evidence has been on the
detrimental effect of alcohol and the cancer risk,
particularly for breast cancer in women, and that the
risk levels are not far off the top end of the current
guidelines. Although there have been some reports in
the press for a protective effect about diabetes and
some types of cancer, there is not a strong evidence
base.
Equally, there is much more important evidence that
we did not have in 1995 which suggests a quite
significant risk of cancer of the oropharynx, larynx
and oesophagus and cancers among people who
already have liver damage, and there is evidence on
breast cancer and to a degree some early evidence on
bowel cancer. As far as I am concerned, those
detrimental effects overwhelm any potential benefit
that there might be on diabetes.
Dr Harding: In my submission, I list a number of
categories of evidence that have emerged since 1995.
I shall go through them briefly.
The first was the finding that frequency of drinking
is as important as the amount consumed, within the
moderate consumption band. It is clear that drinkers
get more benefit from not bingeing in any way, and
from keeping consumption small and moderate. A
nice study came out a couple of years ago comparing
drinking levels in Northern Ireland and France. I
believe that in France it was an average of 30 grams
a day, and in Belfast it was 20 grams a day. However,
because the pattern of drinking was less frequent in
Belfast, the overall health outcome was worse there
than it was in France, where they had a healthier
pattern of drinking. The second was the evidence of
the cardio-protective effect, which has already been
mentioned.
Type 2 diabetes has been mentioned; the evidence was
pretty clear in 1995, but it has been reinforced by
further studies. There seems to be less osteoporosis in
older people for moderate drinkers compared to
abstainers, leading to an increase in bone mineral
density and fewer fractures—an improvement of
about 20%. Among older consumers there seems to
be a reduced risk of dementia. A lot of work has been
done on the effect of alcohol on cognitive function;
again, there is about a 20% reduction for moderate
drinkers over abstainers.
My colleague is correct that quite a lot of work has
been done on cancer. The working party referred the
whole question of cancer to the Committee on
Carcinogenicity, mentioning that there seemed to be
some evidence of an increased risk of breast cancer
and that it should be kept under review. There has
been quite a lot more work since. The Million Women
Study that my colleague referred to showed an
increased risk of breast cancer, and cancers of the oral
cavity, the oesophagus and the larynx, which was
expected, but a decreased risk of non-Hodgkin’s
lymphoma, thyroid and renal carcinoma. The overall
risk of cancer to women in that group was lower in
moderate consumers than in abstainers. When it got
to between seven and 14 drinks a week, however, it
was about the same.
I urge the Committee to keep a sense of perspective.
With breast cancer there seems to be an increasing
risk of about 5% to 10% per drink per day. If a woman
aged 20 has a lifetime risk, let us say, of 20%—I do
not know the exact figure—of getting breast cancer
before the age of 75, a drink per day would increase
that risk to 21% or 22%. Up to the menopause, the
risk is much lower—say 5% or 10%. If it was 5%,
the increased risk would be 5.5%. If it was 10%, the
increased risk would be 11%. After the menopause,
women are exposed to the risk of cardio-vascular
diseases; before that they are protected by their
hormones. The benefit that they gain from moderate
consumption after the menopause would outweigh any
increased risk of cancer. They may not get cancer after
the menopause even though there is more cancer then.
It is not risk-free. There is a risk, but on balance the
data show that if they wish to consume alcohol for
health reasons the net effect is beneficial.
Q11 Pamela Nash: Would you advocate the
guidelines being reinforced by the evidence base?
Dr Harding: I would not change them.
Professor Heather: In answer to your question, and
as a remark to the Chairman, may I say that I know
this is a question and answer session but I was hoping
to make a number of points during the sitting? One of
them is a direct answer to your question.
My advice is that under no circumstances should the
Committee recommend that the guidelines are
increased. That would be inimical to the health of the
nation and wrong on the basis of scientific evidence.
There is no case for increasing them. I mention this
because, as you probably know, there was a press](https://image.slidesharecdn.com/guiasalcoholuk-130415104347-phpapp02/85/Guias-alcohol-uk-52-320.jpg)
![cobber Pack: U PL: COE1 [O] Processed: [03-01-2012 16:30] Job: 015231 Unit: PG01
Source: /MILES/PKU/INPUT/015231/015231_o001_th_S&T 111012 Alcohol Guidelines HC 1536-i FINAL.xml
Science and Technology Committee: Evidence Ev 5
12 October 2011 Sir Ian Gilmore, Dr Richard Harding, Professor Nick Heather and Dr Marsha Morgan
report saying that that would be the likely outcome of
the Committee’s deliberations. I do not know where it
came from, and I am not interested, but it was most
unhelpful and wrong.
Chair: We, too, were fascinated, as nobody had
bothered to ask us—and we have not yet heard the
evidence.
Dr Morgan: I would be happy to submit a report from
the International Agency for Research on Cancer. It
was produced by 30 scientists from 10 countries
meeting to consider the risk of alcohol consumption.
It includes extensive evidence and the statement that
there is clear evidence of about a 10% increase in the
risk of cancer for every 10 grams drunk per day. I
shall be very happy to submit that report.2
Q12 Pamela Nash: That would be very much
appreciated. Sir Ian, do you have anything to add?
Sir Ian Gilmore: No, except that you are getting two
different perspectives. I am one of the three
independent public health and clinical opinions here.
As someone who looks after patients with liver
disease who sees hospital admissions rising year on
year and now topping 1 million—that is not just
presentations to A and E but over the whole
hospital—I would very much echo Professor
Heather’s comments that a recommendation to
increase the limits would be swimming against the
tide of harm that we see in our hospitals every day.
Q13 Pamela Nash: Thank you for that answer, Sir
Ian. Do you have an opinion on how to improve the
way that we communicate with the public about the
various health benefits and risks if we advocate
keeping the guidelines as they are? We cannot deny
that confusing messages are being put out there. What
would you suggest to improve that?
Sir Ian Gilmore: Although there is no strong sign or
evidence that education and information have
improved the situation with regard to alcohol, there
are many areas where they have changed behaviour.
Indeed, the drinks industry would not be spending all
the money that it does on advertising if it did not
work. The problem with alcohol is often that we have
not gone about things the right way or with sufficient
funding. It is a great disappointment to me that the
present Government’s policy seems to be against
funding public health information; they are devolving
it to other organisations, including those funded by the
drinks industry. We should not give up on education
and information. It needs to be much better resourced,
as we need a better evidence base on what works. We
know that sending men in grey suits into schools does
not work, but we must remember that peer pressure
and peer influence does work. We should invest a lot
more in independent advice and information to the
public.
Professor Heather: Could I come back once more? I
agree that the limits should stay roughly as they are,
but only roughly. In other words, the way in which
the limits are expressed could be improved. They say
that men should not regularly exceed three or four
daily and women two or three daily. I do not know
2
Note by witness: See Attachment 2 [Ev 79] for a summary
only as the full report is awaiting publication.
whether this is an appropriate time to say so, but I
shall quickly tell the Committee what I believe should
be the case. There should be two kinds of limits. That
is reflected in the Canadian guidelines. One is what
people should usually drink on average, and that is
relevant to chronic illnesses and is based on a
particular set of evidence; there is another set of
evidence that is relevant to harm from injury—
Chair: We will deal with binge drinking in detail in
a moment.
Professor Heather: This will be relevant to that
aspect, as it is related to intoxication. The limit should
stipulate an amount that should never be exceeded3
.
To cut a long story short, my advice is that the
guidelines should take this form. For example, men
should not drink more than X units a week, probably
21, and never more than Y units in a day, whatever
that might be—perhaps eight units, as at present, or a
bit lower4
. As well as that, there should be at least
two days’ abstinence. We should revert to the old
weekly limits of 21 and 14 for the average guideline,
and have another daily limit that should never be
exceeded on any day. That would help
communication.
Dr Morgan: One of the other problems is that we
are focusing—rightly, because it is the most important
message—on the weekly or daily limit, whichever you
want to take. However, the Canadian guideline model
does not start with the amount that you should or
should not drink. It starts by saying that there are
circumstances when you should not drink—when
using machinery or driving, if you are physically or
mentally unwell, or if you have important decisions to
make. It gives other guidance also to put into context
the levels being suggested for weekly and daily
consumption, for example that women should not
drink if they are pregnant and that young people
should limit their intake. One of the problems with
the current UK guideline is that they just stipulate an
amount that you may or may not be able to drink with
low risk. There need to be more caveats, taking the
Canadian as a model. That would serve people better
as it will cover bases that are not covered by simply
giving an amount.
Q14 Pamela Nash: I appreciate that, but do you
think that it would be possible to do it without making
things even more confusing?
Dr Morgan: There are always difficulties in messages
that are longer. If you want to get one message over—
Sir Ian has touched on this—correct labelling on
bottles and information at places where alcohol is
bought would be one good thing for pushing the
message home. An informed public are possibly better
able to understand what is going on.
Chair: Going a bit further into this aspect, I call
Stephen.
Q15 Stephen Metcalfe: You have raised some
interesting points. Do you not think that the public
know full well what the safe limits are and that they
choose not to abide by them because they do not like
them? Most people have heard about 14 and 21, and
3
Note by witness: On any one occasion or day.
4
Note by witness: Within the context of the weekly limit.](https://image.slidesharecdn.com/guiasalcoholuk-130415104347-phpapp02/85/Guias-alcohol-uk-53-320.jpg)
![cobber Pack: U PL: COE1 [E] Processed: [03-01-2012 16:30] Job: 015231 Unit: PG01
Source: /MILES/PKU/INPUT/015231/015231_o001_th_S&T 111012 Alcohol Guidelines HC 1536-i FINAL.xml
Ev 6 Science and Technology Committee: Evidence
12 October 2011 Sir Ian Gilmore, Dr Richard Harding, Professor Nick Heather and Dr Marsha Morgan
about two or three units a day, but decide that it is not
for them. My concern is that there is no connect
between the public’s understanding of the risk and the
message being communicated.
Professor Heather: I am sure that you are right that
people know them but choose to ignore them. They
have a perfect right to do so, of course, in a free
society as long as they do not harm others.
Stephen Metcalfe: Yes.
Professor Heather: There might also be some
confusion, for example, about the three and four units.
A recent article in a British medical journal suggested
that elements of the alcohol industry had put over the
three and four units as being what the Government
recommended people to drink. That, of course, is
iniquitous. There is room for confusion.
Q16 Stephen Metcalfe: We have moved towards
expressing the amount of alcohol in a daily way. Is
that the right way to proceed? You suggested that it
should be daily, I think, but there is still some debate
on that.
Professor Heather: I am for a weekly average figure.
At the moment, the guideline says that men, for
example, should not regularly exceed three or four
drinks. Unfortunately, as I wrote a couple of years
ago, the word “regularly” in information given out by
health authorities is sometimes dropped, so that it
appears as an absolute maximum upper limit, which
it was not intended to be. As I keep saying, it is
intended as guidance on the average amount of
consumption. For example, if your daughter was
getting married you might want to exceed four units
on that particular day—and on other fairly infrequent
occasions. Why not? There is nothing wrong with it.
The evidence suggests that the sky would not fall in
if you did, and there must be some way of reflecting
that. The weekly limit is a much more convenient way
of doing that.
Dr Morgan: You asked whether the public were
aware. In fact, a survey was carried out by the ONS
in 2009, and the results were quite interesting.
Basically, it showed that about 90% of the public have
heard of the guidelines; that compares with about 79%
in 1995. However, there was an enormous range
between social demographic groups and age groups.
In fact, the most poorly informed were those in the
older age groups, but the managerial and professional
classes obviously knew more. People have an
awareness that there are limits out there; whether it
goes beyond that to what the limits are and what they
actually mean was not picked up in the survey, but
there was 90% awareness in 2009 among the general
public that there are limits for drinking.
Dr Harding: The 1995 report had a strong anti-
intoxication theme. The guidance says don’t get
drunk, don’t drink and drive, don’t drink and do sport,
and don’t drink and operate machinery or whatever.
That is one reason why it moved from a weekly
advisory level to a daily one; under the weekly level,
it was theoretically possible to put away a lot of
alcohol in a couple of days and still be within the
limit. That is clearly undesirable. Evidence that has
come out since on the importance of frequency rather
than amount also supports the concept of a daily
advisory level. The committee did not like the idea of
a limit because the evidence cannot support a limit,
so it gave people a range. Also, a weekly limit is
difficult to follow, because you have to remember
what you drank last Thursday or whenever. There are
lots of advantages for having an advisory daily level.
Dr Morgan: I was saying that you do not preclude it;
you could do both.
Sir Ian Gilmore: I would go with Professor Heather
and the weekly level if you had to go for one or the
other, but the most important thing is that we should
have a single, consistent message not only for the
general public but for the health professionals, so that
they know what message they should be conveying
when they see their patients.
The pertinent point was made that most people think
that these recommendations are for other people rather
than for themselves. It is about getting clear guidelines
but also backing them not only with public
information and education but with GPs and other
health care workers every time they come into contact
with patients, taking a recent alcohol history and
pointing out that it is possible to steer people back
from drinking at hazardous levels by simple
procedures such as brief interventions. Then there are
the wider Government responsibilities over the most
important drivers such as price, availability and
marketing. It has to be taken in the wider context, and
the most important thing is the clear, concise message
that health professionals can share with the general
public. The detail over weekly versus daily is less
important. However, considering the burden of harm,
it is clearly vital that the levels are not increased at
this point.
Dr Harding: I make a general point here. It is
important—it is the very first question that was
posed—to decide the purpose of the drinking
message. Is it there to help reduce alcohol-induced
harm? The 1995 committee decided that measures
should be put in place to help people drinking an
excess to reduce it. That aside, what is the sensible
level of drinking for the general population? Measures
to reduce harm are one thing, but the basis of the
recommendations is what is sensible to consume for
the general population.
Q17 Stephen Metcalfe: I take that on board; you
have made that fairly clear.
Professor Heather, everyone would agree, from what
you have said, that it is less worse to partake regularly
in a relatively small amount of alcohol than to binge
drink, which is why Dr Harding is arguing for daily
guidance. Would you confirm which is worse for your
health, or which presents more risk—long-term
drinking, your total consumption, or the pattern in
which you drink?
Professor Heather: Both; they are different types of
harm. Long-term average drinking is related to
chronic illnesses. Binge drinking, if you want to use
that term—I do not—leads to intoxication-related
harms such as accidents and violence. There is also
recent evidence that it contributes to hypertension, but
that is a complication. What I said is roughly true.
There are two types of harm. In my view, therefore,
there should be two types of guideline.](https://image.slidesharecdn.com/guiasalcoholuk-130415104347-phpapp02/85/Guias-alcohol-uk-54-320.jpg)
![cobber Pack: U PL: COE1 [O] Processed: [03-01-2012 16:30] Job: 015231 Unit: PG01
Source: /MILES/PKU/INPUT/015231/015231_o001_th_S&T 111012 Alcohol Guidelines HC 1536-i FINAL.xml
Science and Technology Committee: Evidence Ev 7
12 October 2011 Sir Ian Gilmore, Dr Richard Harding, Professor Nick Heather and Dr Marsha Morgan
Q18 Stephen Metcalfe: We touched upon this
earlier, so we have already covered much of what I
wanted to ask about the way in which the guidance
was communicated in the past for those who have
taken it on board. Is there any evidence that it has
changed drinking patterns? Is there any authoritative
evidence that it has changed the way in which people
view alcohol and the way that they use it?
Professor Heather: Not directly, no. I said at the
beginning that it is not evidence of absence but
absence of evidence. There has not been the research.
Q19 Stephen Metcalfe: Even in your view.
Professor Heather: I would think it very unlikely that
some people did not respond to guidelines by saying,
“Oh dear, I am drinking above those guidelines. I must
cut down.” They may well be middle-class Guardian
readers, if you like, but it is a matter for research.
Q20 Stephen Metcalfe: Does anyone else wish to
comment on that?
Dr Morgan: It would be very difficult to look at
trends, saying that we started with guidelines in 1987,
tiddled around with them in 1995, and then say, “Look
what an effect it has had”, as so many other forces are
driving total consumption. As Sir Ian mentioned, that
is much more likely to be driven by policies on
taxation, licensing and otherwise. Even if there were
a trend within that relating to the guidelines, you
would not see it.
Q21 Gavin Barwell: I have some questions about the
specific guidance for women. We have been provided
with a copy of the J-shaped curve, which shows a
much larger confidence interval for women. The 1995
report that Dr Harding was involved with said that it
was harder to produce an authoritative statement.
What specific evidence has emerged since 1995 in
relation to women and alcohol? You touched earlier
on the question of cancer, but has it become easier to
provide advice specifically for women?
Dr Harding: There are lots of studies on men and
women. It is appropriate for women to be advised to
drink less than men for two very good reasons. The
first is that, on average, they have a lower body
weight. Secondly, they have proportionately more fat
in the body than water, and alcohol resides in the
water, so at any given level of intake the alcohol
concentration will tend to be greater. Indeed, in
population studies that show benefit from moderate
consumption and harm at high consumption, the
tendency is for the beneficial effects to kick in earlier
for women and the harmful effects to kick in earlier
too.
Q22 Gavin Barwell: Dr Morgan, it seems that you
might disagree with all three of those points.
Dr Morgan: Only a man would say that women have
more body fat. The fact is that women have less body
water. From a physiological point of view, the
difference in how the body is made up between fat
and water means that, if a woman of 70 kg drinks a
double gin, a man of 70 kg would have to drink a
triple gin to match her blood alcohol level. Her blood
alcohol tends to be about a third higher on a weight-
for-weight basis. The tissue dose of alcohol that she
receives is clearly higher. Overall, the propensity for
her to develop harm therefore kicks in earlier, after
seemingly less alcohol. That is beautifully
demonstrated in studies of the 1970s from Germany,
where they looked at the risk of developing cirrhosis
of the liver, which kicked in at as low as 20 grams of
alcohol per day for women and at about 40 or 50
grams for men. There is a physiological basis to it,
and there is epidemiological evidence showing that
the risk of harm is higher. That was very much behind
the 21:14 differential that the working party decided
on in 1987.
Other factors clearly play a role for women,
particularly in terms of liver injury. That may include
hormonal status, which is why to a degree it is
possible that if there is a protective effect it does not
kick in until post-menopausal times. If you have a
look at the study by White—you will have been
provided with those curves—you can see that in both
men and women you have an exponential increase in
all-cause mortality in younger ages, and a suggestion
of the J-shaped curve in men in later life, and later
again in women. The most interesting thing, however,
is the overall notch down in the women. There is a
physiological basis for assuming that women are at a
different risk, and there is epidemiological evidence
that clearly shows that that is the case.
Q23 Gavin Barwell: Unless you have anything
further to add—I am pressed for time—I have two
further questions, and I shall ask them together. May
I start with Sir Ian and Professor Heather?
First, given your agreement that there is evidence, I
am interested to hear why a number of countries for
which we have been given them have the same limits.
We have been given data on the limits for a range of
countries. Australia, Sweden, Spain, France, Italy and
Romania all have the same limits for men and women.
I am interested to hear the reasons for an international
similarity in that regard.
Secondly, a report published in June by the Royal
College of Psychiatrists suggests a much lower limit
for older people and the same limit for men and
women in later life. I would like to hear your
comments on that.
Sir Ian Gilmore: Whether you differentiate between
men and women depends on where you set your
recommended levels. The higher the consumption, the
greater the harm curves diverge between men and
women. That is why, for example, using the
Australian absolute risk of one in 100, with two
standard drinks a day, they do not distinguish between
men and women; they are quite happy if you go up to
three drinks a day, but the risk of harm in women
increases very much more than in men. That is one of
the factors in determining whether or not you should
set different levels for men and women. If we stick
with the sort of levels used in the UK, it is important
for the reasons that you have heard that we should
distinguish the two.
The question on older people is interesting. There are
many reasons why, in principle, one would expect
older people to be more sensitive to the adverse](https://image.slidesharecdn.com/guiasalcoholuk-130415104347-phpapp02/85/Guias-alcohol-uk-55-320.jpg)
![cobber Pack: U PL: COE1 [E] Processed: [03-01-2012 16:30] Job: 015231 Unit: PG01
Source: /MILES/PKU/INPUT/015231/015231_o001_th_S&T 111012 Alcohol Guidelines HC 1536-i FINAL.xml
Ev 8 Science and Technology Committee: Evidence
12 October 2011 Sir Ian Gilmore, Dr Richard Harding, Professor Nick Heather and Dr Marsha Morgan
effects of alcohol; that includes their propensity to
fall, the fact that they have other diseases and may be
on medication that changes their body water-fat
balance. Yes, there is a rationale in setting lower
limits, but you come back to the question of
complexity. If you start saying that it should be
different for men and women, different for people
under 65 and over, different for pregnant and not
pregnant women, and different for under age and over
18, you run the risk of getting to a level of complexity
that will not be understood by the public. That is why
many would argue that the Australian system’s
relatively low level compared to some countries has
the virtue of simplicity, but it also includes women
and older people in the same guidelines.
Dr Morgan: Very quickly, we have considerable
concerns about the report by the RCPsych. It was not
an officially sanctioned report. We can provide you
with a detailed critique of it. In essence, its findings
were based on data for two years—2003 and 2008—
and it said that there was a slight increase in people
over 65 drinking above the recommended levels.
However, you need at least three points for a trend,
and it did not back up any of its data by showing
differences in hospital trends for falls or problems in
older people. It also misquoted the American units, so
there are some real problems with that report. If you
go back to White, you will see that, if anything, the
units in the older people could be increased rather than
decreased. I have definite concerns about the
recommendations for older people.5
Chair: We would welcome that critique.
Dr Harding: I have already said that it will be difficult
to draw anything from those comparisons unless you
know the evidence base, the nature of the analysis, the
type of groups and so forth. I was puzzled by the
Royal College of Psychiatrists report because, looking
at what I regard as the beneficial effects of moderate
consumption on coronary heart disease, through to
dementia and osteoporosis and so on, which are the
diseases of ageing, it seems that there are considerable
public health benefits to be gained in that age group
by sensible consumption.
Q24 Roger Williams: I have a few questions about
drinking during pregnancy and when breast feeding.
Would it be your view that women should abstain
absolutely during this period, and are there different
risks at the different stages of pregnancy and during
breast feeding?
Dr Morgan: There is no doubt that alcohol is a
teratogen—in other words, it damages the foetus. The
bottom line, in terms of the time span, is that a body
of evidence shows that drinking pre-conception and at
the time of conception is more harmful to the infant
than drinking in later pregnancy, which is why it was
originally suggested that you should not drink in the
first three months of pregnancy but that later perhaps
5
Note by witness: See Attachment 4 [Ev 79] for a critique of
the RCPsych report in which a fundamental and important
mistake was made in extrapolating data from the American
NIH guidance for older people. The authors of the report
recommend, based on this incorrect extrapolation, that daily
alcohol limits in > 65 year olds should be reduced whereas
correct extrapolation would support the opposite—in line
with data produce by White et al BMJ 2002.
one or two drinks once or twice a week would
possibly do no harm. We do not have a secure
evidence base for that. That is why the Canadians in
particular, who have a huge public health campaign
on the subject, have suggested that the safest thing
would be not to drink during pregnancy. It is a less
secure evidence base, but it is a pragmatic and
sensible approach that women should, by and large,
be advised not to drink when pregnant. A lot of
women do not need that advice, because losing the
taste for alcohol is one of those things that alerts them
to the fact that they are pregnant. It is the safest option
rather than necessarily the strongest evidence base.
Professor Heather: That is, of course, our own Chief
Medical Officer’s advice too.
Q25 Roger Williams: Would you like to say
something about breast feeding?
Dr Morgan: From the practical point of view, a
woman who has been drinking who breast feeds
conjures up all sorts of difficulties. I would not want
a woman who has been drinking to be actively breast
feeding. In terms of the practical approach, however,
the amount of alcohol that would get into the breast
milk and into the baby is quite small, because it is
heavily diluted within the woman’s system. The
amount that goes through in the breast milk is similar
to the quantity in blood, and that is then diluted within
the baby’s system. On a theoretical basis, the amount
of alcohol that the baby would receive is probably
going to be relatively small, but for me there is no
reason for saying other than that if you are breast
feeding it would be better not to drink.
Q26 Roger Williams: In the generality, rather than
referring to pregnancy, is there any way in which we
can identify individuals who are more susceptible to
harm from alcohol? Individuals find the concept of
risk difficult.
Dr Morgan: A great deal of work is ongoing on the
genetic factors that may predispose people to the
development of alcohol dependence and alcohol-
related harm such as liver disease and pancreatitis. We
know that the hereditability of alcohol dependence
within families is as high as 50%. We know that if
you have a first-degree relative who is an alcohol
misuser, you have possibly about a one in six chance
of developing it yourself. It may be possible
eventually, using genetic markers, to predict, “If you
drink you will get liver disease, but you won’t get
pancreatitis”, but what the value of that is in the
bigger picture I do not know. If you have a family
history, particularly if you have affected first-degree
relatives, being aware that you yourself are more
susceptible is a possible strong message.
Professor Heather: There are lots of risk factors—
individual personality, and genetic and social factors.
For example, socio-economic status is a big risk factor
for alcohol-related harm. Recent research shows that
middle-aged men in the lowest quintile had a four
times higher rate of alcoholic liver cirrhosis than those
in the highest socio-economic status quintile. That
cannot be explained by differences in consumption.
There are lots of risk factors, but they cannot all be](https://image.slidesharecdn.com/guiasalcoholuk-130415104347-phpapp02/85/Guias-alcohol-uk-56-320.jpg)
![cobber Pack: U PL: COE1 [O] Processed: [03-01-2012 16:30] Job: 015231 Unit: PG01
Source: /MILES/PKU/INPUT/015231/015231_o001_th_S&T 111012 Alcohol Guidelines HC 1536-i FINAL.xml
Science and Technology Committee: Evidence Ev 9
12 October 2011 Sir Ian Gilmore, Dr Richard Harding, Professor Nick Heather and Dr Marsha Morgan
incorporated into guidelines, as it would make them
immensely complex.
Q27 Stephen McPartland: Sir Ian, do you believe
that the Government are using evidence from a wide
enough range of scientific sources?
Sir Ian Gilmore: They do not use a sufficient
evidence base when it comes to developing alcohol
policy. That evidence base can come from a wide
range of sources, whether it is social sciences, clinical
sciences or basic sciences. The problem that I have is
that the evidence is out there on what will reduce
alcohol-related harm, but it is true that we need to
persuade the Government to use that evidence. I
understand that there are problems for Governments
in terms of things that may not be popular with voters.
It is interesting that where the greatest harm is seen in
the UK, in Scotland, is where the Government are
furthest ahead in taking evidence-based action.
Q28 Stephen McPartland: Do the rest of you agree
with that?
Dr Morgan: Yes.
Professor Heather: Entirely.
Q29 Chair: This has been a helpful session.
Clinicians such as yourselves will doubtless be asked
when you go to parties whether the guidelines or the
research should be considered as the most important.
Are you personally affected by research that you have
seen? Has it influenced your own behaviour? At the
end of the day, the Committee trusts the science
community, and it is interesting to see how you
respond to research that you have seen. Has any
particular piece of research influenced your personal
behaviour?
Dr Morgan: I have never been a particularly heavy
drinker; even at university I was not a particular
drinker. The only thing that would have influenced me
Examination of Witnesses
Witnesses: Jeremy Beadles, Chief Executive, Wine and Spirit Trade Association, Professor Averil Mansfield,
British Medical Association, and Chris Sorek, Chief Executive Officer, Drinkaware, gave evidence.
Q31 Chair: I welcome the three of you. For the
record, would you introduce yourselves?
Jeremy Beadles: My name is Jeremy Beadles. I am
chief executive of the Wine and Spirit Trade
Association. I am here to speak on behalf of four
drinks industry trade associations—ourselves, the
National Association of Cider Makers, the British
Beer and Pub Association and the Scotch Whisky
Association. Between us, I think we represent a
substantial part of the alcohol drinks industry.
Professor Mansfield: I am Averil Mansfield. At core,
I am a surgeon but I am here as chairman of the
science board of the British Medical Association. I am
not all that familiar with the world of alcohol but I
shall do my best to be as up-to-date as possible.
Chris Sorek: My name is Chris Sorek. I am the chief
executive of Drinkaware, an independent charity fully
funded by the drinks industry. It acts as a blind trust
for the money that comes in. We are governed by an
as a woman would have been the data on breast
cancer. My own drinking levels were below that level,
but what most influenced my friends was the data on
breast cancer in women.
Professor Heather: I drink less than I used to when I
was a young man, but I am not sure why. Perhaps it
is because of my research, but it may be because I
am older.
Chair: Older and wiser.
Professor Heather: Is it possible to make a couple
more points?
Q30 Chair: We are very pressed for time. If you wish
to make any additional points I should be grateful if
you were to follow them up in writing, as we are
conscious that another panel is waiting. I ask for a
final comment from Australia.
Sir Ian Gilmore: It is fair to say that the medical
profession does not have a good reputation with
alcohol, from medical school onwards. It is interesting
that doctors used to be near the top of the list of
occupations suffering from alcohol-related deaths, but
the most recent statistics show that they have dropped
almost to the bottom. I hope that it means that doctors
are beginning to take the lead, rather as they did in
stopping smoking. I hope that it shows that doctors
are beginning to moderate their consumption in line
with the evidence. There are other explanations of
why doctors’ mortality from alcohol has dropped, but
I shall leave it at that.
Dr Harding: I take advantage of the evidence of
moderate consumption.
Chair: We all consume moderately. I thank you all
very much for your frank answers. This has been a
very helpful session. Sir Ian, I understand that you are
staying online in order to listen to the rest of the
evidence; I hope that the line stays properly
connected. Thank you all for joining us.
equal number of public health professionals and
people from the industry, along with independents, to
ensure that the governance model of the charity is
totally independent.
Q32 Chair: I want to probe your perspective on the
purpose of Government guidance on alcohol
consumption. Do you think that the public generally
understand the guidelines?
Jeremy Beadles: The guidelines were introduced to
provide some guidance to the public about safe and
responsible levels of drinking. There is a growing
understanding of what they mean and what units
mean. If you track ONS data over the last 15 years,
the data indicate that more and more people do
understand. As we understand better how to pass on
that message, particularly in the work of Drinkaware
and what is being done by the Government, we seem](https://image.slidesharecdn.com/guiasalcoholuk-130415104347-phpapp02/85/Guias-alcohol-uk-57-320.jpg)
![cobber Pack: U PL: COE1 [E] Processed: [03-01-2012 16:30] Job: 015231 Unit: PG01
Source: /MILES/PKU/INPUT/015231/015231_o001_th_S&T 111012 Alcohol Guidelines HC 1536-i FINAL.xml
Ev 10 Science and Technology Committee: Evidence
12 October 2011 Jeremy Beadles, Professor Averil Mansfield and Chris Sorek
to be getting more understanding and acceptance of
the guidelines.
Professor Mansfield: So far as I can judge it, I share
the view that the guidelines are understood. Their
availability may not be quite as good as it should be,
but they are certainly better understood.
Chris Sorek: I would agree. The guidelines are there
to give consumers an idea of what their responsible
drinking limit should be. They act as good guidance,
but the ability of people to take them up and use them
still needs to be discussed.
Q33 Chair: What are the most important factors in
driving consumer behaviour in this area?
Professor Mansfield: From my point of view, it is the
health factors that you were discussing earlier; I very
much enjoyed listening to that first session. Most
consumers are now aware of and are concerned about
the effect that alcohol will have on their health. There
is an increasing awareness of that among the general
public, but the knowledge is not always followed that
they need to reduce their drinking because it is
dangerous. None the less, the knowledge is there.
Chris Sorek: Following on from that, we know that
consumers, especially adults of 30-plus, consider
health risks to be the most important reason to
moderate their drinking; hence, it is the message that
resonates highest with them. We also know that health
risks resonate very well with parents of young
children. Those messages that we communicate to
adults and parents on health are the most important
of what we try to communicate. Getting to them and
targeting them on health issues is a different matter,
but talking to them about health is what seems to
resonate best.
Jeremy Beadles: I agree with my colleagues. The only
additional factor is that the availability of the
information is increasing at a considerable rate
because both industry and Government understand
that if you want the public to take the message on
board it cannot be delivered only through doctors’
surgeries and hospitals. The message needs to be
delivered in places that they visit regularly, in places
where they buy alcohol and places where they
consume it. In terms of understanding how better to
deliver that message, the industry and the Government
and Drinkaware work together to ensure consistency
of approach and consistency of message. We need a
breadth of delivery into the marketplace that we all
use day in day out, rather than restricting it to
hospitals and doctors’ surgeries, places where we
hopefully do not go too regularly.
Q34 Chair: I am curious that the three of you,
particularly having listened to the previous session,
have not said that price affects behaviour. If it does
not, I shall talk to the Chancellor; he has a big income
stream from it.
Jeremy Beadles: My perspective on price is obviously
that there is a huge amount to be said about alcohol
pricing. Without doubt there is a link between the
price at which you set a product and the sales of that
product. If you put the price up the sales will drop.
That is basic economics, and I would not disagree
with that.
Where we take a different view is on how it impacts
on harmful and hazardous drinkers or problem
drinkers, and whether they are more or less affected
by the price. I understand that price mechanisms have
been used in other markets, particularly in places such
as Sweden, where all the alcohol is sold through a
monopoly structure. The national statistics there
recording alcohol consumption may have gone down
considerably, but our experience of that market is that
a huge amount of alcohol comes across the border and
that there is a huge amount of illegal brewing and
distilling. Indeed, many people go out on to the Baltic
sea on ferries at the weekend to get drunk. People who
have visited Sweden see on those streets a lot of the
issues that we have with regard to price correlation in
Europe. Many of the countries with the fewest
problems have the lowest price of alcohol. We in the
UK market have an average price point for a bottle of
wine at £4.84. In France, it is about £1.42 and it is
less in Spain and Portugal. Price correlation is much
more complex when it comes to tackling harmful
drinkers rather than just acting on the consumption of
the moderate consumer.
Professor Mansfield: The BMA stance would be that
we need to take every possible step to reduce the
amount of alcohol that people are taking. This
dangerous situation, with so many people being made
sick by the consumption of alcohol, needs to be
tackled on many fronts, one of which must be pricing.
That may not be the complete answer, and I am sure
that what Jeremy Beadles has said is correct, but one
of the prongs of the attack that we should be taking is
to make alcohol more difficult to buy, especially for
young people.
Chris Sorek: In terms of pricing and policy issues, we
are a charity set up by Government and industry, and
the public health community with Sir Ian Gilmore was
at the front end of the creation of Drinkaware. We
cannot comment on policy and policy-related issues.
We provide information and education for consumers.
There are two points to be made. There are issues
around the supply side of the equation, which include
pricing availability and licensing. We work on the
demand side, which is when consumers go out to have
a good time or may have too much to drink. That is
what we work on.
Q35 Stephen McPartland: Is the use of alcohol
units the best way to convey the alcoholic content of
drinks, or do you think that the Government should
promote the concept of litres of alcohol or something
similar as a way of getting across how much alcohol
is contained in drinks?
Professor Mansfield: It is pretty clear that the units
that we have at present are as good a way as any of
describing the amount of alcohol that we consume. A
lot of effort has been put into making them understood
by the general public. For better or worse, the message
should be retained because it is now fairly widely
understood. What is not quite so well appreciated is
what each item of alcohol contains in units. One
aspect that could certainly be improved is the
availability of information about how much it
contains. However, it is a good standard way of
describing alcohol. The other ways, in milligrams or](https://image.slidesharecdn.com/guiasalcoholuk-130415104347-phpapp02/85/Guias-alcohol-uk-58-320.jpg)
![cobber Pack: U PL: COE1 [O] Processed: [03-01-2012 16:30] Job: 015231 Unit: PG01
Source: /MILES/PKU/INPUT/015231/015231_o001_th_S&T 111012 Alcohol Guidelines HC 1536-i FINAL.xml
Science and Technology Committee: Evidence Ev 11
12 October 2011 Jeremy Beadles, Professor Averil Mansfield and Chris Sorek
millilitres, are rather complicated, and we need
something simple and straightforward.
Chris Sorek: The Government has put a lot of money
into making sure that units is the best way in for
people to understand how much they drink, and also
the amount of alcohol that they are drinking on a
regular basis.
As for the point that Averil made, one of the things
that we, the British Beer and Pub Association, the
Wine and Spirit Trade Association and the retailers,
have come up with is a way to easily show people—
this is going to appear across the country in pubs and
the off trade—how many units go into people’s
favourite units. The favourite drinks of the British
public are a pint of beer, a 330 ml bottle of premium
lager, a 175 ml glass of white wine and a 25 ml spirit
measure. That will give people an idea of the units
they consume. Using the mnemonic device “2–2-
2–1”, consumers will then immediately be able to say,
“Let’s see what my favourite drink is.” If they can
figure that out against the unit guidelines—two to
three for women and three to four for men—they can
immediately make the connection between the two.
That is the critical juncture that we seem to have been
missing for the longest time. People talk about units
but do not necessarily know what a unit looks like.
We have seen this in research—and not only in our
own; I believe that Government research said the
same thing.
Jeremy Beadles: I agree with what has been said. The
important thing is that we stick with what we have.
Changing now would set us back a long way. There
are issues of consistency with units of alcohol around
the world, with different things in different markets.
There is a consistency problem even in Europe, but
we are where we are and the key is to ensure that
people understand what is in their drinks. It is not just
about point of sale communications; it is what is on
labels as well that helps people define it. Progress was
slow in the last part of the previous decade, but it has
been kicked forward very fast in the last couple of
years through the work of Drinkaware in partnership
with the industry. Things are changing quite
dramatically.
Professor Mansfield: May I add something? It would
be very helpful if the Government were to say what
should be happening with regard to the public’s
knowledge of what is contained in every alcoholic
drink. Instead of the inevitable influence of the
industry—for better or worse, they have their own
vested interests in making alcohol available to
people—the standard should be set by the
Government and not by the BMA or the industry. You
should be the people who take on this problem,
declaring what is needed on labels in pubs and on
bottles wherever you go, but it is not there at the
moment.
Jeremy Beadles: All of the stuff that we are doing is
in agreement with the Department of Health. We
would not put out messages on unit information or the
chief medical officer’s advice without the
Department’s agreement. It has been part of the
process, so it is up to them.
Chris Sorek: The information that people get from the
website—we regularly exceed 235,000 unique visitors
to our website every month—is based on the
guidance, and it is vetted by an independent medical
panel of members of the British Medical Association.
Q36 Stephen McPartland: In previous answers, you
mentioned the weekly and daily limits. Are those
limits about right, or should they be increased or even
lowered? Do you have any ideas on that aspect?
Chris Sorek: From Drinkaware’s perspective,
whatever the guidance is and whatever Government
provides is what we use and what we communicate
to consumers.
Professor Mansfield: I listened to Ian Gilmore’s
evidence and I share that view. Please do not put the
limits up.
Q37 Graham Stringer: Do you have a view on
whether advice to consumers should be based on
weekly or daily consumption? Do you have any
evidence that, when the advice changed in 1995 from
weekly to daily, it changed consumer behaviour in
any way?
Jeremy Beadles: As I said, it is not up to us to decide
whether it should be weekly or daily guidance. That
has to be a decision for the Government, based on the
evidence available to them. I am not aware of any
data that correlate to changing consumer patterns from
that date.
Q38 Chair: The industry gave evidence to the
Government during their consultations.
Jeremy Beadles: Not about the medical impact of
drinking, no.
Professor Mansfield: With regard to daily or weekly
limits—I would come down in favour of daily rather
than weekly—what matters most is that the message
should not be that you should drink two to three units
a day. Somehow, we have to get the message over that
you do not have to drink at all, and that you certainly
should not drink at all on a couple of days a week. It
almost gives the green light to go ahead and drink
two, three or four units a day; the Government
guidelines seem to indicate that that is okay. We need
to tone that down so that people know it is the
maximum and not something that is desirable every
day, and it will not give you added health, but if they
do consume that amount there will inevitably be a
health risk.
Chris Sorek: The one thing I would say to that
question is that whatever we put out—this echoes
what we heard from the first panel—has to be clear,
consistent and accessible. Those are the three things
we need, whatever guidance is given. We have also
heard this morning that some people are saying that
there is a protective element to certain types of
alcohol, but others were saying no. Consumers are
looking for direction on which is right and which is
wrong. It is the evidence that we communicate that
people take on board and use. As long as it is clear,
consistent and accurate, I doubt whether there will be
a wrong conclusion.
Q39 Graham Stringer: Should advice be directed to
demographic groups? In particular, we have heard that
the behaviour of young people between 18 and 28 is](https://image.slidesharecdn.com/guiasalcoholuk-130415104347-phpapp02/85/Guias-alcohol-uk-59-320.jpg)
![cobber Pack: U PL: COE1 [E] Processed: [03-01-2012 16:30] Job: 015231 Unit: PG01
Source: /MILES/PKU/INPUT/015231/015231_o001_th_S&T 111012 Alcohol Guidelines HC 1536-i FINAL.xml
Ev 12 Science and Technology Committee: Evidence
12 October 2011 Jeremy Beadles, Professor Averil Mansfield and Chris Sorek
very different from that of people between 35 and 50.
Should advice be directed to those groups?
Professor Mansfield: I suggest that you need to
monitor the advice. You need to modify it according
to where the particular groups at risk are most to be
found. For example, if you are talking about binge
drinking that is a particular age group, is it not?
Q40 Graham Stringer: I do not know. Is it?
Professor Mansfield: I think so; I think it is very
much the younger end of the spectrum, but I am no
expert.
Chris Sorek: To the question about whether the
message should be different, the answer is absolutely
yes. We have done research across the United
Kingdom that shows that adults of 30-plus respond
better to the health-harm issues that need to be
addressed. However, for younger people of 18 to 24,
research shows that once they start drinking at 18 it is
almost as if the lid has come off and they start
drinking very quickly, and a lot of everything. We
need to bring down and reduce the acceptability of
being drunk and change people’s culture. Another of
the things that we try to do, is to change their
behaviour. We give them coping tips now. As we work
through this year’s campaign and consider what we
have done over the last two years, we are trying to
give them information to change their behaviour. It is
not necessarily just to be aware of issues but to change
their behaviour so they do not go out and let a good
night go bad. They should take a look at how much
they are drinking and ensure that they do not go over
that limit and all of a sudden get into trouble.
Q41 Graham Stringer: Can public information
campaigns really compete with the subliminal
messages you get in films such as “The Hangover”, in
which young people completely losing their memory
is seen as having a good time? Can you compete
with that?
Chris Sorek: Social marketing shows that there are
some places where you can do that. It takes time; it is
not going to happen overnight. It will continue to
build up as you go through a number of campaigns to
find out what messages resonate best with the target
audience. I do not think that there is any one magic
bullet that will solve the problem of episodic drinking
at the weekends by young adults.
We have two campaigns going on right now. One is
“Why let good times go bad?” The other is a
campaign in which we are working with the Welsh
Assembly Government to look at social norming.
Basically, as we heard earlier, we are looking at peer
group pressure to see whether there are ways in which
we might be able to get young people to understand
that their friends are not drinking as much as they
think they are. What is really going on is that they
really do not drink as much as their friends. This is
clearly a big thing that we need to address, and that is
one way of doing it. We are testing a number of
methods of social marketing to change people’s
attitudes to drinking and also to change their
behaviour.
Q42 Roger Williams: What role should the drinks
industry play in communicating alcohol guidelines?
Perhaps we can break it up between manufacturers,
retailers and hospitality outlets such as pubs, clubs and
so on.
Jeremy Beadles: What role they should have or do
have?
Roger Williams: What role they should have.
Jeremy Beadles: I start with the supply perspective. I
recognise that retailers, too, are suppliers; 30% of the
wine sold in the UK is own-brand wine from the
supermarkets as is 30% of spirits. The role of
suppliers in the first instance is to ensure clear
labelling on the product and to ensure that unit
information and the chief medical officer’s guidance
is on the product.
Moving forward to the off-trade and the on-trade,
there are different mechanisms for delivering
messages in those two environments, and Chris is the
expert on that. However, we think that a consistent
unit message can be delivered across both. Three
years ago, the WSTA worked with Drinkaware to put
a campaign called “Know your drink” in supermarkets
and off-licences. It got coverage in more than 10,000
stores, and evolutions of it have been running in most
of the major retailers since then.
At the end of last year, with the British Beer and Pub
Association and Drinkaware, we looked at the
materials that they were producing for pub trade and
the on-trade. That is a very different environment, and
different guidance and different thought patterns are
needed on how to influence behaviour for those sitting
in the pub with a drink. We saw the work that they
had done together on that, and our view is that it was
better than the work that we had done previously on
the off-trade. We felt that there was a lot more
credibility in coming up with a consistent message
across both environments, so that when people walk
into a shop, a pub or a club, they see exactly the same
message wherever they go. It becomes a message that
they can understand, and “2–2-2–1” will be the
strapline of the whole thing. We are working at this
moment in time on rolling them out in both the off-
trade and the on-trade, so you should shortly start
seeing them everywhere, from beer mats to wine
displays.
Beyond that, there are roles in terms of how we can
use our websites, our digital communication routes
and so on to communicate that message. The key
thing is that all of those messages come through
Drinkaware. That is why you will see the Drinkaware
brand on pretty much every product in the UK
marketplace, on every piece of advertising and on
every piece of sponsorship. It is the most recognised
charitable website brand in the UK marketplace,
because it is seen on more than 3 billion products. The
key is to drive a consistent message and to ensure that
the drinks industry is delivering best practice; and it is
delivered by Drinkaware and signed off by its medical
panel and the Department of Health.
Professor Mansfield: I stress what I said earlier. It is
important, and I am hopeful about it, that the Science
and Technology Committee is seeking evidence from
the medical profession and the drinks industry. I hope
that, at the end of the day, you will not be dictated to](https://image.slidesharecdn.com/guiasalcoholuk-130415104347-phpapp02/85/Guias-alcohol-uk-60-320.jpg)
![cobber Pack: U PL: COE1 [O] Processed: [03-01-2012 16:30] Job: 015231 Unit: PG01
Source: /MILES/PKU/INPUT/015231/015231_o001_th_S&T 111012 Alcohol Guidelines HC 1536-i FINAL.xml
Science and Technology Committee: Evidence Ev 13
12 October 2011 Jeremy Beadles, Professor Averil Mansfield and Chris Sorek
by the drinks industry—whether neatly by the
gentleman on my right or diluted through charity by
the gentleman on my left. We need the Committee
to consider the evidence and to declare what is the
appropriate way to label things so that the public will
know what they are getting. I promise you that, at the
moment, it is not out there.
Chris Sorek: Echoing what we have heard so far, we
need to make sure that consumers get clear, concise
and accurate information, and that it comes well-
evidenced. It should come from the chief medical
officer and the Government, and that is what should
be communicated.
Q43 Roger Williams: Should the Committee be
concerned that in the public health Responsibility
Deal that has been produced, the Government are
putting more responsibility on the industry and less
on statutory or public bodies?
Professor Mansfield: I have made my position pretty
clear on that. That is not correct; that is not the right
way to go about it.
Jeremy Beadles: As one of the co-chairs of the
Alcohol Responsibility Deal, I have been intrinsically
involved in the process since the start. My view is that
it is not about setting or dictating Government policy;
it is about the alcohol industry and other organisations
finding ways of delivering things that the Government
wish to have delivered, such as unit labelling and
point of sale information. To be frank, it would be
extremely time-consuming and costly putting it
through Europe and getting the legislation out on the
other side, and frankly impossible in terms of
providing unit information in a pub environment. The
evidence base would be extremely difficult to put
together, and the cost of administering a scheme of
that nature would be disproportionate. If the industry
is prepared, willing and happy to do this stuff and can
roll it out through its mechanisms, I am not sure that
I see a problem.
This and the previous Government have been talking
to industry about delivering these things. Labelling,
point of sale information and community alcohol
partnerships are all positives that everyone wants the
industry to do, as far as I am aware, and we are doing
it within the parameters set out in the Responsibility
Deal. The Responsibility Deal does one thing above
all else that has not been done in this sphere before:
it requires individual companies to sign up and make
a commitment about what they are going to do as
businesses. It is not asking the industry to deliver; if
it did, at that point you would always get three or four
companies that did lots and lots of stuff while
everyone else lagged behind. In this instance we have
everyone doing it.
In terms of the labelling commitment, I have here the
label that will be on products across the UK. If you
turn around a bottle of Bollinger or Veuve Clicquot or
Moët and Chandon on the shelf, you will find this
label on it. One of the more difficult negotiations that
I have had to do during my period in this job was
persuading the French champagne houses that they
should put that information on their bottles, but they
have done so, and we now see the rest of the industry
following. It is a large and diverse industry with many
small companies, but particularly in the wine sector
many tiny companies are involved. Getting to them
all takes some time, but the Responsibility Deal now
has more than 220 businesses signed up to it. It is one
of the largest voluntary agreements ever put together.
Chris Sorek: As a charity, Drinkaware is basically a
channel for communications for what might be done
under the Responsibility Deal, and we co-ordinate
closely with the Department of Health, the Home
Office and the Department for Education on all of
our communications.
Q44 Roger Williams: Finally, Professor Mansfield,
you have made your position very clear. We have a
BMA quote saying that industry self-regulation has at
its heart a conflict of interest. Do you have any
specific examples of that? Has its work been
influenced by a concern for profitability or
sustainability?
Professor Mansfield: I cannot say that I have direct
evidence, but from what I what have heard it seems
quite wrong. The word “voluntary” has been used
repeatedly this morning. In the first session, you heard
about the enormous harm that this drug, alcohol, is
doing to the population. Most of us like it, but we
have to know that there is a limit. Passing on
information in a voluntary way is not strong enough.
Q45 Stephen McPartland: Mr Sorek, I am
interested in what information should be printed on
alcoholic beverage labels. You mentioned earlier the
different things that apply, with different reactions for
different socio-demographic groups. I wonder how
many calories there are in a bottle of wine for those
younger people who are weight conscious.
Chris Sorek: We were talking about that specifically,
and earlier this year we did a mail drop of a unit
calculator to 2.3 million households across the United
Kingdom. The reaction was extremely good. It shows
exactly how many units and how many calories are
in your favourite drink. I am happy to supply you
with one.
Stephen McPartland: Yes please.
Chris Sorek: Either that, or you can go to
MyDrinkaware, a digital tool on our website. People
can put in their favourite drink and find out whether
they are drinking at a low level, an increasing level or
a harmful level that is a high risk. People put in their
drink of choice and can find out whether or not they
are drinking at a limit that is above the guidelines, and
whether it is at a rate that could harm them. It also
tells them how much money they are spending—and,
to answer your point, how many calories they are
taking on board. You can find it out very quickly.
Q46 Stephen McPartland: I wonder whether you
think that for some socio-demographic groups the
number of calories would resonate more than one or
two units.
Chris Sorek: Absolutely. Some people—for example,
young women—respond very well to calorific content.
They will do that almost immediately. Weight
watchers will do the same. We find that those types
of messages work extremely well with them, but that
always leads them into a conversation about units and](https://image.slidesharecdn.com/guiasalcoholuk-130415104347-phpapp02/85/Guias-alcohol-uk-61-320.jpg)
![cobber Pack: U PL: COE1 [E] Processed: [03-01-2012 16:30] Job: 015231 Unit: PG01
Source: /MILES/PKU/INPUT/015231/015231_o001_th_S&T 111012 Alcohol Guidelines HC 1536-i FINAL.xml
Ev 14 Science and Technology Committee: Evidence
12 October 2011 Jeremy Beadles, Professor Averil Mansfield and Chris Sorek
guidelines. Calories could be a way in for some
people, and it definitely works.
Q47 Stephen McPartland: Mr Beadles, are those
calorific amounts displayed on labels at the moment?
Jeremy Beadles: No; at this moment in time European
legislation does not permit calorific information.
Some businesses display it, but it is not a legal
requirement and the means by which you have to
present that information are not yet signed off by the
Government. Don’t get me wrong; we believe that
there is a route to providing calorie information. We
support Chris in the work that he is doing, and one of
the pilots that the Responsibility Deal is considering
is how to convey that information to consumers in a
way that is helpful to them. For instance, is it helpful
to present consumers with a calorific content for an
entire bottle of wine? Is that a helpful way of
delivering the information? Is it helpful to say to
consumers that one glass of wine has 110 calories and
that another has 130 calories, or is it better to say that
a standard glass of wine has so many calories as we
do for units? When you start getting into the detail of
calorific information, it is not a problem talking about
calories. What matters is doing it in a way that
improves consumer health.
Concerns have been raised by people around the
Responsibility Deal table, the public health
community included, about how that drives behaviour.
You can reduce your calorie intake and increase your
alcoholic intake at the same time; a neat spirit product
is less calorific than a pint of beer or cider. The
question is whether that is the sort of behaviour that
you are seeking to bring through. What impact will it
have, particularly on young people on a night out, if
they know that there are lots of calories in the alcohol;
should they eat before they go out or while they are
out? We would like to see them doing those things.
Should it be an either/or thing? The industry is
certainly not opposed to the provision of such
information. We already support its provision in some
formats, but we would like to understand a little better
how to standardise it. I am not sure, from a public
health community perspective—this view has been
put to me quite forcibly—that we would wish to get
into a diet drink promotion and the idea that it is okay
to have a Bacardi and Diet Coke rather than a Bacardi
and Coke. For instance, would you be promoting
something else by giving such calorie information?
Q48 Stephen McPartland: The label that you
showed us earlier seemed to contain an awful lot of
information in a very small space. Do you think that
that is in the best format? Are we putting too many
messages on that label?
Jeremy Beadles: The label here, which I hope is in
your pack, has the three bits required by the
Government as part of the Responsibility Deal; they
are the UK units, the chief medical officer’s guidance
and the pregnancy message. The Drinkaware logo and
the “drink responsibly” message are optional,
although most businesses include them. There is
already a huge amount of information on the back of
all bottles or cans. Simplifying it is always the
absolute key. This is the format that the Government
developed and have signed off with the Portman
Group, and it is already to be found on tens of millions
of products. To move away from it would be
extremely problematic to the industry.
Q49 Stephen McPartland: How do you think the
industry would react if it said on the front of the
product, “Drinking this could be bad for your health”?
Jeremy Beadles: We would like to see the evidence
before using it.
Q50 Stephen McPartland: If the Department of
Health provided the scientific evidence to say that
drinking it was bad for your health, would the industry
go along with putting it on the front of their products?
Jeremy Beadles: On the front of their products?
Voluntarily? I could not say at this point in time.
Q51 Stephen McPartland: My final question is to
Professor Mansfield. In a written submission, you
suggest that labels should contain warnings about the
risks of exceeding guidelines. What evidence do you
have on the impact?
Professor Mansfield: I did not hear the question.
Stephen McPartland: The BMA has made a written
submission suggesting that labels should contain
warnings about the risk of exceeding guidelines. What
evidence is there that that would have an impact on
drinking behaviour?
Professor Mansfield: I have no evidence to support
the idea that that would change behaviour, but at least
it would give them the opportunity to change, perhaps
with a little more knowledge than is currently
available. Although we have heard from the industry
that the knowledge is on every bottle, it has not yet
achieved that aim. As I said earlier, it has to be pushed
upon the industry—by you.
Jeremy Beadles: May I clarify that? I was not saying
that it had been achieved on every bottle. We are
working towards a target of 80% of products on
shelves by 2013. There will always be some products
in this market—small volume products—that do not
have it under a voluntary agreement, as it would put
small wine merchants out of business. You cannot
require Italian or French producers, who may produce
only a couple of thousand bottles of wine a year, to
label specifically for our market. If you do that, the
product will never come here. It is about the majority
of products having it, and certainly the vast majority
that most consumers see.
Chair: You have provided some graphics in evidence,
and screen dumps from the website; it would be
helpful to have copies of those and of the cards that
you circulated to households.
Q52 Stephen Metcalfe: I have some questions about
drinking during pregnancy and understanding the
risks. We have heard slightly mixed messages about
whether it is safe to drink during pregnancy. Has that
confused the public?
Professor Mansfield: I am certain that it has confused
them. Yes, it may be possible to have a little alcohol,
but the fundamental message that the medical
profession would like to send is this. For women who
are contemplating pregnancy—after all, as far as I can](https://image.slidesharecdn.com/guiasalcoholuk-130415104347-phpapp02/85/Guias-alcohol-uk-62-320.jpg)
![cobber Pack: U PL: COE1 [O] Processed: [03-01-2012 16:30] Job: 015231 Unit: PG01
Source: /MILES/PKU/INPUT/015231/015231_o001_th_S&T 111012 Alcohol Guidelines HC 1536-i FINAL.xml
Science and Technology Committee: Evidence Ev 15
12 October 2011 Jeremy Beadles, Professor Averil Mansfield and Chris Sorek
judge, the most important time is right at the very
beginning, so it has to be the women who are thinking
of becoming pregnant and not only those who are
already pregnant—the simplest message is that if you
are thinking of becoming pregnant or are already
pregnant, alcohol is bad for you and for your baby. It
should be completely avoided.
Chris Sorek: We followed the same guidance. On our
website, the page on pregnancy and alcohol has
received 55,000 hits over the last 12 months. I know
that breast feeding came up in the previous panel
discussion. We have had 19,000 pages views on breast
feeding and alcohol. Both of these are fairly
substantial increases—15% for the first and 49% for
the second.
Q53 Stephen Metcalfe: Do you communicate the
actual risk on the website, or does the guidance just
say, “Do not drink when breast feeding”? Perhaps for
some the guidance is fine; they just need to know that
guidance is in place and that the advice is not to drink
during pregnancy. Others, however, might want to
understand the actual risk—what they are playing
with, why there is a risk and what are the margins.
We probably tend to understand that much better with
smoking, but I am not sure that we understand about
the risks to health of our drinking. I do not know what
the risks are of my drinking. I know what the guidance
says, but I do not know what my potential health
impacts are. Perhaps we need to work a little more on
that aspect.
Chris Sorek: On our website, we tell people what the
potential risks may be, but we also signpost them to
organisations and charities that have information and
more detail; that is where they need to go for that. We
also suggest that they might want to talk to their GP
or their obstetrician.
Q54 Stephen Metcalfe: Do you accept that, in the
wider world, there is no understanding of the actual
risk but only of the fact that there is a risk?
Professor Mansfield: I am not sure about that. We
need clarity in the message. People who are intelligent
will delve deeper into the evidence, but overall we
just need a clear message.
Chris Sorek: I concur 100%, yes.
Jeremy Beadles: We were asked by the Government
to put out the message on our products that people
should not drink when pregnant or trying to conceive.
That is what we have done.
Q55 Stephen Metcalfe: Do you think that it is
working? You said that you have had 55,000 hits.
Chris Sorek: We know that there is interest. Whether
or not it is working is another question. These are all
things that we will have to keep on considering and
then go back to consumers and ask them.
Jeremy Beadles: The Department of Health research
shows a high level of knowledge among women of
issues around pregnancy and alcohol.
Q56 Stephen Metcalfe: Does anyone know what
other countries do and how they handle the question
of drinking during pregnancy?
Jeremy Beadles: I believe that we were following
France with our message and with our pregnancy
logo. I believe that Australia is now following us.
Q57 Chair: Earlier, we touched tangentially on what
is the most effective way of communicating with the
public. Has any work been done using new
technologies to communicate some of these
messages?
Chris Sorek: Yes, there has been. We also have low
technology solutions. For example, we have a drinks
cup, to help you figure out how many units are in the
cup. We gave out close to 600,000 of these across the
country, although most of them went to Scotland in
support of Alcohol Awareness Week.
There are a number of others. In one of them, we
produced a primary and secondary school resource
based on “Unplugged”, an EU-evaluated educational
programme that has been running over the last seven
years in 10 countries that showed substantial
reductions of 25% to 35% in substance misuse by
secondary school students. We took the same concept
of developing a life-skills based approach;
educationalists and academics created the programme
and it is now being made available to schools across
the country. The idea is not necessarily to talk to
young people specifically about alcohol but to give
them an understanding of how to do deal with issues
in a way that builds up their confidence and their
decision-making capabilities. Most of this is done in
a digital format, although there is a low-tech version
as well.
The work that we are doing in delivering messages
through the internet is very targeted. It goes to
parents’ websites and adult websites—I say “adult”,
but I must be careful in what I say; I mean websites
that are oriented towards adults and their interests. We
can target those specifically. For example, with the
screenshots that I showed you a few moments ago, we
had 80,000 people sign up to MyDrinkaware in a very
short period literally by going online. We were
delivering the message, “Are you interested in
something like this? Please go to the website.” They
took it down, went through it and then signed up to
the programme.
There are many ways to use the internet to reach out
to people, through digital campaigns as well as
through other information sources. We also use parent
bloggers and parent networks to do that. Next week,
we will announce a new parents campaign aimed
specifically at parents of under-18s on how to give
them the information that they need to be able to do
so, rather than telling them what they are supposed to
be doing as parents. As it turns out, Mumsnet—I am
sure that most of you will have heard of it—along
with Family Lives and other sites, are meeting us next
week as part of the round table, when we shall talk
about the best way to communicate via the internet to
parents across the country.
Q58 Chair: Do you use social media?
Chris Sorek: Absolutely. We use Twitter, Facebook
and all social media to get the message out, as well
as blogs.](https://image.slidesharecdn.com/guiasalcoholuk-130415104347-phpapp02/85/Guias-alcohol-uk-63-320.jpg)
![cobber Pack: U PL: COE1 [E] Processed: [03-01-2012 16:30] Job: 015231 Unit: PG01
Source: /MILES/PKU/INPUT/015231/015231_o001_th_S&T 111012 Alcohol Guidelines HC 1536-i FINAL.xml
Ev 16 Science and Technology Committee: Evidence
12 October 2011 Jeremy Beadles, Professor Averil Mansfield and Chris Sorek
Q59 Chair: Have you made an analysis of the
effectiveness of that kind of investment?
Chris Sorek: Indeed, and MyDrinkaware is a prime
example. The campaign cost us approximately
£90,000. We saw an immediate uptake, with about
50,000 people signing up to it. That gives you an idea
of how fast it can work. Over the last few years, we
have gone further and further with getting such things
as “Why let good times go bad?” into the digital
format, and also working with other applications. In
the same way, we have seen general uptakes in people
taking up our tips. Yes, it does work, but we are at the
front end. As we go through the next few years and
we evaluate things more and more, I am sure that we
will find that it has an impact—but that is not to say
that we should not be using low-tech versions as well.
Q60 Chair: Mr Beadles, that was an interesting
series of answers from Mr Sorek, but some of these
effective tools run counter to the interest of your
industry. They will impact upon volumes of
consumption.
Jeremy Beadles: The industry takes its social
responsibility very seriously. We promote social and
responsible drinking, and we do not encourage binge
drinking. We would like all people to drink within
Government guidelines. As for what we can do to
support Chris’s work, Drinkaware does the work and
it knows what works and what does not, and it asks
us to amplify that using the routes to market that we
have through our businesses. There is a huge level of
investment beyond the direct funding of Drinkaware
in how we amplify its messages, using all the routes
open to us through out promotional organisations,
producers, retailers and suppliers.
Professor Mansfield: These public health messages
that we hear about, which are excellent, are inevitably
linked with the drinks industry. Surely they should be
public health coming from you and not from the
industry.
Q61 Chair: We are Parliament, not Government. You
are arguing that the public health campaigns that the
Government run periodically on different topics
should include a consistent one on alcohol.
Professor Mansfield: Yes please.
Q62 Chair: How would you handle that? How would
you communicate the message? You have heard what
Mr Sorek is doing in his use of modern tools. How
would you get your message to the broadest base of
the population?
Professor Mansfield: It would be foolish of me to
suggest that I am an expert on that. I am not, but I
have listened to good pieces of material that are being
put out. I believe that it should be a public health
message coming out rather than one from the drinks
industry. There are many ways of doing it, but, as I
say, I am not an expert and cannot speak to that
subject. However, public health is really important.
Q63 Stephen Metcalfe: Do I take it that you agree
with the message but that you are not keen on the
messenger?
Professor Mansfield: The message is linked to
alcohol. At all times, that potentially legitimises the
use of alcohol by all these groups. I would like to see
it completely dissociated from the drinks industry, in
whatever form it takes, so that we get the clear
message that it is your health that we are concerned
about. There is no financial benefit to be gained,
although the national health service would obviously
benefit hugely if we did not have so much alcohol-
related harm, but that is the aspect that concerns me.
Chair: Thank you very much indeed for your insight
into this problem. Any further documents you have
would be happily received. Thank you for your
attendance this morning.](https://image.slidesharecdn.com/guiasalcoholuk-130415104347-phpapp02/85/Guias-alcohol-uk-64-320.jpg)
![cobber Pack: U PL: COE1 [SO] Processed: [03-01-2012 16:31] Job: 015231 Unit: PG02
Source: /MILES/PKU/INPUT/015231/015231_o002_th_S&T 111026 Alcohol Guidelines HC 1536-ii FINAL.xml
Science and Technology Committee: Evidence Ev 17
Wednesday 26 October 2011
Members present:
Andrew Miller (Chair)
Stephen Metcalfe
Stephen Mosley
Pamela Nash
________________
Examination of Witnesses
Witnesses: Anne Milton MP, Parliamentary Under Secretary of State for Public Health, Dr Mark Prunty,
Clinical Adviser, Alcohol and Drugs, Department of Health, and Chris Heffer, Deputy Director, Alcohol and
Drugs, Department of Health, gave evidence.
Q64 Chair: Good morning, Minister. Thank you for
coming to see us this morning. For the record, perhaps
your two colleagues could introduce themselves.
Chris Heffer: My name is Chris Heffer. I am Deputy
Director for Drugs and Alcohol within the Department
of Health.
Dr Prunty: I am Mark Prunty. I am an addiction
psychiatrist, practising in Surrey, and I am Senior
Medical Officer for drug and alcohol policy at the
Department of Health.
Q65 Chair: As you know, the purpose of this inquiry
is to explore the Government’s view on the evidence
base related to alcohol consumption guidelines and
how well they are communicated to the public. How
rapidly is the evidence base on alcohol evolving, and
how does the Department of Health monitor new
scientific research?
Anne Milton: In a variety of ways. We are mindful
always of new research that is emerging. If only
somebody would publish something definitive, my job
would be a lot easier. It is a constant process. There
is no beginning and no end to it. We constantly look
at research. We have people like Dr Prunty in the
Department, who gives us some expertise, but we also
commission quite a lot. NICE, for instance, has issued
guidelines on alcohol in pregnancy for health
practitioners in 2007. There are a variety of bodies
that we can call on and from whom we commission
advice and support. It is the job of officials and,
indeed, the job of Ministers to keep an eye on what
is emerging.
From my point of view, the most important thing is to
keep an open mind. The most dangerous thing we
could ever do is to think for one minute that we have,
at any one time, all the evidence we need or that the
advice is accurate. We need to remain open-minded
and be receptive to new research that is emerging.
Q66 Chair: Do you, in any way, directly fund or co-
ordinate health research on alcohol?
Anne Milton: I am sure we have from time to time. I
am going to ask Chris Heffer, if I may, Chairman, to
give you details because he will know when it was
last done.
Chris Heffer: The Department has funded a variety
of bespoke research into particular topics. In recent
years it has funded the NICE review, as the Minister
said. NICE came out with a range of alcohol health
policies in 2009. The Department has funded research
Graham Stringer
Roger Williams
on issues such as pricing and licensing as well. The
Department has a wider range of research and
development budgets to look into policies regarding
alcohol. We have not, to my knowledge, done specific
research on the guidelines of particular health risks.
That said, we have done particular works, for
example, two years ago when we did the campaign
Drinking Causes Damage You Can’t See. We have
also done particular aspects of risks around cancer,
and for that one we updated the risks we knew. We
worked with Cancer Research UK, who have a lot of
expertise and credibility. Their name and branding
was on the adverts as well. We were checked by the
ASA pre-clearance process as well and, in particular,
about the wording. We even had to discuss whether it
was “Drinking more than two pints” or “Two pints
and more”. We even got a challenge from the ASA as
well. Somebody wrote in to say that they did not agree
with our evidence. That was scrutinised and justified.
As and when there are specific uses or things we are
trying to do, we follow proper process. We update the
evidence base when we require it and we go through
the external scrutiny process that that requires.
Anne Milton: Some of the changes that we are
proposing to the creation of Public Health England is
making sure what we have in place. It is good that
the Campaign for Science and Engineering recently
praised the Department. I have a quote here, which
says: “We urge the rest of Whitehall to follow Defra
and DH’s lead in thoroughly embedding scientific
advice in departmental structures”, which I believe we
have. Of course, it does not end with evidence and
guidelines on alcohol. We also need to collect a body
of evidence about creating behaviour changes.
Q67 Chair: That is interesting, because last week Sir
Ian Gilmore was before us. He suggested that the
Government do not use a sufficient evidence base and
mentioned, in particular, social science data.
Anne Milton: No. That is what we have just started
to do.
Q68 Chair: So this is the beginning of a process.
Anne Milton: There is an emerging and growing body
of evidence out there about how to change people’s
behaviour. One of the problems for a non-scientist like
myself—I would not consider myself to be one—is
that you expect somebody to come up with an
absolute answer and, of course, it is not nearly as
simple as that. This is terribly important because at](https://image.slidesharecdn.com/guiasalcoholuk-130415104347-phpapp02/85/Guias-alcohol-uk-65-320.jpg)
![cobber Pack: U PL: COE1 [E] Processed: [03-01-2012 16:31] Job: 015231 Unit: PG02
Source: /MILES/PKU/INPUT/015231/015231_o002_th_S&T 111026 Alcohol Guidelines HC 1536-ii FINAL.xml
Ev 18 Science and Technology Committee: Evidence
26 October 2011 Anne Milton MP, Dr Mark Prunty and Chris Heffer
the end of the day we want to change people’s
behaviour and help them lead a healthier life. It is
terribly important that we continually keep an eye on
what is most likely to achieve that. Chris mentioned
the precision with which words are looked at that
might be used in campaigns.
Dr Prunty: It is probably worth mentioning in relation
to the research that has been commissioned that a
major piece of research into identification and brief
advice draws upon the guidelines to help people who
wish to change their drinking to lower risk levels.
That is a randomised control trial that has been funded
by the Department in recent years and will be
reporting shortly. We also work with the MRC, which
have made alcohol and drugs a priority for their
funding of research across the UK.
Q69 Chair: The Department receives advice from a
wide range of areas. There are some that are more
formal than others, and NICE is a good example.
Would there be some benefit in having a standing
expert committee on alcohol to advise Government?
Anne Milton: I am a relatively new girl to this; I
know that there have been, but I would never
prescribe a certain structure in order to ensure that the
Department gets advice. Different areas require
different approaches. We are in the process of
producing an alcohol strategy, which is in its early
days. The important thing is a receptive and open
mind. I am a firm believer that Government at any
level should have the humility to understand that they
might not always have got it right and, indeed, they
might need to change its mind. In terms of giving the
public advice and wanting to change their behaviour,
what matters is not only that we have confidence in
the advice that we are giving but that the public has
confidence in the advice they get. That is a terribly
important part of this.
Q70 Graham Stringer: It is a very radical view of
Government that it should be able to change its mind.
Anne Milton: I know. I will probably end up on the
front page of somebody’s headlines tomorrow, but it
is what I think.
Q71 Graham Stringer: It is very welcome, Minister.
As to the Government alcohol guidelines, are they just
for public information, to help people run their lives,
or is their intention to try and change behaviour?
Anne Milton: If you look at the figures, 58% of the
public drink only twice a week or less and 15% of the
public abstain entirely from alcohol. If you look at
alcohol, there is a proportion of the public whose
behaviour we would like to change because the
alcohol they are consuming is causing harm to their
health. There are some members of the public who are
causing themselves no harm. It is both. It is to give
people information. The next step, which is probably
more tricky, is to make sure that information is given
to them in a way that they can understand and accept.
That comes back to the credibility point.
The next step is helping them to change their
behaviour, which is why in the Public Health White
Paper we talk about public health being everybody’s
responsibility, but, at the end of the day, a person has
to make a choice. At the end of the day, an individual
makes a choice about how much or how little they
drink.
Q72 Graham Stringer: Is there any evidence that
the guidelines have changed behaviour at all?
Anne Milton: Behaviour has changed. The difficulty
in a lot of these areas—it is also true of smoking and
obesity—is that it is quite difficult to demonstrate
causality. That is always a difficulty. Smoking is a
good example. If you look at the ban on smoking in
public places, it might have altered behaviour but, at
the same time, there was a great deal of reporting in
the media and a lot of chat shows talking about it.
Many other things were going on at the same time
that we banned smoking in public places. There was
a change in behaviour down to all the discussion in
the media about the downs that smoking can give you,
or was it simply the banning of smoking in public
places? It is quite difficult to demonstrate causality.
All you know is that behaviour did change. There are
very clever people, and Dr Prunty is one of them, who
try and tell me what exactly it was. There are
statistical experiments you can do, research tools at
your disposal, to try and iron out some of those
factors.
Q73 Graham Stringer: It would be helpful to the
Committee if you describe what changes have taken
place in recent years and if any of those changes at
all could be put down to the guidelines.
Anne Milton: Yes. If you look at awareness, 90% of
people understand about units of alcohol now. The age
at which young people start drinking is going up,
which is positive. The amount of alcohol that young
people are drinking is going down slightly. Total
alcohol consumption has gone up. I could go on and
on. I would be happy to send you more figures,
because the picture is quite confusing. The amount of
alcohol that is consumed has gone up, but it is being
drunk by a smaller number of people. For instance,
10% of the population who drink to excess are
drinking 40% of the alcohol. One third of those who
drink to excess are drinking 80% of the alcohol. As a
result, we have a smaller number of people drinking
more. Have the guidelines had an impact? They have
inasmuch as we know that the first step in changing
behaviour is for people to be aware of the harm that
it can cause. I still think that your point is well made.
Whereas people accept the harm that smoking and
being overweight cause, there is still an issue in
people accepting the harm that alcohol causes. That
is a message that we still have not got through with
the guidelines.
Q74 Graham Stringer: There are two kinds of harm,
are there not? There is the harm to health, to the liver
or from initiating cancer, and then the social harms of
violence and accidents. How do you work with the
Home Office to co-ordinate alcohol policy?
Anne Milton: Very closely. As a relative new girl, I
do not know what has happened over the previous 20
or 30 years. I am working extremely closely with the
Home Office. As you rightly say, alcohol causes
physical harm and it also causes a lot of harm to](https://image.slidesharecdn.com/guiasalcoholuk-130415104347-phpapp02/85/Guias-alcohol-uk-66-320.jpg)
![cobber Pack: U PL: COE1 [O] Processed: [03-01-2012 16:31] Job: 015231 Unit: PG02
Source: /MILES/PKU/INPUT/015231/015231_o002_th_S&T 111026 Alcohol Guidelines HC 1536-ii FINAL.xml
Science and Technology Committee: Evidence Ev 19
26 October 2011 Anne Milton MP, Dr Mark Prunty and Chris Heffer
people’s mental health. There is an economic harm to
employers from lost time due to sickness absence.
There are associations, although probably not
causality. There is some interesting new research on
whether it triggers or is a component of violence,
domestic abuse and so on. There is a huge range of
harms. I am working closely with the Home Office
because it is a crime, anti-social behaviour and health
harm issue. It is also an issue not dissociated with
poverty. Working with other Departments, like the
DWP and Justice, is important because the incidence
of alcohol abuse with offenders and ex-offenders is
also relevant. The Home Office is the first port of call.
What is extremely important is that the alcohol
strategy is going to be a cross-Government strategy
and not a Department of Health strategy. It is
important because it will collect together all the
other Departments.
Q75 Pamela Nash: It would not be much of a
surprise to most of the people in this room that the
information we have received states that most of the
population do not have a full understanding of the
guidelines but particularly what constitutes one unit
of alcohol. What does the Government intend to do to
improve the understanding of the population about the
guidelines and risks, particularly through publicly
funded initiatives?
Anne Milton: I will circulate to you some of the
possibilities for increasing awareness. In the Public
Health White Paper we talk about the Nuffield ladder
of interventions, the bottom of which is doing nothing
and the top of which is banning something. We keep
every rung of that ladder of interventions open and
available. We are working with industry to see if we
can get some voluntary agreements. Currently, we
have got some of the industry to sign up to some
voluntary pledges on exactly this issue. One of those
is labelling, which refers to units and points out harms
in pregnancy. That is one thing we can do, and it is
only the start. The Drinkaware campaign—I have
brought a sample which I am happy to leave with the
Committee or you can pass it round—explains some
of them. It is always interesting when, as a Member
of Parliament, you find yourself as a member of the
public getting through your door something that you
heard about in the Department in which you work. I
have another one here, which is the one which came
through my door, and its aim is to raise awareness
about alcohol and the harm it causes.
We know that there is no one magic bullet or one
single factor. The Public Health White Paper talks
about taking a “life course event”. If, for instance, you
want to raise awareness, one of the ways you can do
it is with schoolchildren. Probably, they are
responsible for most of the increase in recycling by
their parents, because they nag their parents. They
learn about climate change in school and they go
home and nag them. Informing children can be quite
useful not just for their own health but they also nag
their parents about it. In relation to teenagers and
young adults and some of the harder to reach groups,
informing could be done through sports clubs and that
sort of thing. We target particular groups, and
pregnant women would be one of them. There is a
variety of things we can do. There is often a slight
tension in whether you target certain groups or you try
and hit everybody. Again, the research basis is mixed
somehow, which is more effective. With some
campaigns it is better to target. I will ask Mark, as the
addiction expert, whether he would like to add
anything.
Dr Prunty: In terms of targeting, we particularly
looked at adults in the 33 to 55 age range, and
particularly those in the lower social classes with
social marketing campaigns in recent years. Work has
been done to assess what the best messages are for
that group. That is a particularly important group
because that group is more willing to listen to
messages. That is also the group that is going to be
experiencing the long-term harms from alcohol. We
have also produced, as the Minister said, information
focusing on those people who wish to reduce their
consumption to low-risk levels to make sure that they
have accurate and scientifically sound evidence, which
is what we provided through the benchmarks and
distributed through Drinkaware, NHS Choices,
Change4Life and other materials to the NHS, so that
practitioners and professionals have the currency in a
credible and meaningful form to be able to discuss the
situation with patients and others. It is hitting those
populations through a range of different routes.
Q76 Pamela Nash: Many of the initiatives you
mentioned are done in partnership with industry. How
much of it is publicly funded? How much public
funding is going to be available over the period of the
spending review for these projects?
Anne Milton: Of course, this is in the light of the
changes that are currently going through Parliament.
If approved, the responsibility for public health will
move to local authorities. Interestingly, local
authorities already do quite a lot of work on the social
harm from alcohol. Crime and anti-social behaviour is
a particular issue in some areas. Many local
authorities do quite a lot, not specifically on health
harm but with that welcome side effect. We have
community alcohol partnerships. Work is going on to
line up people who come drunk into A and E and
informing the police to target hotspots so there are
opportunities for brief interventions. We will be
announcing the allocations that local authorities will
be getting soon. We are doing quite a lot of work to
separate out what is currently spent by PCTs. It is a
matter of what is spent locally and nationally.
Experience would suggest that local campaigns,
generally, work better because the different type of
alcohol consumption patterns vary.
I was at an all-party group yesterday and the Member
of Parliament for Newquay attended. They have a
specific problem that is probably not shared by many
other places. You might do a campaign there in a very
different way—because they have a population that is
staying for a week, getting very drunk and then
passing out again—from the way you would target the
harms caused by alcohol in rural areas, where you
have, maybe, a high degree of poor mental health,
where suicide rates are high and where unemployment
is an issue. The figures we have—I am looking at
Chris Heffer—we can certainly forward to the](https://image.slidesharecdn.com/guiasalcoholuk-130415104347-phpapp02/85/Guias-alcohol-uk-67-320.jpg)
![cobber Pack: U PL: COE1 [E] Processed: [03-01-2012 16:31] Job: 015231 Unit: PG02
Source: /MILES/PKU/INPUT/015231/015231_o002_th_S&T 111026 Alcohol Guidelines HC 1536-ii FINAL.xml
Ev 20 Science and Technology Committee: Evidence
26 October 2011 Anne Milton MP, Dr Mark Prunty and Chris Heffer
Committee, but we are in a changing environment. It
has been quite difficult for us to extract from the
primary care trusts what they are spending on public
health as a whole, let alone what they specifically
spent on alcohol.
Q77 Pamela Nash: Those figures will be helpful.
Anne Milton: Yes. We will give you what we can,
certainly.
Q78 Pamela Nash: You mentioned a few groups that
you were targeting at the moment. Is there any group
of people that is of particular concern to the
Department at the moment in terms of their
understanding of alcohol guidelines for those who are
at risk?
Anne Milton: The Change4Life campaign is a
national campaign, which will be including alcohol.
Many of you might be aware of it. To its credit, you
might not know that it is a Government campaign. If
you did not spot it as a Government campaign, it has
been enormously successful, because Government
campaigns tend not to have the resonance with the
public. 90% of adults say that they have heard of
messaging about alcohol in units and 75% have heard
of drinking units. I do not think there is any specific
group, if I am absolutely honest. I would not say it
and officials should not say it either. You always target
those who are at most risk, so the higher drinkers are
most at risk. At the extreme end of that you have the
alcoholics. It is a matter of making sure that adequate
support and rehabilitation services are available for
people who are alcoholics or addicted to alcohol. That
is why in the Public Health White Paper we talk about
a “life course event”. What you have to do is to punch
into this, as you do with all health programmes, at
every single level.
Q79 Pamela Nash: In your experience, do you think
there are other interventions, such as minimum pricing
or restricting advertising alcohol products or even
their availability, and that targeting them and changing
these might be more successful than promoting the
guidelines?
Anne Milton: They can be. The big mistake is that
each of the interest groups—in the wider sense, the
NGOs, the industry, the Royal Colleges and all the
rest of it—have a pet idea, and we do as individuals.
We tend to believe that what worked for us works for
other people. The danger is that Members of
Parliament, possibly, believe that they have expert
knowledge when we only have anecdotal knowledge.
Am I the target group? No, I am probably not. What
would work for me would not necessarily work for a
16-year-old who is already drinking to harmful levels.
As to pricing, taxation has altered. We have put
additional duty on beer that is over 7.5% alcohol and
reduced the duty on beer that is at 2.8% or below.
Already, there has been a response from the industry.
Already, they are dropping the alcohol strength to get
below that duty level. There is no doubt that price
can manipulate the market. Increasing duty on high-
strength alcohol is not a bad idea because for every
litre sold there is less alcohol in it, which is a move
in the right direction. There is a lot of debate as to
how much elasticity there is on price. In reality,
alcohol has become more expensive, certainly as
regards the on-trade. It has gone up above RPI year
on year. The off-trade, which now sells 65% of
alcohol, has become increasingly cheaper, certainly
since 2001. There is a very big difference between
on-trade and off-trade on prices. We have seen some
behaviour change. That causes its own problems that
I will not go into now. You have all the things that you
can do on pricing. However, the reason why alcohol is
more affordable is more to do with rising incomes
than price itself. The picture is complicated on price.
Other issues are advertising. There are already rules
about advertising, particularly to children. One of the
pledges that has been made collectively by the
industry is about advertising close to schools, which is
an issue. Again, it is important for us as Government
Ministers, and for our officials, to remain open-
minded. Sadly, for me, what seems like a good idea,
when I ask officials to drill into it, is not quite as
simple as that. Members of Parliament and members
of the public write to me with what seem to be
wonderful ideas, but once you look into them they
sort of work but not completely. So open-minded and
multi-faceted approaches are what we have to do. This
Committee’s report will be useful for us to put into
the mix of our evidence, until something emerges that
says, “This is what you have to do.”
Q80 Chair: Can I just take you back to your
observations about your Newquay example? I am not
trying to condemn Newquay.
Anne Milton: No, we would get into a lot of trouble
if we did that.
Chair: You are absolutely right that different patterns
occur because of the natures of different communities
throughout the country. You went on to say—I
paraphrase—that it is difficult to get the hard data
from the PCTs about what they are doing. Would it
not be rather a good idea to gather that data in and
try to identify against the background of the different
community mixes what best practice is and see how
effective different PCTs have been?
Anne Milton: Absolutely. Your point is very well
made. It is easy to find out what they are doing. It is
difficult to find out how much they spend. It is
different.
Chair: I understand.
Anne Milton: Somebody who works for one of the
very big charities asked me recently, “Why do we
continue to do in healthcare what we know doesn’t
work and fail to do what we know does work?” When
you see an example of really good practice, you think,
“Why don’t we transport that into other areas?” It is
quite important to recognise what the barriers are to
spreading best practice, because if it is a good idea,
why don’t we just do it? Some of that is due to local
factors; some of that is due to the fact that we are quite
resistant. Health professionals and local authorities are
slightly resistant to believing what other people tell
us. It is not only the public with whom we have a
problem. Other organisations say, “Just because it
worked in Leeds, Newcastle, Manchester or Cornwall,
it won’t necessarily work here because we are
different.”](https://image.slidesharecdn.com/guiasalcoholuk-130415104347-phpapp02/85/Guias-alcohol-uk-68-320.jpg)
![cobber Pack: U PL: COE1 [O] Processed: [03-01-2012 16:31] Job: 015231 Unit: PG02
Source: /MILES/PKU/INPUT/015231/015231_o002_th_S&T 111026 Alcohol Guidelines HC 1536-ii FINAL.xml
Science and Technology Committee: Evidence Ev 21
26 October 2011 Anne Milton MP, Dr Mark Prunty and Chris Heffer
One of the planks behind Public Health England is to
better inform local areas about how they might
address some of these big public health challenges
that we face, gather that formal body of evidence and
make sure that we disseminate right on to the ground
what has been demonstrated to work in practice, what
the research is currently showing and make sure that
we see some of those things at work.
Q81 Roger Williams: There is a group of people
who are interested in this subject who believe that
the Government should be more sceptical about the
commitment of the industry to responsible drinking.
Included in that group was the Health Select
Committee’s 2009 report on Alcohol, which said that
the Government should be more sceptical about the
industry’s claim that it is in favour of responsible
drinking. Was this taken into account when
developing the “Public Health Responsibility Deal”,
which was published in March 2011?
Anne Milton: I am sceptical about everybody.
Everyone, including the industry, comes to a
discussion with their own agenda. It is important
always to have a degree of cynicism without it getting
in the way and to judge things on what you see. You
are right about the Health Select Committee’s 2009
report. The previous Government responded to that in
March 2010. The Responsibility Deal is one positive
move that we have been able to make. We have to
judge it on the results that we see. In 2013—Chris
Heffer will correct me if I am wrong—we will be
having an independent analysis as to how much
progress has been made. On the ladder of
interventions, one rung is voluntary arrangements—
there are all sorts of things—and I am happy to send
the Committee a paper just to explain that piece of the
White Paper, if it would be helpful. That ladder of
interventions is out there. Indeed, on price we have
already regulated and legislated inasmuch as we put
up the price on stronger beers and lagers.
I have an appropriate degree of cynicism, but the
world has changed slightly. Two or three years ago,
probably around the time that the Health Select
Committee did their report, the stories of drunken
behaviour in our town centres at night were truly
dreadful. The images and pictures, many of which
were from Guildford, which is my constituency and
has a large night-time economy—which was useful
for the press because it is close to London—kept
being repeated. There is a bit of a line inasmuch as
the drinks industry are interested in their brands, so,
if a brand is associated with crime, anti-social
behaviour and people being paralytically drunk, it is
not necessarily a positive brand. However, they are
there to sell alcohol. We have to work in those areas
that we can, make sure it is properly scrutinised and
analysed so that we have confidence, and be aware of
the fact that there are legislative and regulatory tools
which we can take into account. One of them, going
back to the Home Office, is licensing, so health bodies
acting as a responsible authority when it comes to
licensing applications would be one approach.
Q82 Roger Williams: Of course, the Government
themselves are in a difficult position—not you,
Minister, I am sure—because they receive so much
tax from the sale of alcohol. What involvement do
you have with the Treasury on those issues?
Anne Milton: Smoking is the big one. I do not have
the figures in front of me. The tax revenue from
smoking is significant and probably far greater than
the cost to the health service in dealing with smoking-
related harm. To be completely pure, it would be
entirely improper if the Department at any time was
persuaded by an argument on revenue and avoided
doing what it should do on public health. We are pure
as the driven snow on that, Mr Williams. There is no
interference. The public health messaging is quite
clear.
This may be a good opportunity to mention the fact
that the Prime Minister has set up a Public Health
Cabinet Sub-Committee in which all the Departments,
including the Treasury, have a seat. I have not yet
heard them say that they want more revenue from
alcohol, so could we persuade people to drink more.
The point you make is important. That committee is
an opportunity to bring everybody together to make
sure that we are addressing this on all fronts and that
our messages are clear, pure and without interference
from vested interests.
Q83 Roger Williams: I am glad you were able to put
that point on the record. I understand the point you
make about the drinks industry wanting to have a
good and positive brand. Yet it was the 2009 report
which said that, if everybody who drank drank
responsibly, that would lead to a reduction of 40%
of all alcohol that was sold. I still find it difficult to
understand what the impetus is for the industry to be
so anxious to promote responsible drinking.
Anne Milton: Brand is one of them. One of them is
the pressure that the Government are putting on them,
and they do not want to have to pay the duty on
alcohol. What is quite interesting is if you put into
that mix the trends that we are seeing. Young people
are drinking less and they are older when they start
drinking. There are things that the industry can do that
means they continue to sell their product without it
causing harm to people. If I may remind you of the
figures, one third of the people who drink to excess
are drinking 80% of the alcohol. As to the strength of
alcohol, the average bottle of wine in the 1970s was
9%. It is now 12.5%. We have seen a market emerge
where the amount of alcohol in any one bottle is much
greater. Reducing the level of alcohol probably does
no harm to their sales but reduces the harm to
people’s health.
Q84 Roger Williams: Do the Government have any
plans to introduce regulations to make businesses
provide information through labelling at the point of
sale?
Anne Milton: I do not know if these have been
forwarded to the Committee, Chairman, but it might
be quite useful for you to have. I am happy to make
sure that that happens. One of the pledges in the
Responsibility Deal is on labelling.. The companies
that have signed up have said that 80% of alcohol
products will have clear labelling, including warnings](https://image.slidesharecdn.com/guiasalcoholuk-130415104347-phpapp02/85/Guias-alcohol-uk-69-320.jpg)
![cobber Pack: U PL: COE1 [E] Processed: [03-01-2012 16:31] Job: 015231 Unit: PG02
Source: /MILES/PKU/INPUT/015231/015231_o002_th_S&T 111026 Alcohol Guidelines HC 1536-ii FINAL.xml
Ev 22 Science and Technology Committee: Evidence
26 October 2011 Anne Milton MP, Dr Mark Prunty and Chris Heffer
about pregnancy, units and the guidelines by, I think,
2013. It is a start.
Q85 Chair: Are there any companies that are not
prepared to sign up to that deal?
Anne Milton: I am sure that there are but not many.
Chris Heffer: There are not many major companies.
About 100 companies cover about 80% of the
industry. Most of the major companies are doing so.
If I may speak for them briefly—the advantage to
them is that they are doing this voluntarily—some of
their brands do not have to comply. If you are bringing
in a special product from America for the whole of
Europe, they can exclude that brand while offering a
choice of products to consumers across the rest of
Europe. A mandatory approach would mean that that
brand was probably not stocked. Most of the brands
have signed up for most of their products. That should
add up to 80%. There will be an independent verifier
by December 2013. When you walk into a
supermarket and examine the bottles, 80% of their
bottles should have those three elements that the
Minister mentioned.
Anne Milton: Just as an aside, individual companies
sign up to different pledges. ASDA have said that they
will take out displays in the foyers of their shops.
Nothing is an end in itself. Until we reduce the deaths
of 15,000 a year from alcohol, we will not be satisfied.
Q86 Roger Williams: Have you any idea of how
close to achieving that target of 80% you are at the
moment?
Anne Milton: We have just started this process. You
are probably as impatient as me. Since we have only
been in Government for 15 months, I do see why that
should be an excuse not to have done everything we
want to do. I am terribly impatient. It would be unfair
to measure progress now because different people are
in different places on some other public health issues.
We have moved a tremendous way. Some of it is about
how difficult it is for the industry to get it in place.
As you will know, and there is no point in shying
away from it, there has been a lot of concern about
the Public Health Responsibility Deal, unfairly, in
some ways. The proof of the pudding will be in that
independent assessment in 2013.
Q87 Stephen Metcalfe: The current alcohol
guidelines broadly distinguish between gender, age
groups, pregnant and non-pregnant women, but there
are other categories that could be considered as well.
How do you determine the appropriate level of
complexity? How many different sub-groups should
there be?
Anne Milton: Absolutely, quite. Not only is the
pattern of alcohol drinking complicated but the harms
that it causes are complex. Different groups suffer
different degrees of harm. It is an outstandingly
complex picture. If you contrast that with smoking,
the message is quite clear: don’t smoke. 80% of
people die every year from smoking. It is not quite as
simple with alcohol. You need the message to give
information to different groups of people who have
varying abilities to absorb that information and you
need to align it so that it alters their behaviour. We
want to give them the information in a format that
they can understand, in a place where they will read
it and in a way that is meaningful to them, that does
not give them the opportunity to deny that it is
relevant to them but produces a change in their
behaviour. It has to have their confidence as well.
These are Government messages. One of the
difficulties for Government these days—it has become
an increasing problem—is that, just because the
Government tell you to do it, nobody necessarily
believes it. There was a time when we were more
inclined to do what the Government told us to do.
Now I think we are less inclined to. It is really the
power of campaigns like Change4Life because it does
not look and feel like a Government campaign. It is a
recognisable brand and it is trusted. All the market
research that has been done on Change4Life
demonstrates that people trust that messaging. Then
you get into the different types of media.
Take television. If you wanted to reach the average 13
to 15-year-old, I would suggest that today television
is not your answer because they do not watch it any
more. The 10-year-old age group does watch
television. There are all the social media differences.
I do not know if Chris or Mark want to add anything.
Dr Prunty: The key issue is that the core messages
follow the evidence. You can say certain things with
a level of clarity and specificity which are supported
by the evidence and other things that require a more
narrative approach. There is a huge variation between
individuals around the effect of even drinking at
average levels, but there is a very strong evidence
base around, for example, the benchmarks of 2 to 3
units or 3 to 4 units, that allows you to state with a
great deal of confidence that, if you drink at those
levels, as an adult, it is a low risk. There is an
evidence base around pregnancy and the risk to the
foetus, which is not as strong, but there are good
systematic reviews that help us to give a very clear
and concise message on levels of consumption. There
is also softer information about the frequency of
drinking, drink-free days, weekly and daily
consumption. There are differences between gender,
body size and other problems that require a different
approach to reflect the complexity but are still able to
inform the public who are interested in minimising
their risks.
It is about disentangling those and not trying to throw
them altogether so that actually no message is
received. For the various groups for which the
evidence would be less strong, you cannot give a
single message. Older people may be an example of
that. It is about trying to look at the core evidence for
a particular group and trying to understand what is
best presented in a particular format, such as a
benchmark, and what is best presented as helpful
narrative in a range of different media.
Anne Milton: Then there is the growing evidence
base about social norms. In the US they put up posters
saying how much students drank, which was a lot
lower than most people thought. There is definitely
something about people drinking because they think
that is what most people are doing. All of that puts
the message across in quite an oblique way.](https://image.slidesharecdn.com/guiasalcoholuk-130415104347-phpapp02/85/Guias-alcohol-uk-70-320.jpg)
![cobber Pack: U PL: COE1 [O] Processed: [03-01-2012 16:31] Job: 015231 Unit: PG02
Source: /MILES/PKU/INPUT/015231/015231_o002_th_S&T 111026 Alcohol Guidelines HC 1536-ii FINAL.xml
Science and Technology Committee: Evidence Ev 23
26 October 2011 Anne Milton MP, Dr Mark Prunty and Chris Heffer
Q88 Stephen Metcalfe: One of the interesting things
you said at the beginning was that you do not want to
make the guidelines either so complex or that people
can deny they apply to them. Is the group who you
said drink up to 80% of the alcohol particularly prone
to denying that the guidelines apply to them, and are
they a particular type of group of people?
Anne Milton: Yes. This is quite interesting. Dr Prunty
is an addiction psychiatrist; so he will speak with far
more knowledge and give you a far more informed
opinion than I can simply as a Minister. But you are
hitting on quite an important point, which is that
people do things that they know harm their health.
22% of people still smoke, even though the evidence
demonstrates that people are very aware of the harm
it is doing to them, but still they continue to do it. On
all matters concerning public health, we have to take
one step away from the particular issue we are dealing
with and ask why these people are doing it in the first
place. In relation to the 10% who are drinking to
excess, who are drinking 40% of the alcohol, we have
to look at why it is that people feel a need to get very
drunk and harm their health.
There is a wider issue about people’s mental health
and wellbeing. There is a genuine issue—I am sure
the Committee does not want to go into this today—
and we must be open- minded about this, as to why it
is necessary for young people to go out regularly and
frequently and get very drunk. If you talk to those on
street pastors projects, as I have done, street angels or
whatever you want to call them, they will say that our
town centres, where people drink a lot, are full of very
sad young people. There is another issue to address,
which is: who is doing this?
Q89 Stephen Metcalfe: Does that lead you toward
almost personalised or tailored drinking advice for
different groups of people? As you said, how do you
get that advice to them? I am talking about middle-
aged men who are heavy drinkers because they always
have been or young people who are drinking to
excess. How do you get them to think, “It doesn’t
affect me at the moment because I’m so young. I’ll
deal with that later.” It is getting that detail across
about what the real harm is.
Anne Milton: That is right. That is why localising
public health, embedding it within local authorities, is
so incredibly powerful. It is important because it is
about what the public believe the Government are
doing for them. There is no doubt that most people
drink at low risk levels. It would be unwise and
inappropriate for the Government to demonise people
who are not doing anything wrong. Targeting
becomes important.
I know that Mark Prunty mentioned the value and
impact of brief interventions with some of that group
who might be the people with whom the police have
contact. Community Alcohol Partnerships are
important for that. It might be the people who are
known to the local licence trade. The opportunity for
brief interventions can be very powerful as it is very
targeted.
Q90 Stephen Metcalfe: From what you are saying,
you are talking about those right at the extremes as
opposed to those who may not even realise that they
have a problem. Do the Government need to put more
resource into helping people who probably do not see
themselves as problem drinkers but understand that
they may be doing themselves more harm than they
believe, through tailored advice, not so much
intervention, because some people may not be having
any contact with someone who can tell them that they
are drinking too much?
Anne Milton: I am going to ask Dr Prunty to answer
the question on how you get people to accept that
what they are doing causes harm, because that is a
question for a psychiatrist.
Dr Prunty: That’s for a Nobel Prize. I take the point
you are making. There is a group of heavy drinkers
who are at very high risk of harm, and there are those
who are drinking either above the recommended
levels or substantially above the recommended levels.
Both of those groups, as compared with the general
population, are much less willing to accept at face
value that the claims about health are not
exaggerated—44% of those drinking above the lower
risk guidelines would think that the claims are
exaggerated. It is only about 15% of the higher risk
drinkers who are at particular risk of harm who wish
to change their behaviour at this time, whereas 87%
of the general public think that, probably, it is sensible
for your health to stay within guidelines. There has to
be a range of different mechanisms. Where you can
interface with professionals who have skills and can
recognise that you may be drinking at certain levels
that may harm you, then there is an evidence base
which we have been promoting and materials we have
produced for identification, brief advice and giving the
right advice in those circumstances.
Also, the Department has produced toolkits for local
areas to look at how to identify the needs of your
particular population in those high risk groups and use
social marketing techniques to deliver to your
population the range of different factors that affect
their drinking, whether it is unemployment, social
status or other factors. The focus has been about
developing the support and skills so that those people,
either through public campaigns locally or where they
interface with systems that give advice, know that the
knowledge and skills about how to do that is
available. There is quite a substantial body of
materials.
Chair: Colleagues, we have four more very important
questions that we need to get through in a fairly tight
time scale.
Q91 Graham Stringer: You have answered a
number of questions that I was going to ask. I have
two or three follow-up questions. In terms of the target
groups that we were talking about, do you agree with
your colleague that we should be one of the target
groups as to how we deal with alcohol? Do you think
that some of our bars should be closed earlier and
some of the bars closed down completely, as one of
your colleagues suggested?
Anne Milton: Perhaps I could answer that question as
a Member of Parliament rather than as a Health
Minister. I do not like the word “should”. Members of
Parliament or people who work in jobs similar to the](https://image.slidesharecdn.com/guiasalcoholuk-130415104347-phpapp02/85/Guias-alcohol-uk-71-320.jpg)
![cobber Pack: U PL: COE1 [E] Processed: [03-01-2012 16:31] Job: 015231 Unit: PG02
Source: /MILES/PKU/INPUT/015231/015231_o002_th_S&T 111026 Alcohol Guidelines HC 1536-ii FINAL.xml
Ev 24 Science and Technology Committee: Evidence
26 October 2011 Anne Milton MP, Dr Mark Prunty and Chris Heffer
one that we do, which have fairly anti-social hours,
are often working at a distance from their family and
are susceptible to certain sorts of risky behaviour.
Drinking and poor mental health are, without doubt,
two of them. Interestingly, one of the Responsibility
Deal networks that we have is on health in the
workplace. It is about employers looking after the
health of their work force better. We do not have an
employer. Our constituents are our employers, I
suppose, if anybody is. We probably do not do
enough. I know that the Occupational Health
Department of the House has tried to do more about
Members of Parliament looking after themselves.
There are a few notable people who have
demonstrated wonderful stories of weight loss. One
was in the papers this weekend.
It would be quite interesting, Chairman, if this
Committee did a research project to see how much
Members of Parliament knew about the guidelines on
alcohol and whether they felt they exceeded their
daily and weekly limits, and in practice how much
alcohol was consumed on the parliamentary estate. I
am sure the Daily Mail would love it.
Q92 Graham Stringer: It might be interesting
getting a vote on it. You also talked about changing
behaviour by price mechanism and alcohol strength.
When I have dealt with problems of alcohol as a
constituency MP, all the professionals say to me is
that nobody other than people with alcohol problems
buys the extra strength ciders from supermarkets,
White Lightning, for instance, and yet the last
Government and this Government have resisted
increasing the duty on that kind of alcohol. Do you
not think you could improve people’s health by
changing those duty limits on strong cider?
Anne Milton: We have done it and we are having an
on-going discussion with the Treasury. We have seen
an additional duty on stronger beer. It is quite
encouraging to see the industry responding by
dropping the strength of some of their beers to fall
under that threshold. It would be something that we
would have to keep under review if the industry was
chasing our tails on it. Also, lowering the duty on the
lowest alcoholic drinks is important because, as we
must not forget, the majority of people drink safely.
There is always this tension of penalising the majority
for the behaviour of a minority.
Let me say a word on pricing. Minimum unit pricing
is an expression not used by this Committee but used
slightly carelessly sometimes by others. Our advice is
that that in itself is probably illegal as it contravenes
European free trade legislation. I know that Scotland
is thinking about introducing it. They will be
challenged and that will clarify the law. Our advice is
that that is illegal. We have to be very careful about
penalising the majority because of the minority. We
have said that we will increase the duty by 2% over
RPI during the lifetime of this Parliament, so duty will
go up across the board. Again, I draw your attention
to the difference between the on and the off-trade. We
will set out our plans in the Alcohol Strategy, which
will either be this year or early next year, which will
say more about what we are going to do on price. As
Mr Metcalfe was saying, targeting is quite an
important point. You have to look at the patterns of
drinking that are going on, which would suggest that
it is not as simple as one would assume and there is
debatable evidence about the amount of price
elasticity there is.
Q93 Graham Stringer: We had medics before us
last week. There was clearly a disagreement between
them about whether the advice should be weekly or
daily. The Royal College of Physicians thought that
giving advice on a daily limit sent out the wrong
signals saying that it was okay to drink daily, when
repetitive drinking without a rest in between was
dangerous. What is your view about that?
Anne Milton: I am going to sound repetitive. My
view about that is that we should keep an open mind
on that because, as Mark Prunty described, this is a
complex picture. There are unintended consequences.
There are dangers, if you give people a daily
allowance, because they think it is something they can
save up for the weekend. Understanding human
behaviour is a critical part of how we do that. We
need different messages for different groups of people.
I would say we should have no hard and fast rules.
Local measures will be very effective. When going
back to some of the areas that have a large tourist
trade, where a lot of people go for hen nights or stag
nights—Blackpool, I know, has that—you may be
putting out different messages in towns like that than
you would do for schoolchildren. Mark, do you want
to add to this?
Dr Prunty: With regard to the daily guidance, the
levels, the benchmarks, that have most recently been
planned in Canada and previously in Australia, the
evidence base for the risk is based on regular daily
consumption and that level is low risk for these range
of harms. That also needs to be placed in the context
that the vast majority of people do not drink daily and
have drink-free days. The core evidence around which
the harm and science is most robust is about daily
consumption. In a sense, we need to make sure that
that message is credible. It can be described in weekly
terms, but there is a concern about saving up.
Previously, there was also a concern about
encouraging twice a week drinking in that you may
interfere with some of the potential beneficial effects.
The 1995 report made it very clear that there was a
range of reasons why the shift went from weekly to
daily.
Q94 Stephen Mosley: It is on those potential
beneficial effects that I want to push you a bit more.
The 1995 “Sensible Drinking” report did conclude
that the “moderate consumption of alcohol confers a
protective effect against a number of series diseases,
including coronary heart disease”, stroke, gallstones
and so on. They highlighted a number of benefits. Do
the Government still believe that there are any health
benefits from drinking alcohol in low quantities?
Anne Milton: I am saying this with extraordinary
caution because anything that is said in this report
needs to be placed in the context of the extensive harm
that alcohol can cause. There is, possibly, evidence to
suggest that it remains true for older adults. However,
a number of experts and research books recently have](https://image.slidesharecdn.com/guiasalcoholuk-130415104347-phpapp02/85/Guias-alcohol-uk-72-320.jpg)
![cobber Pack: U PL: COE1 [O] Processed: [03-01-2012 16:31] Job: 015231 Unit: PG02
Source: /MILES/PKU/INPUT/015231/015231_o002_th_S&T 111026 Alcohol Guidelines HC 1536-ii FINAL.xml
Science and Technology Committee: Evidence Ev 25
26 October 2011 Anne Milton MP, Dr Mark Prunty and Chris Heffer
raised some questions about the robustness of that
body of evidence. The Government need to talk about
the harm that alcohol causes us. There are plenty of
people who will rush to the belief that alcohol is going
to provide them with some health benefits, while
resisting the rush to the fact that alcohol causes some
harm. It is important that all we do in public health is
based on the best evidence available, because it is
only if backed-up by scientific fact that the
Government’s messages remain credible. That
credibility is terribly important. We have to tell the
truth, which is difficult in a complex area like this,
and where there is questionable evidence in this
instance about any possible health benefits.
Q95 Stephen Mosley: We noted at our last meeting
on 12 October there was a degree of disagreement
about the so-called benefits. One of the witnesses said
that the cardiovascular benefit was overplayed. You
were talking about the evidence changing. How much
has the evidence changed since that “Sensible
Drinking” report was published and are there any
plans to look at it again?
Anne Milton: Do you mean the 1995 report?
Stephen Mosley: Yes.
Anne Milton: It has remained good for a long time.
We constantly look at it. As I said at the beginning,
what is important for the Department, as it is
important for Public Health England, is to remain
open-minded and receptive to any evidence. We must
also remain perceptive to challenge. If somebody
comes along and says that there is research that we
have not heard of that will demonstrate that we are
wrong, then we should look at it again. Maybe you
want to come in on this, Mark.
Dr Prunty: I saw the transcript of that discussion.
There was one issue about the scale of the evidence
supporting the benefits. It is true that the number of
studies has increased and multiplied. There have been
major reviews which have looked at the methodology
underpinning those studies and questioned their
robustness. The evidence has been accumulating in
that direction. In terms of reviewing that further, the
major well-controlled studies are out there, and there
have been various reviews of that. There is still
evidence of the health benefits, particularly for
coronary heart disease, but it is certainly true that the
concerns about how robust the methodology is and
whether there are other confounding factors has
strengthened considerably, particularly in the last five
to 10 years. There has also been increasing consensus
that many of those benefits are likely to be achieved
by other methods as well, such as diet and exercise.
Certainly, the British Heart Foundation has come to
the conclusion that equal or greater benefit may be
accrued by diet and exercise, to which the 1995 report
did refer.
Q96 Stephen Mosley: From a public health
perspective, you strongly believe that you should
concentrate on the problems that alcohol can create
rather than any other potential benefits from the public
health perspective.
Anne Milton: If there is absolutely clear and
unarguable advice that there were health benefits to
drinking, the Government should tell the truth. That
is what the Government should do. The message to
get across the harm alcohol causes is far more difficult
than the belief that alcohol might cause you some
benefit.
Q97 Pamela Nash: Following on from Stephen’s
question, since the 1995 report, has there been any
additional and stronger evidence on the particular
effects of alcohol consumption on women?
Anne Milton: Women do have greater risks of long-
term health harms when drinking at similar levels to
men above the lower risk levels. Women have been
catching up, which is of concern. Patterns of drinking
in young women have, without a doubt, changed. But,
still, women drink much less than men on average and
suffer far fewer health problems. I do not think that
we could point to one particular bit of evidence. That
is where we have ended up. Probably, there has been
a concentration on the harms for pregnant women, in
particular, and NICE produced guidelines in 2007.
Mark, do you want to say something?
Dr Prunty: It is clear that the protective effects are
less apparent in women. They have a lower risk of
coronary heart disease, which is the main disease that
we are talking about. We also have evidence that
alcohol contributes causatively to breast cancer, which
is an issue with low levels of consumption. Women
are at risk of coronary heart disease at a lower level
but for a shorter period of time, because they tend
only to be at risk post-menopause of developing these
problems. If anything, the evidence has become
somewhat clearer that the protective effects apply
more clearly to men than to women. Let me put it
that way.
Q98 Pamela Nash: The Scottish Chief Medical
Officer’s advice to pregnant women is that no alcohol
is safe at any time during pregnancy and there is no
safe limit. Could you explain why that differs slightly
from the advice given in England? Do you think that
the mixed messages on alcohol guidelines for women
who are pregnant are causing confusion among the
public?
Anne Milton: It is terribly important for all those in
the health sector, politicians and Chief Medical
Officers to try and get the messages on line. In an area
which has complicated messages, where the public are
resistant to take them up, then clarity is absolutely
critical. There is no doubt about it that pregnant
women or those who are trying to conceive should
avoid drinking. If women choose to drink, they should
not drink more than one or two units of alcohol once
or twice a week and should not get drunk. Our Chief
Medical Officer will reiterate that. I cannot answer for
the Chief Medical Officer for Scotland. You will have
to ask him yourself.
Q99 Pamela Nash: What effect do you think mixed
messages to the public are having?
Anne Milton: Both sets of advice are based on the
underlying message that women who are pregnant or
trying to conceive should avoid alcohol and not get
drunk. As I say, the Chief Medical Officer for
Scotland is answerable for his own advice. I cannot](https://image.slidesharecdn.com/guiasalcoholuk-130415104347-phpapp02/85/Guias-alcohol-uk-73-320.jpg)
![cobber Pack: U PL: COE1 [E] Processed: [03-01-2012 16:31] Job: 015231 Unit: PG02
Source: /MILES/PKU/INPUT/015231/015231_o002_th_S&T 111026 Alcohol Guidelines HC 1536-ii FINAL.xml
Ev 26 Science and Technology Committee: Evidence
26 October 2011 Anne Milton MP, Dr Mark Prunty and Chris Heffer
answer for him. I do not want mixed messages out
there. I hope that Ian Gilmore will read the transcript
of this evidence session and feel that the Government
are taking good and scientific advice on all that they
do, but people persist in beliefs and they will persist
in saying things in their own way. The Chief Medical
Officer for Scotland can do what the Chief Medical
Officer for Scotland is allowed to do.
Pamela Nash: I will take that back.
Q100 Stephen Metcalfe: We heard from some of our
previous witnesses that they did not want to see the
recommended guidelines increased. Do you believe
that they should be decreased in the light of the more
recent evidence that has come through, particularly
linking drinking alcohol with cancer? If you were to
go through that process of reviewing the guidance,
what would that process be? Would it only be based—
I appreciate there is a lot in this question—on the
scientific evidence or would voter attitudes have an
input into that as well?
Anne Milton: The Alcohol Strategy is going to
involve us in looking at everything we do with regard
to alcohol. That is a cross-Government strategy. If the
Government produce a guideline, we have to
demonstrate on what evidence that is based. If that
guideline differed from what the evidence backed up,
that would be clear, and we would then have to answer
for why we had given advice that conflicted with the
scientific evidence. We are in the process at the
moment of looking at everything around alcohol. I do
not believe that there is currently any evidence
available that would suggest that we ought to alter
those guidelines.
There are two issues. There is scientific evidence
about what is low risk, but one must not forget that in
anything that concerns risk there is a sliding scale.
There is not a point at which your risk suddenly alters.
It differs from person to person, age group and so on.
Also, we have to be clear that a complex message is
got across clearly. Altering guidelines can cause
problems in terms of getting across messages. I do not
know whether you want to add anything, Chris?
Chris Heffer: You made a point about voters’
preferences. If I can be slightly civil servicey, we
always talk of people rather than voters. We are not
allowed to give the Minister anything that is political
in that perspective.
Anne Milton: That is an important point to make.
Chris Heffer: Given that we are in 2011, one could
see merit in engaging the public in some of this
approach, whether that is understanding some of the
terminology used or what is their appreciation of risk.
Two or three years ago, we changed phrases like
“lower increase in risk”, given feedback on that. I
think you have talked about labelling units and
simplicity at times as well. If there is to be a message
on a bottle, it would be helpful if that was part of the
consideration rather than leaving a fairly long list of
things to communicate, which is tricky to do in a
small space. If you are going to do a marketing
message and have some evidence, expertise and
engagement on what that might be, it would seem
helpful if you are going to do that; otherwise, as the
Minister said, the scientific principles would be on the
same basis to start with.
Dr Prunty: A small technical point, which the
Canadians are looking at too, is that the 1995
benchmarks are based on ‘all-cause’ mortality. The
unknown causes of mortality will already have been
incorporated in assessing the risk for that guideline.
You learn more about it, but the risk of death from
breast cancer, for example, which we did not know
about or were not sure about, will already have been
picked up in estimates of ‘all-cause’ mortality, which
is the main factor that drives setting the benchmark,
alongside the fact, which is the issue Chris has raised,
that no single condition below those levels has a very
substantial risk. It is those two things together that
reinforces low risk.
Anne Milton: Maybe the challenge for the week is
whether we can get this through to Members of
Parliament.
Q101 Chair: On that point, Minister, Dr Prunty and
Mr Heffer, I thank you for your attendance.
Anne Milton: It is our pleasure.
Q102 Chair: We would be grateful if you can leave
your graphics and the other documents that you
promised us.
Anne Milton: Certainly, and, if there is anything else
that the Committee wants, we are very happy to
supply it.
Chair: Thank you for a frank exchange this morning.](https://image.slidesharecdn.com/guiasalcoholuk-130415104347-phpapp02/85/Guias-alcohol-uk-74-320.jpg)
![cobber Pack: U PL: CWE1 [SO] Processed: [03-01-2012 16:31] Job: 015231 Unit: PG03
Science and Technology Committee: Evidence Ev 27
Written evidence
Written evidence submitted by the Department of Health (AG 00)
The Evidence Base for Alcohol Guidelines
What evidence are Government’s guidelines on alcohol intake based on, and how regularly is the evidence
base reviewed?
1. The Government’s lower risk drinking guidelines were published in the December 1995 report of an Inter-
Departmental Working Group, “Sensible Drinking”. The authors of the 1995 report drew upon a wide range
of research, including epidemiological evidence, and written and oral advice of experts, as set out in the report.
The report considers the harmful effects of alcohol consumption to both health and mortality and considers the
evidence for its potential benefits. Sources of evidence included relevant reports of the various Royal
Colleges.1
2. The 1995 report carefully described the scientific basis for its recommendations, which included review
by the authors of the major published research evidence, review of written evidence submitted by a wide range
of contributors, independent assessment and critique of the medical and scientific evidence by an external
academic statistician, and receipt of oral evidence by invited key experts. The Government continues to monitor
the emergence of any major new evidence on risks relating to alcohol consumption, to ensure its guidance
remains consistent with current scientific knowledge.
3. In summary, the Government’s lower risk drinking message for the general public on consumption, that
was based on the analysis in the 1995 report, is as follows:
— men should not regularly drink more than three to four units a day;
— women should not regularly drink more than two to three units a day; and
— after an episode of heavy drinking, it is advisable to refrain from drinking for 48 hours to allow
tissues to recover.
4. The report authors makes clear that they see value in setting population benchmarks to enable people to
monitor their own drinking levels but also highlight the importance of appreciating that there will be variation
in the impact of the amount of alcohol consumed on different individuals (eg with different body weights).
The authors also warn against suggesting a rigid “critical” limit, which they considered would not reflect the
scientific evidence.
5. The 1995 Inter-Departmental Working Group included representatives of the then Scottish Office, the
Welsh Office, and the Northern Ireland Office. The report was agreed across Government and the Sensible
Drinking Message has since been used by administrations across the United Kingdom.
6. The 1995 report included advice on alcohol and pregnancy. This was revised in 2006, when the UK Chief
Medical Officers published revised guidelines, taking into account a report commissioned by the Department
of Health.2
In England, this was followed by guidance for practitioners from the National Institute for Health
and Clinical Excellence (NICE) in 2007. The UK Chief Medical Officers advised that:
— pregnant women or women trying to conceive should avoid drinking alcohol; if they do choose to
drink, to minimise the risk to the baby, they should not drink more than one to two units of alcohol
once or twice a week and should not get drunk; and
— NICE additionally advised that the risks of miscarriage in the first three months of pregnancy mean
that it is particularly important for a woman not to drink alcohol at all during that period.
7. The Scottish Chief Medical Officer’s current advice on alcohol and pregnancy is that there is no “safe”
time for drinking alcohol during pregnancy and there is no “safe” amount. This advice can be found at
www.drinksmarter.org.
8. The 1995 report considered only very briefly the issue of alcohol consumption by children and young
people, noting that recommendations for adults are not appropriate for people aged under 16.
9. In December 2009, the Chief Medical Officer for England published specific guidance on the consumption
of alcohol by children and young people. The report provides a comprehensive review of the scientific evidence
on the links between alcohol-related harm and children and young people. It details key studies from an
epidemiological review of the harms associated with adolescent alcohol consumption upon which the guidance
1
Royal College of General Practitioners (1987) Alcohol: a balanced view; The Royal College of Psychiatrists (1986) Alcohol:
our favourite drug; Royal College of Physicians (1987) A Great and Growing Evil: the medical consequences of alcohol abuse.
The reports of all three Royal Colleges endorsed the 1987 Health Education Council line on sensible drinking. The Health
Education Council report (described in Annex E of the 1995 report of an Inter-Departmental Working Group, “Sensible
Drinking”) used "units" for the first time, a concept developed in clinical practice. The “sensible limit”—described as the amount
to which people should limit their drinking if they wanted to avoid damaging their health—was set at that time as 21 units a
week for men and 14 for women.
2
Gray, R. and Henderson J. Report to the Department of Health: Review of the fetal effects of prenatal alcohol exposure. May,
2006](https://image.slidesharecdn.com/guiasalcoholuk-130415104347-phpapp02/85/Guias-alcohol-uk-75-320.jpg)
![cobber Pack: U PL: CWE1 [E] Processed: [03-01-2012 16:31] Job: 015231 Unit: PG03
Ev 28 Science and Technology Committee: Evidence
is based. It also draws on findings from a review of the associations between alcohol use and teenage pregnancy
and consultation with the public, including parents and young people. The new advice was that:
— An alcohol-free childhood is the healthiest and best option.
— If children do drink alcohol, they should not do so until at least 15 years old.
— If 15 to 17 year olds drink alcohol, it should be rarely, and never more than once a week. They
should always be supervised by a parent or carer.
— If 15 to 17 year olds drink alcohol, they should never exceed the recommended adult daily limits
(3–4 units of alcohol for men and 2–3 units for women).
10. The evidence base behind the Government’s lower risk drinking message for the general public has not
been the subject of formal review since 1995. The Department of Health’s officials monitor the evidence base
and seek additional, independent advice on the developing evidence on health risks linked to alcohol
consumption, when required. Such advice was sought, for example, during development of the Department’s
2008 “Know Your Limits” campaign. This included seeking an external expert summary of the relative risks of
developing the wide range of key alcohol-related harms, at different levels of consumption, based on the
extensive published epidemiological research evidence. This ensured our advice to the public on risks provided
in the campaign was up-to-date and reflected the progressive increase in risk of harm seen in those drinking
above the recommended lower risk limits.
Could the evidence base and sources of scientific advice to Government on alcohol be improved?
11. The 1995 report “Sensible Drinking” noted a number of areas of uncertainty in the evidence base. It
noted a general point of an insufficiency of UK studies to be able to base recommendations for the UK
population on these alone. While this remains the case, the 2009 analysis for the Australian Government’s
guidelines on alcohol noted that the US and the UK were the main sources of relevant epidemiological research
worldwide. In addition, the increased range of suitable studies worldwide since 1995 linking risk and
consumption has filled a number of specific gaps in our knowledge and given us greater confidence in some
areas.
12. The Government seeks scientific advice from a wide range of sources including academic institutions,
national and international independent experts, and organisations such as the National Institute for Health and
Clinical Excellence, and relevant Royal Colleges. We used a number of such sources for the 2006 revised
guidelines on alcohol and pregnancy, for the 2008 Know Your Limits campaign, and for development of the
2009 guidance on alcohol and children and young people.
13. The 1995 report “Sensible Drinking” reviewed harmful and beneficial effects due to alcohol consumption
for a range of conditions. Its guidance on levels of regular consumption was based primarily on an aggregation
of what was then understood for health conditions that may be acquired, or avoided, over a long term—often
known as “lifestyle-related” conditions. The report also discussed the evidence on mortality due to short term
drinking episodes. It did not offer guidance on levels of consumption for individual drinking episodes beyond
advice to reduce episodes of drunkenness, to have drink-free days after episodes of heavy drinking, and it
recommended a range of situations when it is not appropriate to drink alcohol at all.
14. The report discussed issues around the “J-shaped curve” for all cause mortality due to alcohol
consumption. A protective effect for men over 40 and post-menopausal women who drink alcohol regularly at
low levels is estimated to reduce mortality for these groups compared to non-drinkers. As consumption rises,
the protective effect is neutralised and then overtaken by an increasing risk of mortality from other conditions.
15. A number of studies have been published since 1995 on the protective effects of low level alcohol
consumption. Some have suggested that the effect for coronary heart disease may have been over-estimated,
and this issue is discussed in the 2009 Australian guidelines report. The 1995 report itself discussed one
element of this issue under a heading the “sick quitter” hypothesis (paragraph 5.4) but concluded on the basis
of expert testimony that the evidence for a protective effect was sound. We think it likely that the conclusion
of the 1995 report that a risk reduction is likely from levels of regular consumption as low as one unit per day,
with limited additional benefit at levels above that, is still correct. However, we have acknowledged in advice
to the public that a similar reduction of risk may be achieved through other means such as improved diet
and exercise.
16. The 1995 report suggested that a recommended upper level of alcohol consumption should be made by
reference to where a judgement of the evidence suggests that there is a steady increase of risk rising
“significantly” from the lowest all-cause mortality point on the J-shaped curve. The report discussed the
difficulty of identifying the precise point of minimal all-cause mortality due to alcohol (paragraph 7.10). While
an element of judgement is required, this has been misstated, in our view, in some public statements as meaning
that there is no objective basis for establishing guidelines for lower risk drinking.
17. The fact that there is no single scientific definition of “significant” or acceptable increase in risk also
requires an element of judgement. The 1995 guidelines considered the balance of the evidence on regular levels
of consumption that would not accrue significant health risk. A different approach was taken for the recent
2009 Australian guidelines, in which case the authors choose to use a lifetime risk of one in 100 of death from
alcohol-related disease or injury to inform their recommended drinking thresholds for acceptable risk. However,](https://image.slidesharecdn.com/guiasalcoholuk-130415104347-phpapp02/85/Guias-alcohol-uk-76-320.jpg)
![cobber Pack: U PL: CWE1 [O] Processed: [03-01-2012 16:31] Job: 015231 Unit: PG03
Science and Technology Committee: Evidence Ev 29
the authors state quite explicitly that this may be seen as too high or too low a risk by individual drinkers. As
in the 1995 report, they also make clear that the actual risk to an individual may be affected by factors such
as gender, age and body size.
18. An important development since 1995 has been the growth in understanding of the links between alcohol
and cancer. Successive evaluations between 1988 and 2009 by the WHO International Agency for Research
on Cancer (IARC) have shown that the occurrence of malignant tumours of the oral cavity, pharynx, larynx,
oesophagus, liver, female breast and colo-rectum is causally related to the consumption of alcoholic beverages.
The best current estimate is that 6% of cancer deaths in the UK are caused by alcohol,3
double the estimate
in the 1995 report. The contribution of alcohol consumption to the development of breast and colorectal cancers
and a better understanding of specific mechanisms by which alcohol causes cancer4
have only been confirmed
since publication of the 1995 report. The 1995 report did discuss the possibility of a link with breast cancer.
Even light drinking can increase the risk of most of the associated cancers.5
This relationship is true for
many of the alcohol-related health harms, and explains why no “safe” level of drinking could be recommended
in the 1995 report but rather a level of drinking that is “not a significant health risk”. Increased clarity about
these small health risks of low level consumption may affect the judgement of individuals about any health
benefits. For example, a non-smoking woman with a balanced diet and good exercise regime may place less
emphasis on the possibility of reduced risk of heart disease and greater emphasis on the small increased risk
of breast cancer.
19. Scientific developments since 1995 have not undermined our confidence in the current guidelines,
although we continue to keep the science under review. The Department is not currently planning a formal
review of the guidelines, but would be willing to consider this if it were felt to be useful, for example to help
communicate health impacts better.
20. As already mentioned, the 1995 report did not offer guidance on levels of consumption for individual
drinking episodes beyond advice to reduce episodes of drunkenness, to have drink-free days after heavy
drinking and advice on situations when no alcohol use is recommended. We are aware that some governments
do offer advice on levels of consumption for individual drinking episodes, in addition to advice for regular
drinking. For example, the 2009 Australian Government’s guidelines, do include such advice. The guidance
can be found at www.alcohol.gov.au The recommendations are based on statistical evidence of the lifetime risk
of death from injury related to individual drinking episodes. While we do see some possible value in such a
guideline, we have no plans at present to introduce this within the UK. We believe that this would require
particular consideration of its likely impact and its real value in influencing the behaviour of individuals who
currently choose to engage in “binge” drinking. The Australian Government’s guidelines (Guideline 2) do
acknowledge issues with the quality of the evidence quantifying the links between alcohol and injury.
21. In contrast with the position in 1995, improved information on risks now makes it possible to estimate
the overall burden of alcohol-related ill health in the UK, placing this in the context of other risks to health.6
While this does not impact directly on guidelines for consumption, improved information on risks should be
useful in public communications.
How well does the Government communicate its guidelines and the risks of alcohol intake to the public?
22. The 1995 report set out (10.29) what it saw as three elements for a coherent health education strategy—
its advice on (i) benchmarks for regular drinking, (ii) reducing episodes of excessive drinking and intoxication,
and (iii) specific messages for particular groups. It was concerned to reduce people’s underestimation of their
consumption. It argued strongly that the recommendations on daily benchmarks should always be presented
firmly in the context of the other advice and health risks and benefits.
23. The Government did not develop a strategy for education on alcohol in England until some time after
publication in 2004 of the Alcohol Harm Reduction Strategy for England. In 2007, the Home Office
commissioned a campaign targeted to young adult binge drinkers. In 2008, the Department of Health
commissioned the “Know Your Limits” campaign, which focussed on raising understanding of alcohol units. In
2009, the “Alcohol Effects” campaign had a stronger focus on health risks and on influencing “increasing risk”
and “higher risk” drinkers. In early 2010, the Department for Education funded the “Don’t Let Drink Decide”
campaign aimed at children and their parents.
24. From 2008 the Department has adapted the terminology used to communicate differing levels of risk to
practitioners and the public, focussing on three broad levels of consumption (lower risk, increasing risk and
higher risk). It was consistent with the 1995 report7
and with the further accumulated knowledge of the
estimated relative risks of harm across a range of consumption levels.
25. The new terminology was developed to aid communication of the known risks following research with
members of the public commissioned by the Department from the Central Office of Information (COI) and
after consultation with some 20 leading experts from the alcohol field. It focuses on three bands of regular
3
Doll and Peto, Epidemiology of Cancer, ed. (OUP, Oxford, 2003)
4
Seitz & Stickel, Nat. Rev. Cancer 2007, 7, 599
5
Corrao, et al., Prev Med 38 (5), 613–9 (2004)
6
The burden of alcohol-related ill health in the United Kingdom, R Balakrishnan and others, Journal of Public Health, June 2009
7
Annex F and Annex I, paragraph 1](https://image.slidesharecdn.com/guiasalcoholuk-130415104347-phpapp02/85/Guias-alcohol-uk-77-320.jpg)
![cobber Pack: U PL: CWE1 [E] Processed: [03-01-2012 16:31] Job: 015231 Unit: PG03
Ev 30 Science and Technology Committee: Evidence
consumption and links these to their known levels of risk for ill health and death. This helps individuals to
consider their personal risks. It allows an emphasis on those at greatest risk (higher risk), with an honest, risk-
based language shown to be better understood by that group. It reinforces the relatively low risks posed to the
larger numbers drinking within the recommended lower risk limits and the progressive increases in risk faced
by those in the intermediate category of increasing risk.
26. The results of the “Alcohol Effects” campaign were positive. In a post-campaign survey, increasing risk
and higher risk drinkers claiming to have cut down their drinking rose from 21% to 26%. Nevertheless, public
understanding of both unit measures (especially for wine) and the guidelines needs to improve. About a third
of the population can say what the guidelines are with some accuracy, with others both under- and over-
estimating.8
The Department of Health intends to address the low level of public understanding of risks over
time. From Autumn 2011, alcohol will be integrated in Change4Life, with a focus on improving understand of
risks for increasing risk and higher risk drinkers. Supporting material for NHS practitioners, especially in
primary care, will increasingly help us mobilise the support of GPs and others to help patients who are at risk
to reduce their consumption.
How do the UK Government’s guidelines compare to those provided in other countries?
27. In late 2008, the Department commissioned an external expert, Peter Anderson, to carry out a survey of
the advice on alcohol consumption provided by EU and EEA/EFTA Member States. Responses were received
from 22 EU Member States and three other EEA/EFTA Member States covering:
— whether there is a defined unit or standard drink size;
— general guidelines for adults on “low risk”, “responsible” or “safe” consumption;
— any guidelines for children or pregnant women;
— how guidelines are communicated; and
— inclusion of any advice on consumption on alcohol labels.
28. Broadly the findings were:
— for those governments (13) which do issue such guidelines, those for “low risk” regular
consumption by women were similar, ranging between 108g per week and 140g per week (UK =
112g); guidelines for men were more varied, ranging between 140g per week and 280g per week
(UK = 168g); one UK unit = 8g alcohol;
— six countries say they follow WHO recommendations—though understanding of these seems to
vary; and
— six countries do not issue such guidelines officially, though in some cases non-official guidelines
are recognised.
29. The Australian Government’s guidelines include a 2007 chart from the International Centre for Alcohol
Policy (page 19) comparing some international guidelines, although we note that this is not accurate for the UK.
September 2011
Supplementary written evidence submitted by the Department of Health (AG 00a)
Letter from Anne Milton MP, Parliamentary Under Secretary of State for Public Health, Department of
Health, to the Chair of the Committee, 3 November 2011
The Evidence Base for Alcohol Advice
I promised to send you further information to assist in your Inquiry into the evidence base for alcohol advice.
We discussed ways of increasing public awareness of the guidelines:
— In England, alcohol has been integrated into the wider Change4Life brand. The role for a
Change4Life alcohol campaign is to communicate the health harms of excessive drinking, and to
provide hints, tips and tools to encourage people to drink within the lower-risk guidelines.
— The NHS Choices website already includes information about units and health harms, along with
tools such as a unit calculator, drinks diary and drink tracker iPhone app (www.nhs.uk/LiveWell/
Alcohol/Pages/Alcoholhome.aspx).
— The Department of Health also provides supporting materials to the NHS (especially primary care),
to enable local health interventions to be delivered effectively. We know that over 60% of people
expect to find information on lower-risk drinking at their GP surgery.
— There will be an upgraded NHS “health harms toolkit” for NGOs, charities, PCTs and local
authorities to use as part of their localised activity such as press adverts and posters.
8
2009 data, The Information Centre, Statistics on Alcohol, England 2010](https://image.slidesharecdn.com/guiasalcoholuk-130415104347-phpapp02/85/Guias-alcohol-uk-78-320.jpg)
![cobber Pack: U PL: CWE1 [O] Processed: [03-01-2012 16:31] Job: 015231 Unit: PG03
Science and Technology Committee: Evidence Ev 31
In 2011–12, the Government is spending £2 million on social marketing in relation to alcohol. This is an
important area but we are conscious of the economic climate and the Government’s commitment to spend
public funds cautiously.
You asked about local spend on social marketing. As I suggested, the Department does not keep a record of
this. Local areas are responsible for managing their own budgets in relation to local campaigns:
— The Department has published guidance designed to direct commissioners in areas where tackling
alcohol harm is an identified priority to resources and good practice guidance, which will assist
them in commissioning interventions to reduce the harm caused by alcohol in their local
community (“Signs of Improvement—commissioning interventions to reduce alcohol-related
harm”, www.dh.gov.uk/en/Publicationsandstatistics/Publications/DH_102813) This includes a
number of High Impact Changes, shown to be the most effective actions for reducing alcohol-
related harms, one of which is to amplify national social marketing priorities.
— The Alcohol Learning Centre contains materials for local areas to use when creating local
campaigns and includes a section on social marketing (www.alcohollearningcentre.org.uk)
— As an example of local activity on public awareness, you may want to see the work of Balance,
the North East of England’s Alcohol Office. Funded by North East Primary Care Trusts, the
Department of Health, the Home Office and local Police forces, Balance has carried out campaigns
and public awareness work, examples of which are on its website (www.balancenortheast.co.uk/
media/)
The alcohol industry has a role to play too in improving information for consumers, it can reach
environments, such as pubs, that no Government brand can.
The Public Health Responsibility Deal includes a pledge to foster “a culture of responsible drinking, which
will help people to drink within guidelines”. So far around 115 companies have signed up to one or more of
the seven alcohol pledges, which cover areas from the improving of labelling and the availability of unit and
health information to providing support for local Community Alcohol Partnerships designed to address local
issues around alcohol-related social and health harms. As you asked, I am sending the details of these pledges
(Annex A).
You also asked about monitoring and evaluation of the Responsibility Deal:
— Partners to the Responsibility Deal will be required to set out what they plan to do to meet the
pledges they have signed up to and this information will be publicly available on-line.
— Following on from this, partners will have to report annually on their progress, using a set of
defined quantitative measures. This information will also be publicly available on-line. Based on
the published information, it will be transparent whether, or not, partners have delivered their
pledges and the progress that they have made.
— Partners’ pledge delivery plans, and the full list of quantitative measures that they will report
against, will be published on the Department of Health’s website shortly.
— Annual updates from the first year of the Responsibility Deal will be available on the Department’s
website in the Spring.
— In parallel, the Department’s Policy Research Programme is assessing the feasibility of an
overarching independent evaluation of the impact of some elements of the Responsibility Deal.
We discussed alcohol labelling. The labelling pledge will mean unit information appearing on 80% of
products by December 2013, which will be a real achievement. By working with industry, rather than trying
to regulate them through legislation, we can go further and faster and impact areas where it is simply not
practical to regulate. Food and drink labelling legislation is an area of European Union competence and any
attempts to regulate in this area would need to secure EU approval. Attempting this would take significant
Government time and resources and would have no guarantee of success.
The Department and the Portman Group have jointly agreed the terms for transparent monitoring and
reporting on compliance of the labelling pledge. This includes monitoring at interim stages, which will give us
early warning of any risk of missing the target.
In agreement with the Department, the Portman Group will commission independent experts to monitor the
implementation of the labelling agreement on behalf of the alcohol industry. The results of the monitoring
exercise will be published and companies will also self-report on individual progress through the Responsibility
Deal website.
I also mentioned the “ladder of intervention” approach to policy, which is explained in Healthy Lives,
Healthy People (page 29, www.dh.gov.uk/prod_consum_dh/groups/dh_digitalassets/documents/digitalasset/dh_
127424.pdf). We are committed to determining the least intrusive approach necessary to achieve the desired
effect. However, if partnership approaches (like the Responsibility Deal) fail to work, we will consider the case
for “moving up” the intervention ladder where necessary.
I have seen the 26 October transcript and think it helpful to clarify a couple of points. I offered to set out
some facts and figures on alcohol consumption and other areas, as the picture is confusing. These are given at](https://image.slidesharecdn.com/guiasalcoholuk-130415104347-phpapp02/85/Guias-alcohol-uk-79-320.jpg)
![cobber Pack: U PL: CWE1 [E] Processed: [03-01-2012 16:31] Job: 015231 Unit: PG03
Ev 32 Science and Technology Committee: Evidence
Annex B. I would also like to amend a couple of the figures I mentioned—57% of the public drink only once
a week or less (not 58%, question 71) and 75% of people have heard of drinking limits (rather than drinking
units, question 78). In response to question 93, it would of course be a weekly rather than daily limit that
would run the risk of people thinking this is an allowance they can save up for the weekend.
I look forward to the Committee’s report on the challenging and important issue of how best to provide
people with guidance and an advice on alcohol.
3 November 2011
Annex A
RESPONSIBILITY DEAL—ALCOHOL NETWORK PLEDGES
Core Commitment
We will foster a culture of responsible drinking, which will help people to drink within guidelines.
Collective Pledges
We support tackling the misuse of alcohol in order to reduce the resulting harms to individuals’ health and
to society, in particular through the implementation of following pledges:
A1. We will ensure that over 80% of products on shelf (by December 2013) will have labels with
clear unit content, NHS guidelines and a warning about drinking when pregnant.
A2. We will provide simple and consistent information in the on-trade (eg pubs and clubs), to raise
awareness of the unit content of alcoholic drinks, and we will also explore together with health bodies
how messages around drinking guidelines and the associated health harms might be communicated.
A3. We will provide simple and consistent information as appropriate in the off-trade (supermarkets
and off-licences) as well as other marketing channels (eg in-store magazines), to raise awareness of
the units, calorie content of alcoholic drinks, NHS drinking guidelines, and the health harms
associated with exceeding guidelines.
A4. We commit to ensuring effective action is taken in all premises to reduce and prevent under-age
sales of alcohol (primarily through rigorous application of Challenge 21 and Challenge 25).
A5. We commit to maintaining the levels of financial support and in-kind funding for Drinkaware
and the “Why let the Good times go bad?” campaign as set out in the Memoranda of Understanding
between Industry, Government and Drinkaware.
A6. We commit to further action on advertising and marketing, namely the development of a new
sponsorship code requiring the promotion of responsible drinking, not putting alcohol adverts on
outdoor poster sites within 100m of schools and adhering to the Drinkaware brand guidelines to
ensure clear and consistent usage.
A7. In local communities we will provide support for schemes appropriate for local areas that wish
to use them to address issues around social and health harms, and will act together to improve joined
up working between such schemes operating in local areas as:
— Best Bar None and Pubwatch, which set standards for on-trade premises.
— Purple Flag which make awards to safe, consumer friendly areas.
— Community Alcohol Partnerships, which currently support local partnership working to
address issues such as under-age sales and alcohol related crime, are to be extended to
work with health and education partners in local Government.
— Business Improvement Districts, which can improve the local commercial environment.
Individual Pledges Agreed to Date
— By 30 April 2011 we (ASDA) will no longer display alcohol in the foyers of any our stores.
— We (ASDA) will provide an additional £1 million to tackle alcohol misuse by young people.
— We (Heineken) will aim to remove 100 million units of alcohol from the UK market each year
through lowering the strength of a major brand by 2013.
— We (Heineken) will distribute 11 million branded glasses into the UK on trade showing alcohol
unit information by end of 2011.
— We (Bacardi Brown-Forman Brands, Diageo, Heineken and Molson Coors) commit to working
with the BII (British Institute of Innkeeping) and The Home Office to support the continuation and
further development of the Best Bar None scheme for at least the next three years to the value of
at least £500,000. (commencing May 2011).](https://image.slidesharecdn.com/guiasalcoholuk-130415104347-phpapp02/85/Guias-alcohol-uk-80-320.jpg)
![cobber Pack: U PL: CWE1 [O] Processed: [03-01-2012 16:31] Job: 015231 Unit: PG03
Science and Technology Committee: Evidence Ev 33
— We (the Wine and Spirits Trade Association) will expand the reach of Community Alcohol
Partnerships (CAPs) in the UK through an investment of at least £800,000 by alcohol retailers and
producers over the next three years9
This will allow us to significantly increase the number of
CAP schemes in local communities and extend the remit of CAPs beyond tackling under-age sales
to wider alcohol-related harm and in particular. We will seek to:
— Reduce young people’s demand for alcohol through prevention, information and
diversionary activities.
— Improve the delivery, consistency and quality of alcohol education for all age groups—
education,10
promotion of knowledge and safer drinking concepts; and
— Promote key health initiatives—unit information and sensible drinking messages in store.
— Three year project to extend the NOFAS-UK “What Do You Tell A Pregnant Woman About
Alcohol” programme across England & Wales to inform over one million pregnant women of what
they need to know about alcohol in pregnancy. We (Diageo) commit that in addition to the existing
NOFAS-UK booklets and materials, new resources and films will be produced, alongside face to
face training sessions, a new online training package, and distance learning packages (online course
also available in DVD format). These materials and courses will be CPD accredited by the Royal
College of Midwives and offered free to at least 10,000 midwifes, who we expect to inform over
one million pregnant women of the risks of drinking alcohol in pregnancy by the end of 2014.
Annex B
ALCOHOL FACTS AND FIGURES
Consumption
— 22% of adults (9.1 million) self-report that they regularly drink above NHS guidelines, with 2.2
million drinking over twice that level.
— These 22% drink about three quarters of all the alcohol consumed.
— Self-reports understate the true levels of consumption—based on HM Revenue & Customs data,
that is 67% higher than ONS data.
— 21% of men and 15% of women are binge drinkers (defined as those who say they drank more
than double the guidelines on their heaviest drinking day in the previous week)—about half of
these are not part of the 9 million who drink daily or regularly above NHS guidelines.
— 13% of 11–15 year olds reported drinking in the last week and the amount of alcohol consumed
by 11–15 year olds has doubled since 1990 but is now declining.
— Rising UK alcohol consumption and health harm over the last 50 years contrasts with the position
of most other major EU countries, such as France and Italy, where both have fallen consistently
over many years.
— Total alcohol consumption has increased 60% since the 1970s, reaching highest point in 2004–05
and appears to have stabilised since. The off-trade sells some 65% of the alcohol consumed,
and the largest few supermarkets dominate that market; in 1978, only one in three supermarkets
sold alcohol.
Health
— Alcohol penetrates every cell in the human body; this one reason why it causes such a range of
different types of harm.
— 60 different medical conditions, both acute and long term; some, eg certain cancers, only
discovered in the last 20 years.
— Individuals vary in how fast they metabolise alcohol by three- to four-fold and in the extent to
which they are affected by a given amount of alcohol by two- to three-fold. This affects how
people drink, the risk of developing alcohol dependence, and the long term risks for damage to
the body.
— An average man drinking exactly on 50 units weekly for a long time (double the guidelines) would
run about a 10% chance of dying in their lifetime from an alcohol-related cause. As with smokers,
it will always be possible to find heavy drinkers who live long lives and die from extreme old age.
— 1.2 million hospital admissions (of 14 million total admissions) were alcohol related (cancer, liver
disease, strokes, etc) in 2010–11, 8% higher than the previous year per head of population.
Public Awareness
— 90% of people say they have heard of measuring alcohol in units and 75% have heard of
drinking limits.
9
Financial Years July 2011–June 2014
10
Schools education projects will be delivered by recognised third parties, without direct industry involvement.](https://image.slidesharecdn.com/guiasalcoholuk-130415104347-phpapp02/85/Guias-alcohol-uk-81-320.jpg)
![cobber Pack: U PL: CWE1 [E] Processed: [03-01-2012 16:31] Job: 015231 Unit: PG03
Ev 34 Science and Technology Committee: Evidence
— But many people are unaware that they are drinking above the lower-risk guidelines—over half of
those drinking above the guidelines said they drink alcohol to relax and unwind without thinking
about how much they drink.
— 87% of people agree that ignoring the lower-risk guidelines can lead to serious health problems.
But 44% of those dinking above the guidelines felt that the health risks of regularly drinking more
than the lower-risk guidelines were exaggerated.
— In surveys, only 15% of people who drink at higher risk levels say they wish to change their
behaviour (for smoking and obesity the equivalent measure is around 80%).
Written evidence submitted by Alcohol Research UK (AG 06)
1. What evidence are Government’s guidelines on alcohol intake based on and how regularly is the evidence
base reviewed?
We have decided to focus our document on the current evidence base.
2. Could the evidence base and sources of scientific advice to Government on alcohol be improved?
The first point to make is that alcohol causes nearly 10% of all ill-health and premature deaths in Europe.
The World Health Organization’s Global Burden of Disease Study finds that alcohol is the third most important
risk factor, after smoking and raised blood pressure, for European ill-health and premature death.
The number of alcohol-related deaths in the United Kingdom has consistently increased since the early
1990s, rising from the lowest figure of 4,023 (6.7 per 100,000) in 1992 to the highest of 9,031 (13.6 per
100,000) in 2008. (1)
The following summary of current evidence and key concepts relating to guidelines relies heavily on recent
work carried out in Australia and Canada by expert committees producing low risk guidelines: labelled low
risk because even regular small amounts of alcohol have been linked to disease. A Special Issue of the Drug &
Alcohol Review devoted to the topic of drinking guidelines will be published next March, with early online
availability before that. The Special Issue will include papers by world experts on a range of issues to do with
drinking guidelines and will be directly relevant to the Committee’s deliberations.
2.1 A Relative or Absolute Risk Approach
The Canadian approach was to base guidelines on comprehensive reviews of the Relative Risk of health or
social outcomes for different levels of consumption compared with the risk experienced by abstainers. Sixteen
systematic reviews and meta-analyses conducted by Rehm, Taylor and colleagues at the Centre for Addiction
and Mental Health, Ontario were examined (2). The aim was to identify a level of average daily consumption
where overall net risk of premature death is the same as that of a lifetime abstainer (zero net risk). At this
level of consumption potential health risks and benefits from drinking exactly cancel each other out.
The Australian approach [3] focused upon the absolute risk of harmful outcomes. Daily drinking levels were
estimated which would increase the lifetime risk of premature death, injury or illness to more than 1%: this
risk of one in 100 is often adopted when assessing the harmful effects of exposure to other hazardous events
(eg toxins in the environment).
It should be noted that both the Australian and the Canadian methodology differ from the approach adopted
in the Department of Health Sensible Drinking recommendation in 1995.Their recommendations were derived
from an analysis of the point on the J-shaped curve relating consumption to the risk of all-cause mortality at
which the curve shows a significant increase relative to its lowest point (see Department of Health, 1995, p.21,
para 7.8), rather than relative to abstainers as in the Canadian analysis.
2.2 Summary of Canadian findings
2.2.1 Lifetime risk of alcohol- related disease
The Canadian review considered findings separately for males and females from four mostly well-designed
meta-analyses linking level of alcohol consumption and risk of death from all causes. The point at which there
was a zero net risk in these studies compared with the abstainer reference group was between 1.5 and 2.5
Canadian standard drinks for women and between two and three standard drinks for men. One Canadian
standard drink is 13.45g of absolute alcohol—the UK standard drink (known as a “unit”) is 8g. However, there
is an important potential confounding factor when using abstainers as a reference group. As well as lifetime
abstainers these groups may include both ex-drinkers and occasional drinkers who are likely to comprise many
people who have cut down their drinking for health reasons. These people have a higher risk of premature
death than lifetime abstainers. Di Castelnuovo et al [4] claimed to have taken account of this issue. They
provide the best available estimate of a net zero risk point. This was found to be at an average of two Canadian
standard drinks per day for women and three Canadian standard drinks per day for a man: the equivalent of
3.4 UK units for women and five UK units for men.](https://image.slidesharecdn.com/guiasalcoholuk-130415104347-phpapp02/85/Guias-alcohol-uk-82-320.jpg)
![cobber Pack: U PL: CWE1 [O] Processed: [03-01-2012 16:31] Job: 015231 Unit: PG03
Science and Technology Committee: Evidence Ev 35
2.2.2 Lifetime risk of death from alcohol-related injury
A systematic search identified 17 published studies from 1995 onwards which had quantified the relative
risk of injury following drinking. Six of the 12 case-control studies reported stronger effects for women while
none of those with case-crossover designs found significant gender effects.
The Canadian expert group concluded that recommended upper levels for occasional consumption on a
single day should be three Canadian standard drinks for a woman and four Canadian standard drinks for a man:
equivalent to five UK units for women and seven for men. These guidelines should always be accompanied by
“the following caveats and stipulations for minimising risk of acute problems: (i) avoiding high-risk situations
and activities; (ii) minimising intoxication by drinking slowly, selecting lower alcohol content beverages,
drinking in association with food, alternating alcoholic drinks with caffeine-free non-alcoholic drinks and not
combining use with other psychoactive substances; (iii) minimising frequency of consuming at upper levels;
and (iv) advising persons with low tolerance due to young or old age and/or low bodyweight to never exceed
two Canadian standard drinks for women, three for men (3.5 and 5 UK units).
It was clearly acknowledged that each drink from one onwards increases the risk of acute problems in many
situations. It was reasoned though that if certain high-risk situations are avoided and if other precautions are
taken these levels can still be considered low risk.
2.3 Summary of the Australian evidence
2.3.1 Lifetime risk of alcohol-related disease
When considering the absolute risk of dying from alcohol-attributable disease it is clear that, as the average
volume of alcohol consumption increases, the lifetime risk of death from alcohol-related disease increases. For
both sexes, the lifetime risk of death from alcohol-related disease more than triples when consumption increases
from two to three Australian standard drinks a day (2.5 to 3.75 UK units). At higher levels of drinking, large
differences by gender are seen, with the risk for women being significantly higher than that for men. At one
standard drink, the lifetime risk for women is lower than for men. At 10 standard drinks a day, the lifetime
risk for women is almost one in 10, 25 times the risk at two standard drinks. For men, there is an almost 12-
fold increase and the risk is six in 100.
At levels of alcohol consumption recommended in the Australian report (two Australian standard drinks or
less on any day), there is little difference in the risk of alcohol-related harm for men and women over a lifetime.
This level is equivalent to 2.5 UK units.
2.3.2 Lifetime risk of death from alcohol-related injury
A modelled analysis was used to determine the accumulated lifetime risk of death from the type of injuries
for which alcohol has an accepted causal effect, based on established epidemiological data.
Lifetime risk was calculated for an increasing number of drinks per occasion and for various numbers of
drinking occasions over a lifetime.
The risk of death from injury remains below one in 100 for both men and women if they always drink two
Australian standard drinks or less on an occasion, even if the occasions are every day. (Equivalent to 2.5 UK
units: about one pint of 4.5% ABV beer).
2.4 Comparison of Canadian and Australian reports
A comparison of these two reports indicates that different methods of establishing low risk guidelines will
lead to differing low risk limits. These upper limits for daily low risk consumption, in UK units, are summarised
in the following table:
Table 1
RECOMMENDED LOW RISK UPPER LIMITS IN UK UNITS (1 UNIT = 8G)
Low risk limits for disease Low risk limits for injury
Women Men Women Men
Canada 3.4 5 5 7
Australia 2.5 2.5 2.5 2.5
Both the Australian and the Canadian reports consider a similar evidence base relating to young people and
to pregnancy.
2.5 Children and young people under 18 years of age
The results of a comprehensive review of the available evidence completed by the Australian team (2)
indicate that:](https://image.slidesharecdn.com/guiasalcoholuk-130415104347-phpapp02/85/Guias-alcohol-uk-83-320.jpg)
![cobber Pack: U PL: CWE1 [E] Processed: [03-01-2012 16:31] Job: 015231 Unit: PG03
Ev 36 Science and Technology Committee: Evidence
— Young people under the age of 15 years are much more likely than older drinkers to experience
risky or antisocial behaviour connected with their drinking.
— The rates of risky behaviour are also elevated among drinkers aged 15−17 years.
These conclusions are based upon an assessment of the potential harms of alcohol for these age groups, as
well as a range of epidemiological research that indicates that alcohol may adversely affect brain development
children and be linked to alcohol-related problems later in life. However, this evidence is not conclusive enough
to allow definitive statements to be made about the risks of drinking for young people. As a result it has not
been possible to set a “safe” or “no-risk” drinking level for children and young people. The safest option for
those under fifteen is not to drink at all and the safest option for 15–17-year-olds is to delay the initiation of
drinking for as long as possible.
2.6 Pregnancy and breastfeeding
2.6.1 Whilst here has been a great deal of research on the effects of alcohol on the foetus, the complexity
of the issue makes development of policy and provision of definitive advice difficult. Although the risk of birth
defects is greatest with high, frequent maternal alcohol intake during the first trimester, alcohol exposure
throughout pregnancy (including before pregnancy is confirmed) can have consequences for development of
the foetal brain.
However, it is not clear at what dose harmful effects become detectable. This uncertainty is reflected in
policy and guidance regarding alcohol use in pregnancy (5). Several authoritative guidelines emphasise that a
safe level has not been established and conclude that not drinking at any stage in pregnancy is the safest option.
2.6.2 The Australian guideline document provides a comprehensive review of the evidence (p71). For
example, the National Perinatal Epidemiology Unit in the UK has published two high quality systematic
reviews (6, 7). The reviews were based on a thorough search of the literature and were critically assessed using
established criteria.
The first review, which included 46 studies, addressed the effects of low to moderate prenatal alcohol
exposure (less than 12g alcohol) on pregnancy outcomes. In five of the eight studies reporting on miscarriage,
an increased rate was observed in the exposed group; however two of these studies had methodological
limitations, including failure to adjust for confounding factors. Overall, there was no convincing evidence
that low-moderate maternal alcohol intake conferred an increased risk of miscarriage, still-birth, prematurity,
intrauterine growth restriction (or small for gestational age at birth) and birth defects, including Foetal
Alcohol Syndrome.
There were several limitations in the studies included in the review and the authors concluded that it “is
difficult to determine whether there was any adverse effect on pregnancy outcome associated with low-moderate
levels of prenatal alcohol consumption” but also that the paucity and inconsistency of available evidence
“preclude the conclusion that drinking at these (low-moderate) levels during pregnancy is safe”.
2.6.3 In the second systematic review the foetal effects of prenatal “binge-drinking” (defined in most studies
as six standard drinks on a single occasion) in women who were pregnant or trying to become pregnant
were examined.
In the 14 included papers, there was no consistent evidence that “binge-drinking” influenced rates of these
outcomes, with the exception of neurodevelopmental outcomes. Individual studies suggest that disinhibited and
delinquent behaviour, reduction in verbal IQ, and learning difficulties and poor educational performance are
more common in children whose mothers “binge”. Furthermore, the risk increased with higher alcohol intake
and greater frequency of “binges”. Many of the included studies had methodological weaknesses and different
definitions for “binge-drinking” were used (eg some studies included women who had a “binge” on a single
occasion and others included only women who “binged” throughout pregnancy).
A further limitation of both this and the earlier review is the short duration of follow-up of exposed children
in the included papers. Alcohol-related neurodevelopmental disorders, for example, may not be diagnosed until
school age. The study authors conclude that, despite the lack of good evidence of harm from heavy drinking
in human studies, the animal literature suggests that the appropriate public health message may be
“recommending pregnant women to avoid binge drinking”.
The reviewers note that, when pregnant women who do not drink regularly report having had isolated
episodes of heavy drinking, they should be reassured that the evidence for risk of harm is minimal.
2.6.4 Breastfeeding
There is a lack of good quality evidence from human studies regarding the effects of maternal alcohol
consumption on lactation, infant behaviour and development. As a result, as for pregnancy, it was not possible
to set a “safe” or “no-risk” drinking level for breastfeeding women.](https://image.slidesharecdn.com/guiasalcoholuk-130415104347-phpapp02/85/Guias-alcohol-uk-84-320.jpg)
![cobber Pack: U PL: CWE1 [O] Processed: [03-01-2012 16:31] Job: 015231 Unit: PG03
Science and Technology Committee: Evidence Ev 37
2.7 Alcohol consumption and risk of social harm
2.7.1 Alcohol consumption is not only linked to acute and chronic diseases, it is also connected with social
harms such as physical and sexual violence, vandalism, public disorder, family and interpersonal problems,
financial problems, unwanted sex, work and school-related problems, with levels of risk rising with increased
consumption. When socio-demographic variables and volume of overall alcohol use are controlled, the
likelihood of social harm increases with the frequency of heavy drinking. A large US national alcohol survey
(8) and found that frequency of drinking five or more US standard drinks per day was a strong predictor of
violent behaviour, driving license revocation, spousal abuse, divorce/separation as well as work and school
problems. (Five US standard drinks is equivalent to about 8.5 UK units.)
2.7.2 A study of patterns and levels of drinking by US college students (9) used a mathematical modelling
approach to identify changing risk of harmful outcomes as a function of quantity of alcohol consumed on one
occasion. Clear threshold effects were identified for this relatively young group at two drinks for females and
three drinks for males. (2.5 and four UK units). These findings were considered to support the need for lower
recommended levels for younger drinkers and for mitigating risk by limiting frequency of consuming at upper
levels of consumption. As a consequence the Australian report advised substantially lower levels of
consumption (one or two Australian standard drinks no more than one or two times per week) were
recommended for older teenagers and for young people under 25 years.
2.8 Limitations of the research evidence
The following are the main limitations of the evidence base used to set low-risk limits.
2.8.1 Under-reporting of personal alcohol consumption
It is well established that self-reported consumption of alcohol can often underestimate actual consumption.
Some of the larger cohort studies from which risks of specific or all-cause mortality have been estimated use
the most reliable recent recall methods or validate self-report using diary methods: but many do not. Under-
reporting of consumption in studies results in overestimation of the risks of alcohol consumption.
2.8.2 Failure to take account of heavy drinking episodes
The frequency of heavy consumption occasions involving five or more drinks in one day is associated with
increased risk of alcohol-related morbidity and mortality. Recent studies relating level of alcohol use to risk of
adverse health outcomes are more likely to control for this variable, but the meta-analyses presented in the
Australian and Canadian reports include many studies that have not. This will also result in overestimation of
risks from a given level of alcohol use.
2.8.3 Misclassification of former and occasional drinkers as lifelong-abstainers
Abstainers who have been drinking in the past are more susceptible than lifelong abstainers to alcohol-
related harms. Recent studies and meta-analyses have been more careful to compare drinking risk against that
for a strictly defined group of lifelong abstainers, making separate estimates for former drinkers.
2.8.4 Failure to control for confounding effects of personality and lifestyle
There are also a number of reasons why the beneficial effects of moderate alcohol use may be overestimated.
These include evidence of publication bias (whereby researchers are more likely to publish papers finding
evidence of cardiac protection than not) and a failure to control for lifestyle factors. Light and moderate alcohol
use is significantly associated with a multitude of positive health behaviours which are especially likely to
reduce risk of cardiac and vascular illness, eg healthy diet, regular exercise, lower bodyweight and high socio-
economic status. In other words, moderate alcohol use can be a sign of healthy living rather than a cause of
extra longevity.
3. How well does the Government communicate its guidelines and the risks of alcohol intake to the public?
We have no robust evidence that enables us to answer this question but we would like to follow suggestions
made in the Australian guidelines and propose the use of the following methods in the future:
3.1 Materials to support health professionals providing assessment and brief advice to early-stage problem
drinkers or persons whose health is compromised in some way by their drinking.
3.2 Web-based interactive materials that enable individuals to assess their own level of alcohol consumption
and risk profile. Examples of such websites are http://www.downyourdrink.org.uk/ and
http://www.drinkaware.co.uk and NHS Choices http://www.nhs.uk/Tools/Pages/Alcoholcalculator.aspx?Tag.
3.3 Brief and informative leaflets to be available in various healthcare settings and for the general public
summarising the low-risk guidelines.
3.4 Materials that enable drinkers to better understand the number of standard drinks they consume (eg,
using illustrations of popular drinks showing numbers of units they contain or the labeling of alcohol containers
with the number of units they contain).](https://image.slidesharecdn.com/guiasalcoholuk-130415104347-phpapp02/85/Guias-alcohol-uk-85-320.jpg)
![cobber Pack: U PL: CWE1 [E] Processed: [03-01-2012 16:31] Job: 015231 Unit: PG03
Ev 38 Science and Technology Committee: Evidence
3.5 Widespread social marketing to both youth and adults to increase their knowledge of guidelines, and
inform their individual choices. This includes the use of Smart phone Apps.
3.6 The Canadian expert group suggest that a “useful and engaging dissemination strategy would be to
develop an Internet-based resource which would allow individuals to estimate their absolute risk of an alcohol
caused death at different levels of consumption based on information about gender, age, personal health and
perhaps family histories of illness. This would complement the more simplistic population-wide Guideline
advice based on relative risk”.
3.7 The message to be disseminated must be simple but it also must be accurate. Heather (10) has pointed
out that it must give a guideline on a limit for regular consumption as well as a different one for one-off
consumption, although these two different kinds of limit are often confused in communications to the general
public. He argues that: “Conventional wisdom has it that, to be effective, communications to the general public
should consist of no more than one piece of information or two at the most. However, if the accurate
information it is desired to communicate is unavoidably complicated, what alternative is there? At the very
least, there should be a discussion in public health circles about how the conflicting imperatives of avoiding
overly complex messages and telling the public what the available evidence indicates can be reconciled.
4. How do the UK Government’s guidelines compare to those provided in other countries?
4.1 The Australian document provides a useful chart that summarises recommendations relating to low risk
limits in OECD countries
From this chart it can be seen that for women 12 countries are recommending limits that are lower than the
UK. They are: Australia, Austria, Czech Republic, Finland, France, Ireland, Netherlands, New Zealand, Poland,
Slovenia, Sweden & United States. Only five countries recommend limits that are greater than the UK. They
are: Canada, Portugal, Romania, Singapore & Spain. For men 15 countries recommend limits that are lower
than the UK. They are: Australia, Austria, Canada, Czech Republic, Finland, France, Ireland, New Zealand,
Poland, Singapore, Slovenia, Spain, Sweden, Switzerland & United States. Six countries recommend higher
limits: Denmark, Italy, Japan, Netherlands, Portugal & South Africa.
0 1 2 3 4 5
Number of Australian Standard drinks per drink
Notes: * Converted from weekly recommendation.
Where a range is given, the maximum has been included in this Figure.
Australia (2009)
Austria
Canada
Czech Republic
Denmark*
Finland*
France
Ireland*
Italy
Japan
Netherlands
New Zealand
Poland
Portugal
Romania
Singapore
Slovenia
South Africa*
Spain
Sweden
Switzerland
United Kingdom
United States
OECDCountries
Figure 3 Recommendations on level of alcohol consumption in OECD Countries](https://image.slidesharecdn.com/guiasalcoholuk-130415104347-phpapp02/85/Guias-alcohol-uk-86-320.jpg)
![cobber Pack: U PL: CWE1 [O] Processed: [03-01-2012 16:31] Job: 015231 Unit: PG03
Science and Technology Committee: Evidence Ev 39
5. References
1. Alcohol Deaths—UK rates increase in 2008; Office for National Statistics, General Register Office for
Scotland, Northern Ireland Statistics and Research Agency, 28 January 2010.
2. Australian Guidelines to Reduce Health Risks from Drinking Alcohol http://www.nhmrc.gov.au/your-health/
alcohol-guidelines.
3. The basis for Canada’s new low risk drinking guidelines: a relative risk approach to estimating hazardous
levels and patterns of alcohol use. Tim Stockwell, Peter Butt, Doug Beirness, Louis Gliksman and Catherine
Paradis. Based on a paper presented at the Annual Symposium of the Kettil Bruun Society for Social and
Epidemiological research on Alcohol, 30 May–4 June 2010.
4. Di Castelnuovo, A Costanzo, S, Bagnardi, V, Donati, M B, Iacoviello, L. and de Gaetano, G. (2006) Alcohol
dosing and total mortality in men and women: an updated meta-analysis of 34 prospective studies. Archives
of Internal Medicine,166:2437–2445.
5. O’Leary, C, Nassar, N, Zubrick, S, Kurinczuk, J, Stanley, F & Bower, C (2010). Evidence of a complex
association between dose, pattern and timing of prenatal alcohol exposure and child behaviour problems.
Addiction, 105, (1), 74—86.
6. Henderson J, Gray R, Brocklehurst P (2007a). Systematic review of effects of low-moderate prenatal alcohol
exposure on pregnancy outcome. BJOG 114: 243–52.
7. Henderson J, Kesmodel U, Gray R (2007b). Systematic review of the fetal effects of prenatal binge-drinking.
J Epidemiol Community Health 61: 1069–73.
8. Dawson, D A, Li, T K & Grant, B F (2008). A prospective study of risk drinking: At risk for what? Drug
and Alcohol Dependence, 95, 62–72
9. Gruenewald, P, Johnson, F, Ponicki, W R, & LaScala, E A (2010). A dose-response perspective on college
drinking and related problems. Addiction, 105(2), 257–269.
10. Heather N, (2009). The importance of keeping regular: accurate guidance to the public on low-risk drinking
levels. Alcohol & Alcoholism Vol. 44, No. 3, pp. 226–228.
September 2011
Supplementary written evidence submitted by Alcohol Research UK (AG 06a)
12 October Evidence Session
There was a point in the hearing where there was disagreement between Dr. Harding and myself over the
current strength of evidence to support the alcohol cardioprotective effect and the Chairman asked for
submissions of further evidence on this point. I had said that the consensus on the validity of the
cardioprotective effect had largely abated since the “Sensible Drinking” report in 1995 and I now attach
evidence to support that view:
(1) The paper by Fillmore and colleagues (2006) reports that the authors carefully reviewed 54 studies of
the relationship between drinking and all cause mortality/ coronary heart disease and found only seven
that were free of errors in the classification of “lifelong abstainers”; none of these seven reported a
cardioprotective effect;11
(2) The paper by Chikritzhs et al. (2009) is a brief review of evidence in this area, including the earlier
paper above, and provides four reasons to be sceptical about the cardioprotective effect.12
I should add that, in my view, it is still possible that the protective effect exists because, as Dr. Harding
pointed out, a plausible physiological mechanism has been described for it. However, even if this were
accepted, there is still considerable doubt about the size of the effect or its significance for policy on alcohol
consumption. And, as Dr. Morgan also emphasised at the hearing, if this is true in the area of cardiovascular
disease, where literally hundreds of epidemiological papers have been published, it must be even more true for
other claims of putative protective effects against other types of disease where the evidence-base is in all cases
much thinner.
Professor Nick Heather
Emeritus Professor of Alcohol & Other Drug Studies, School of Life Sciences, Northumbria University
Alcohol Research UK
October 2011
11
http://www.annalsofepidemiology.org/article/S1047–2797(07)00007–5/fulltext
12
http://ndri.curtin.edu.au/local/docs/pdf/publications/RJ557.pdf](https://image.slidesharecdn.com/guiasalcoholuk-130415104347-phpapp02/85/Guias-alcohol-uk-87-320.jpg)
![cobber Pack: U PL: CWE1 [E] Processed: [03-01-2012 16:31] Job: 015231 Unit: PG03
Ev 40 Science and Technology Committee: Evidence
Written evidence submitted by The British Beer & Pub Association, The National Association of Cider
Makers, The Scotch Whisky Association and The Wine and Spirit Trade Association (AG 08)
We welcome the opportunity to respond to the Science and Technology’s Committee’s inquiry into the
evidence base for alcohol guidelines. This response is presented on behalf of trade associations representing
nearly 500 companies in the UK alcoholic drinks sector, which range from global businesses to SMEs,
producers to retailers. We are:
— The British Beer & Pub Association (BBPA);
— The National Association of Cider Makers (NACM);
— The Scotch Whisky Association (SWA); and
— The Wine and Spirit Trade Association (WSTA).
This response is limited to questions 3 and 4 within the remit of the Committee’s inquiry, namely:
3. How well does the Government communicate its guidelines and the risks of alcohol intake to the
public?
4. How do the UK Government’s guidelines compare to those provided in other countries?
We do not consider ourselves best placed to comment on scientific advice and evidence underpinning the
current guidelines.
Summary
— Industry is committed to helping people drink within guidelines. We want a future for the alcohol
industry in which our products are made, sold and enjoyed responsibly. The health and well-being
of consumers is important to the industry, which is why we promote a range of activity to
encourage people to drink within recommended guidelines.
— More people are drinking responsibly. Evidence indicates that there is greater awareness of units
and guidelines, alcohol consumption has declined and more people are drinking within
recommended guidelines. This suggests that action to communicate guidelines and the risks of
alcohol misuse is helping to change drinking behaviour.
— No wish to see a change in the recommended drinking guidelines at the present time. The adoption
of revised guidelines would undermine the progress which has been made in improving awareness
of the current guidelines and the future work the industry has committed to deliver under the
Public Health Responsibility Deal.
Question 3: How well does the Government communicate its guidelines and the risks of alcohol intake to the
public?
Action to communicate drinking guidelines and risks of alcohol misuse
1. There has been concerted action by government, industry and NGOs to encourage people to drink more
responsibly. Better education and information campaigns have been central planks of the Government’s alcohol
strategy. However in considering how well the guidelines are communicated, it would be wrong to focuss on
government initiatives in isolation. Industry can reach consumers in ways which government cannot and has
worked to communicate units and sensible drinking guidelines in a range of ways.
Labelling
2. In 2007, the industry reached a voluntary agreement with the Government to communicate unit
information and recommended drinking guidelines on product labels. Five elements for inclusion on labels
were: unit content; the Chief Medical Officer’s recommended daily guidelines; a drinking when pregnant
warning; a responsible drinking message and the Drinkaware website address. The industry’s commitment as
part of the Department of Health’s Public Health Responsibility Deal builds on this agreement and takes it
further (see paragraph 21 below).
Drinkaware
3. Through voluntary donations, the industry supports Drinkaware, an independent, UK-wide charity which
tackles alcohol misuse. It carries out campaigning and educational work to equip people with the knowledge
they need to drink responsibly. The Drinkaware website offers tools to help people drink within guidelines,
such as a simple unit calculator. The Drinkaware web address now features on over five billion drinks containers
and online, in print, poster cinema and television advertising.13
4. The Drinkaware “Why let good times go bad?” campaign is targeted at encouraging 18 to 24 year olds
to drink responsibly. The five-year, £100 million advertising campaign utilises behaviour change messaging
and focuses on practical tips for sensible drinking, such as alternating alcoholic drinks with water. Now into
13
Portman Group, Taking Alcohol Responsibility Seriously, 2011](https://image.slidesharecdn.com/guiasalcoholuk-130415104347-phpapp02/85/Guias-alcohol-uk-88-320.jpg)
![cobber Pack: U PL: CWE1 [O] Processed: [03-01-2012 16:31] Job: 015231 Unit: PG03
Science and Technology Committee: Evidence Ev 41
its third year, the campaign is delivering results. Following the 2010 activity, 70% of the target audience said
they would re-consider their drinking behaviour and 74% said they would drink more responsibly.14
Alcohol Awareness Week in Scotland
5. Alcohol Awareness Week is an initiative from the Scottish Government Alcohol Industry Partnership
supported by Government, the alcohol industry, health stakeholders and a broad range of other organisations.
First launched in 2007, the responsible drinking campaign takes place over a one-week period in October, to
make people aware of responsible drinking tips and help them understand the number of units in the drinks
they consume.
6. For maximum impact, the campaign uses a range of resources, from bill boards, a website and local
events. This ensures that consumers are exposed to messages in a variety of locations, whether they are visiting
their local supermarket, going to the pub, travelling to work or watching TV. Over 600,000 unit measure cups
and 350,000 unit calculators have been distributed in Scotland as part of Alcohol Awareness Week.
“Know Your Drinks” Campaign
7. In October 2006, the Home Office and Department of Health launched the first Know Your Limits
campaign, aimed at 18–24 year old binge drinkers.15
The Government’s updated alcohol strategy launched in
June 2007 outlined plans to build on this with a second phase of work with the drinks industry, to display unit
information and sensible drinking information at points of sale.16
8. As a result of this, the WSTA and Drinkaware launched the “Know your Drinks” point of sale campaign
in 2008. The campaign was built around two core elements: clear guidance to people about the units of alcohol
they are consuming, relating information to types of drink and complementary tips encouraging people to drink
sensibly and responsibly. It included short, simple messages such as “Know your drinks…a standard 25ml
measure of 40% ABV spirit is 1 unit.” Materials were designed in a variety of formats, from posters, shelf
edge stickers, web banners and hanging installation displays. Materials were used in well over 10,000 retail
outlets run by WSTA members.
Know your
drinks....
A 440ml can
of 4.1% ABV beer
is 1.8 units.
DRINKAWARE.CO.UKI
Know your
drinks....
Chief Medical Officers
recommend not regularly
exceeding daily units of
2-3 for women
and 3-4 for men.
DRINKAWARE.CO.UKI
Know your
drinks....
A 125ml glass
of 12% ABV wine
is 1.5 units.
DRINKAWARE.CO.UKI
Progress: More people are drinking responsibly
9. The factors influencing the level of a population’s alcohol consumption are complex. However recent
trends in consumption suggest that the work by government, industry and NGOs to communicate sensible
drinking messages is having an impact. Much of the public policy debate on alcohol is shaped by the
assumption that alcohol consumption is increasing in the UK. In fact, the reverse is true, with more people
drinking within the recommended guidelines.
Average consumption has fallen
An analysis of HMRC clearance data shows that total alcohol consumption fell by 11% between 2004
and 2010.17
According to the latest available data, in 2009 average weekly consumption was below government
guidelines at 11.9 units a week, down from 13.5 in 2006. Average male consumption was 16.3 units a week,
down from 18.7 in 2006. Average female consumption was 8 units, down from 9 units in 2006.18
14
Figures from Drinkaware, July 2011.
15
House of Commons Health Committee, First Report of Session 2009–10, Alcohol, HC 151-II, January 2010
16
HM Government, Safe. Sensible. Social, The Next Steps in National Alcohol Strategy, June 2007
17
BBPA analysis based on HMRC clearance data
18
ONS, Smoking and drinking among adults 2009, 27 January 2011, Table 2.1](https://image.slidesharecdn.com/guiasalcoholuk-130415104347-phpapp02/85/Guias-alcohol-uk-89-320.jpg)
![cobber Pack: U PL: CWE1 [E] Processed: [03-01-2012 16:31] Job: 015231 Unit: PG03
Ev 42 Science and Technology Committee: Evidence
More people are drinking within guidelines
The proportion of men in Great Britain drinking more than 21 units a week19
has fallen from 31% in 2006
to 26% in 2009. The share of women drinking more than 14 units a week has dropped from 20% to 18%. The
downward trend has also occurred among 16–24 year olds, with a significant drop in young men drinking more
than recommended weekly guidelines from 30% in 2006 to 21% in 2009.20
The proportion of people exceeding the guidelines on their heaviest drinking day has decreased since 2004.
The proportion of men exceeding four units on their heaviest drinking day was 41% in 2007 and 37% in 2009,
with an even greater reduction in the 16–24 age group. The proportion of women drinking more than three
units in a day was 34% in 2007 and 29% in 2009.21
Binge drinking continues to decline
The number of people reporting binge drinking (over 8 units for men and 6 units for women) on at least
one day in the previous week continues to fall. Men down from 23% in 2006 to 20% in 2009 and women
down from 15% to 13%. Again, the drop amongst men in the 16–24 age group has been even greater—from
30 to 24%.22
10. The Chief Medical Officer recommends that children should not drink any alcohol until they are at least
15. The most recent evidence suggests that more young people are choosing not to drink alcohol.
The proportion of 11–15 year olds in England who had never drunk alcohol increased from 39% in 2003 to
55% in 2010. The proportion of pupils who drank alcohol in the last week dropped from a peak of 26% in
2001 to 13% in 2010.23
Underage drinking less acceptable
Young people are also becoming less tolerant of drinking amongst their peers. In 2010, just under a third—
32%—agreed that it was acceptable for someone of their age to drink alcohol once a week, compared with
46% in 2003.24
Knowledge of units and sensible drinking guidelines has increased
11. Knowledge of units and alcohol guidelines arms individuals with the information they need to be able
to monitor how much they drink. Such knowledge does not necessarily mean that a person will drink less: they
can choose to ignore sensible drinking advice. However the declines in consumption and adoption of more
responsible drinking habits have occurred alongside greater awareness and understanding of units and
guidelines. This again suggests that campaigns to communicate responsible drinking have helped to foster
this change.
Understanding of units
12. According to the latest available ONS survey data, knowledge of alcohol units has increased considerably
over the past decade:
— 90% of people have heard of units, up from 79% in 1997.25
— It is especially important that people understand what a unit of alcohol is of the drinks they
regularly consume. It is welcome that there have been considerable increases in the proportions of
people regularly drinking beer, wine and spirits who are able to identify a unit of that drink.
REGULAR DRINKERS OF BEER/WINE/SPIRITS WHO COULD CORRECTLY IDENTIFY A UNIT OF
THAT DRINK26
1997 2009
Drinkers consuming beer at least once a week 54 69
Drinkers consuming wine at least once a week27
67 83
Drinkers consuming spirits at least once a week 57 67
19
Recommended weekly limits have now been replaced by daily alcohol guidelines but the average weekly figures continue to be
used by ONS to provide a consistent measure of alcohol consumption trends (Ibid., p.45)
20
Ibid., p.48 & Table 2.2
21
Ibid., p.51
22
Ibid., Table 2.4
23
NHS Information Centre, Smoking, drinking and drug use among young people in England 2010, 28 July 2011
24
Ibid.
25
Office of National Statistics, Omnibus Survey Report: Drinking: Adults’ Behaviour and Knowledge in 2009, 2010, Table 4.1
26
Ibid., Table 4.9
27
Advice with regards average wine serve size and strength has changed over time. One unit is now considered to be less than a
125ml glass of wine, taking into account an average abv of 12.5%. Previously one small glass of wine was taken to be a unit.](https://image.slidesharecdn.com/guiasalcoholuk-130415104347-phpapp02/85/Guias-alcohol-uk-90-320.jpg)
![cobber Pack: U PL: CWE1 [O] Processed: [03-01-2012 16:31] Job: 015231 Unit: PG03
Science and Technology Committee: Evidence Ev 43
In 2009, just two years after the voluntary industry agreement with government on unit and health labelling,
almost a half—49%—of drinkers who had heard of units had seen unit labelling on alcohol. This is up from
just 23% in 2000.28
Knowledge of drinking guidelines
13. There has also been an increase in the knowledge of daily drinking guidelines of three to four units a
day for men and two to three units for women:
— In 2009, 75% of people had heard of the daily drinking limits, up from 54% in 1997.
Unsurprisingly, those who drink the least are less likely to have heard of these limits.29
— In 2009, 44% of people could correctly identify the recommended limit for men, up from 35%
in 1997.30
— The proportion knowing the female daily limit is up from 39% to 52%.31
Knowledge of health risks
14. A high proportion of people understand the risk of health problems linked to alcohol misuse. In 2009,
96% of people are aware of the risk of accidents and liver disease. The majority of people are aware that
alcohol misuse increases the risk of depression (85%), hypertension (82%), coronary heart disease (77%),
stroke (68%) and pancreatitis (64%).32
Progress still to be made
15. Despite this welcome progress, there is still work to be done to promote sensible drinking and encourage
people to use the advice they are being given. For a minority, alcohol misuse and drinking in excess of
recommended guidelines remains a problem.
16. For example, still too few people monitor the number of units they are drinking. The proportion of
people who keep a daily or weekly check on the number of units drunk has fluctuated between 11 and 16%
since 1997.33
17. Similarly, despite CMO advice that children should not drink any alcohol until they are at least 15,
underage drinking persists. Significant progress has been made though action to tackle underage purchases of
alcohol, including industry initiatives such as Challenge 21 (on trade) and Challenge 25 (off-trade). However
young people access alcohol from a variety of sources. In 2010, 20% of 11 to 15 year olds who had obtained
alcohol in the previous month said they had been given it by parents.34
Going Further: Industry commitments under the Public Health Responsibility Deal
18. The Public Health Responsibility Deal, launched in March 2011, will go even further towards ensuring
widespread understanding of the recommended drinking guidelines. As Trade Associations, we have been at
the forefront of the work on the alcohol strand of the Deal. WSTA Chief Executive, Jeremy Beadles, is co-
chairman of the Alcohol Network, the group charged with overseeing development of the voluntary alcohol
pledges.
19. By August 2011, more than 200 organisations had signed up to the Deal as a whole, with half supporting
seven collective alcohol pledges to help foster a culture of responsible drinking.35
The Deal represents a long-
term programme of work, with new pledges being developed over the coming months.
20. Existing pledges range from ongoing support for Drinkaware to the development of community initiatives
to tackle alcohol-related issues. Three pledges focussed specifically on communicating sensible drinking
guidelines to consumers are around labelling and unit awareness campaigns.
Labelling commitment
21. Building on the 2007 voluntary labelling agreement, the industry has pledged to include clear unit
labelling, NHS guidelines and a warning about drinking when pregnant on over 80% of alcohol products on
shelves by 2013. The Portman Group has agreed to monitor the industry's implementation of the pledge. Criteria
agreed with the Department of Health will ensure labels display information in a clear and consistent manner.
28
Ibid,. Table 5.7
29
Ibid., p.59
30
Ibid., Table 4.14
31
Ibid.
32
Ibid., Table 6.1
33
Ibid., p.58
34
NHS Information Centre, Smoking, drinking and drug use among young people in England 2010, 28 July 2011, p.3.21
35
Full details of the seven launch pledges and businesses that have signed up can be found at
http://www.responsibilitydeal.dh.gov.uk](https://image.slidesharecdn.com/guiasalcoholuk-130415104347-phpapp02/85/Guias-alcohol-uk-91-320.jpg)
![cobber Pack: U PL: CWE1 [E] Processed: [03-01-2012 16:31] Job: 015231 Unit: PG03
Ev 44 Science and Technology Committee: Evidence
22. Businesses will also be encouraged to include two additional elements, which are the Drinkaware web
address and a responsibility statement such as “drink sensibly” or “know your limits”. Left is an example of
an acceptable label format.
Unit awareness campaigns
23. There will be two separate, but coordinated, campaigns in the on and off trades to increase consumer
awareness of units, NHS drinking guidelines and health harms related to alcohol. The BBPA and WSTA will
work in partnership with Drinkaware to develop the two respective campaigns. The off-trade campaign will
draw on material produced for use in pubs and clubs in order to provide consistent messaging wherever alcohol
is being consumed.
24. In the on-trade, campaign materials are in the process of being piloted in selected BBPA member pubs.
These include newly designed posters, tent cards and beer mats featuring the slogan “how many units in your
drink?” The materials adopt a “2–2-2–1” approach, to show the units in a typical pint of 4% abv beer, a typical
330ml bottle of 5% beer, a 175ml glass of 12% wine, and a 25ml single serve of a 40% spirit. The design
follows extensive research conducted with consumers and retailers in partnership with Drinkaware.36
How many units
in your drink?
KNOW YOUR LIMITS
UK Chief Medical Officers recommend
adults do not regularly exceed
Men 3-4 units daily
women 2-3 units daily
DRINKAWARE.CO.UK
1.7
UK
Units
Question 4: How do the UK Government’s guidelines compare to those provided in other countries?
25. Many countries have recommended drinking guidelines. However there is no international consensus on
what constitutes a sensible daily limit or indeed how a unit of alcohol is measured—the average ranges between
8 and 14 grams of pure ethanol. Many countries have a maximum recommended gram intake per day without
defining a unit. This makes international comparisons of recommended drinking advice difficult.
26. The International Centre for Alcohol Policies compiles information on recommended drinking guidelines
from around the world. A simplified version of the ICAP table is reproduced below, with the countries
approximately ranked according to the recommended daily consumption for men in terms of grams of
alcohol.37
This demonstrates that there is considerable variance in sensible drinking guidance offered
worldwide. With its guideline of 3–4 units of alcohol a day for men, equivalent to 24–32g of alcohol, the UK
is roughly mid-table, with a higher limit than the USA and Australia but lower than European neighbours such
as Italy.
27. It should be noted that there does not appear to be a correlation between recommended drinking
guidelines and consumption patterns. For example, countries such as Germany and Ireland have higher overall
alcohol consumption but similar recommended daily guidelines to the UK. Italy and Netherlands have lower
overall alcohol consumption but higher recommended guidelines. 38
36
BBPA Press Release, 11 July 2011
37
A full list can be found at International Centre for Alcohol Policies: http://www.icap.org/table/InternationalDrinkingGuidelines
38
Consumption data taken from International Centre for Alcohol Policies, Issues Briefings: The Taxation of Beverage Alcohol,
2009, Table 1](https://image.slidesharecdn.com/guiasalcoholuk-130415104347-phpapp02/85/Guias-alcohol-uk-92-320.jpg)
![cobber Pack: U PL: CWE1 [O] Processed: [03-01-2012 16:31] Job: 015231 Unit: PG03
Science and Technology Committee: Evidence Ev 45
INTERNATIONAL COMPARISONS OF RECOMMENDED ALCOHOL CONSUMPTION GUIDELINES:
COUNTRIES RANKED ACCORDING TO MALE DAILY GUIDELINES
Country Unit/ Men Women
(ranked standard
low to high) drink
Japan 19.75g 1–2 units/day (19.75–39.5g/day)
United States 14g 1–2 units/day (14–28g/day), not to 1 unit/day (14g/day), not to exceed
exceed 14 units/week (196g/week) 7units/week (98g/week)
Australia 10g no more than 2 standard drinks (20g) no more than 2 standard drinks on
on any day reduces lifetime risk any day
Poland 10g 2 units/day (20g/day) up to 5 times/ 1 unit/day (10g/day) up to 5 times/
week (not to exceed 100g/week) week (not to exceed 50g/week)
Slovenia N/A not to exceed 20g/day and 50g/ on a not to exceed 10g/day and not to
drinking occasion exceed 30g/drinking occasion
Sweden N/A not to exceed 20g/day not to exceed 20g/day
Czech N/A less than 24g per day less than 16g per day
Republic
Austria 10g 24g pure ethanol per day 16g pure ethanol per day
Finland 11g not to exceed 15 units/week (165g/ not to exceed 10 units/week (110g/
week) [equivalent to 24g a day] week)
Germany not to exceed 24g/day not to exceed 12g/day
United 8g should not regularly drink more should not regularly drink more
Kingdom than 3–4 units/day (24–32g/day) than 2–3 units/day (16–24g/day)
Canada 13.6g not to exceed 2 units per day (27.2g/ not to exceed 2 units/day (27.2g/day);
day); 14 units per week (190g/week) 9 units per week (121.5g/week)
Portugal 14g 2–3 units/day (28–42g/day) 1–2 units/day (14–28g/day)
(unofficial)
Spain 10g not to exceed 3 units/day (30g/day) not to exceed 3 units/day (30g/day)
New Zealand 10g not to exceed 3 units/day (30g/day), not to exceed 2 units/day (20g/day),
21units/ week (210g/week) 14 units/week (140g/week)
France 10g not to exceed 30g/day not to exceed 30g/day
Ireland 10g 21 units/week (210g/week) [equivalent 14 units/week (140g/week)
to 30g a day]
Romania N/A not to exceed 32.5g beer/day or 20.7g not to exceed 32.5g beer/day or 20.7g
wine/day wine/day
Denmark 12g not to exceed 21 alcohol units (252g) a not to exceed 14 (168g) units a week
week [equivalent to 36g a day]
South Africa N/A not to exceed 21 units/week (252g/ not to exceed 14 units/week (168g/
week) [equivalent to 36g a day] week)
Nether-lands 9.9g not to exceed 4 units/day (39.6g/day) not to exceed 2 units/day (19.8g/day)
Italy 12g less than 40g per day less than 40g per day](https://image.slidesharecdn.com/guiasalcoholuk-130415104347-phpapp02/85/Guias-alcohol-uk-93-320.jpg)
![cobber Pack: U PL: CWE1 [E] Processed: [03-01-2012 16:31] Job: 015231 Unit: PG03
Ev 46 Science and Technology Committee: Evidence
recommend adults do not regularly
exceed
Men 3-4 units a day
Women 2-3 units a day
(x)
UK
Units
www.drinkaware.co.uk
Drink Responsibly
Number of UK units in
the container
( x - insert the correct number
of units for your drink)
Drinkaware
logo or website
(optional)
Pregnancy logo or
wording (‘Avoid alcohol
if pregnant or trying to
conceive’)
Responsibility
message
(optional)
Government safe
drinking guidelines
Information in a
boxed format
Supplementary written evidence submitted by The British Beer & Pub Association, The National
Association of Cider Makers,The Scotch Whisky Association and The Wine and Spirit Trade
Association (AG08a)
September 2011
Written evidence submitted by Dr Richard Harding (AG 13)
1. I was a member of the Inter-Departmental Working Group on Sensible Drinking, which reported in
December 1995.1
This Working Group was set up in 1994 to review the Government’s sensible drinking
message in the light of the latest evidence which indicated that drinking alcohol might give protection from
coronary heart disease.
2. The terms of reference for the Group were:
(i) to review the current medical and scientific evidence and its interpretation on the long term effects of
drinking alcohol; and
(ii) to consider whether the sensible drinking message should be reviewed in the light of this, also taking
into account current Government policies on the short term effects of drinking alcohol and any other
factors considered relevant by the Group.
3. The Working Group comprised officials from a range of Government Departments with an interest in
Government policy on alcohol. At the time I worked in the Consumers and Nutrition Policy Division in the
Ministry of Agriculture, Fisheries and Food. I hold qualifications in chemistry, food science and law, and I
worked for a number of years in the food industry before joining the Ministry of Agriculture, Fisheries and
Food in 1975. I subsequently moved to the Food Standards Agency on its creation in 2000, and left Government
service in 2006.
4. In preparation for this 1995 review, I read the scientific literature extensively and met with leading experts
in the UK, USA and France.
5. The four questions posed by the Committee are addressed in turn.
What evidence are Government’s guidelines on alcohol intake based on, and how regularly is the evidence
base reviewed?
6. The sensible drinking message in 1994 was that drinking less than 21 units per week by men and 14 units
per week for women is unlikely to damage health. It was by no means clear at the time on what evidence this
advice was based, so the Working Group examined in detail the evidence for both harmful effects and beneficial
effects of alcohol consumption, and then to reflect both aspects of alcohol consumption in a public health
message. The Working Group also had the benefit of 89 submissions and took oral evidence from six experts
in the field. To my best knowledge the current alcohol guidelines are based on this analysis of the evidence](https://image.slidesharecdn.com/guiasalcoholuk-130415104347-phpapp02/85/Guias-alcohol-uk-94-320.jpg)
![cobber Pack: U PL: CWE1 [O] Processed: [03-01-2012 16:31] Job: 015231 Unit: PG03
Science and Technology Committee: Evidence Ev 47
base, since I am not aware of any subsequent analysis. The Committee will be able to read the Report on
Sensible Drinking for themselves, but here is a summary.
Harmful Effects of Alcohol
7. This is set out in Chapter 6 of the Report, and covers the following topics.
Intoxication
8. Clearly much alcohol related harm resulted from intoxication, from accidents and social harm.
Cirrhosis of the liver
9. Long-term heavy drinking increases the risk of liver cirrhosis.
Cancer
10. The advice of the Department of Health’s Expert Committee on Carcinogenicity was sought, and their
conclusions are set out in the Report.
Hypertension
11. It was known that alcohol consumption increases blood pressure, to the extent of 1–2mm for each 10g/
day. However, it was also clear that moderate consumption of alcohol was overall protective for most of the
chronic diseases (except haemorrhagic stroke) for which high blood pressure is a risk factor.
Haemorrhagic Stroke
12. The studies showed that there was an increase in risk of haemorrhagic stroke with alcohol consumption,
from a consumption of of 16g/day (2 units).
Reproduction, Pregnancy and Infant Development
13. The advice of the Department of Health’s Expert Committee on Toxicity was sought, and their
conclusions are set out in section 6.19 of the Report.
Mental Illness and Neurological Disorders
14. Extremely heavy drinking (consumption of over 80g/day) over long periods of time was strongly
associated with a number of significant psychiatric disorders, notably depression and suicide, and with
psychological and physical dependence.
Beneficial Effects of Alcohol
15. Many population studies since the early 1970s had shown a marked beneficial effect of moderate
consumption of alcohol, for a number of conditions. Most studies showed a J or U shaped curve, ie a marked
drop in risk compared to abstainers for low levels of consumption (1–2 units/day), then the benefit is sustained
over an increased level of consumption (typically 3–4 units/day for men, more in some studies), and then a
progressive increase in risk as alcohol consumption increases.
Coronary Heart Disease (CHD)
16. The size of benefit is significant, with moderate consumers enjoying a drop in risk of 30–50% compared
with abstainers. An early finding (1972) of the Framingham study in the USA identified abstinence from
alcohol as one of the four major risk factors for CHD, along with high blood cholesterol, high blood pressure
and smoking. The researchers were prevented from publishing this at the time.2
17. There were convincing hypotheses to explain this benefit, of which two seemed to be the most important.
Alcohol consumption increases HDL cholesterol (“good cholesterol”), thereby lowering the HDL/LDL ratio
and inhibiting formation of coronary artery atheroma. Further, alcohol directly affects advantageously a number
of mechanisms associated with blood clotting and thrombosis, thereby inhibiting a heart attack.
Ischaemic Stroke
18. As with CHD, moderate drinkers had a 50% reduction in risk compared to non-drinkers, because of the
same mechanisms.
Gallstones
19. The studies showed that moderate alcohol consumption up to 40g/day (5 units) confers protection against
cholesterol gallstones.](https://image.slidesharecdn.com/guiasalcoholuk-130415104347-phpapp02/85/Guias-alcohol-uk-95-320.jpg)
![cobber Pack: U PL: CWE1 [E] Processed: [03-01-2012 16:31] Job: 015231 Unit: PG03
Ev 48 Science and Technology Committee: Evidence
Other benefits
20. The studies also showed that moderate alcohol consumption conferred protection against other forms of
heart disease (eg peripheral vascular disease). The studies also showed that alcohol consumption in the range
of 15–40g/day (2–5 units) reduced the risk of type 2 diabetes (formerly known as non-insulin dependent
diabetes mellitus). There were also indications that alcohol consumption increased bone mineral density by
10–20%, thereby conferring protection against osteoporosis.
General Public Health Advice
21. The basic rationale for previous public health messages on alcohol seemed to be that alcohol was
fundamentally undesirable in society, and consumption should be generally discouraged, but if people choose
to drink, then consumption of 21 units (168g)/week for men and 14 units (112g)/week for women should not
do too much harm. Further, the advice was to abstain from alcohol for two days a week.
22. The Working Party took a different approach. Clearly excessive consumption of alcohol does a great
deal of social and public health damage in society through intoxication and any public health message must
address that. Further, long term excessive consumption leads to serious chronic disease and death through liver
cirrhosis, some cancers, high blood pressure, cardiovascular disease, addiction, mental illness, and obviously
should be similarly strongly deterred. Additionally, the evidence for the beneficial effects of moderate
consumption was sufficiently strong to warrant inclusion.
23. The Working Party also considered the Whole Population Theory as applied to alcohol, first proposed
by the French mathematician Ledermann. He argued that there was a fixed relationship between average per
capita consumption of alcohol, the number of heavy drinkers in the population and the amount of alcohol
related harm. He predicted that doubling or tripling average consumption would lead to a four or nine fold
increase in the number of problem drinkers. This led to the idea of manipulating average consumption through
price and access controls to reduce the incidence of problem drinking. It had been argued3
that the purpose of
a sensible drinking message should be to bring down everyone’s level of consumption so as to prevent increase
in the numbers of heavy drinkers—in other words, moderate drinkers need to reduce their consumption (or not
increase it) in order to prevent someone else from becoming a problem drinker, because the mean would
increase. The Working Party noted that there are examples, like that of drinking and driving, which show that
public education can change undesirable behaviour without lowering the level of drinking by the population
as a whole.
24. There were, and are, sound grounds for different advice to men and women. On average women weigh
less than men, they have proportionately more body fat, and metabolise alcohol more slowly. Women also have
differences in patterns of pathology disease compared with men, and in relation to coronary heart disease, are
protected by their hormones until the menopause. Further, alcohol (other than at very low levels) was associated
with particular risks to fetal and early development. Evidence was also emerging of an association of alcohol
consumption with breast cancer. The Working Group advised that if further evidence of this association
emerged, the relationship between alcohol and breast cancer should be kept under careful review.
25. While the evidence can support benchmarks to enable people to monitor their own drinking levels, there
is large variation among individuals, for example, in body weight. Further, the scientific evidence itself did not
and does not support rigid limits that are universally applicable. Therefore advice couched as a range of intake
can be justified but rigid limits cannot.
26. The Working Party thought it sensible to move away from advice based on weekly consumption in
favour of daily consumption. Weekly drinking can mask episodes of heavy drinking (21 units/week could be
consumed in two binges of 10 units each). Further, it is difficult for individuals to keep account of their own
consumption over a week, having to remember what they drank a few days earlier. Also, there was evidence
that showed there could be benefit in regular drinking, so long it is moderate. Therefore the Working Party
decided to couch advice in terms of daily drinking.
27. Paragraphs 10.19 to 10.30 of the Report set out the conclusions of the Working Party’s work. There are
three main elements.
(i) redefining the benchmarks for sensible drinking (paras 10.19 to 10.20);
(ii) reducing the episodes of excessive drinking and intoxication (paras. 10.23–10.24); and
(iii) supplementing (i) and (ii) with specific messages addressed to particular groups of the population or
people drinking in particular settings (paras. 10.25–10.28).
28. The central advice on sensible drinking was as follows:
Men
— The health benefit from drinking relates to men aged over 40 and the major part of this can be
obtained at levels as low as one unit a day, with the maximum health advantage lying between 1
and 2 units a day.
— Regular consumption of between 3 and 4 units a day by men of all ages will not accrue significant
health risk.](https://image.slidesharecdn.com/guiasalcoholuk-130415104347-phpapp02/85/Guias-alcohol-uk-96-320.jpg)
![cobber Pack: U PL: CWE1 [O] Processed: [03-01-2012 16:31] Job: 015231 Unit: PG03
Science and Technology Committee: Evidence Ev 49
— Consistently drinking 4 or more units a day is not advised as a sensible drinking level because of
the progressive health risk it carries.
Women
— The health benefit from drinking for women relates to postmenopausal women and the major part
of this can be obtained at levels as low as one unit a day, with the maximum health advantage
lying between 1 and 2 unit a day.
— Regular consumption of between 2 and 3 units a day by men of all ages will not accrue significant
health risk.
— Consistently drinking 3 or more units a day is not advised as a sensible drinking level because of
the progressive health risk it carries.
Changes to the Sensible Drinking Message Since 1995
29. A campaign followed the publication of the Sensible Drinking Report in 1995, with the message, “There
is more to a drink than you think.” However, the message on the beneficial aspects of moderate consumption
was dropped within a few years of 1995, but to my knowledge this was not on the basis of any new review of
the evidence or ministerial decision.
Evidence that has Emerged Since 1995
30. There is a considerable body of evidence on the effect of moderate alcohol consumption on disease that
has emerged since 1995. A summary of the current position can be found in a chapter in a recent book.5
The
key findings are:
— Clear evidence that the frequency of drinking is as important as, or even more important than, the
amount of alcohol consumed. All epidemiological studies show that the more frequent drinkers,
including daily drinkers, have lower risks for many diseases than do individuals reporting less
frequent drinking. Further, data are increasingly demonstrating harmful biological effects (as well
as the well known adverse social effects) of “binge drinking”, based on the number of drinks
consumed per occasion or the rate at which alcohol is consumed.
— Firmer evidence for the protective effect of moderate alcohol consumption for coronary heart
disease, as well as further clarification of the mechanisms for the protective effect.
— Evidence for an approximately 30% reduction in risk for type 2 diabetes for moderate drinkers.
— Evidence that moderate drinkers have less osteoporosis and a lower risk of fractures in the elderly
compared to abstainers.
— Evidence that light to moderate drinking is associated with a significantly reduced risk of dementia
in older people.
— Evidence that drinkers may have a somewhat increased risk of breast cancer in comparison with
abstainers.
— Increasing evidence that moderate drinking should be considered as an important constituent of a
“healthy lifestyle”. A recent US study6
found that four characteristics of a healthy lifestyle (never
smoked, healthy diet, adequate physical activity, and moderate alcohol consumption) were each
significantly associated with less disability and a reduced risk of mortality. Those who adopted all
four characteristics were chronologically 11 years younger than those who had none. This is
consistent with an earlier UK study,7
where the figure was 14 years.
Could the evidence base and sources of scientific advice to Government on alcohol be improved?
31. All of the relevant information is published in the literature. What is needed is a mechanism that brings
it all together in a fair and balanced way, so that sensible public health messages can be crafted. Within the
medical profession, alcohol tends to be dealt with by those who specialise in alcohol misuse and addiction,
and therefore the public health messages that emerge tend to be from that perspective and that perspective
alone. Doctors seem to be influenced more by those who walk through their consulting room doors rather than
those who do not. While not wishing to diminish the enormous importance of alcohol misuse to public health
policy, it is not the whole story. The challenge is to reduce alcohol-related harm in the population as a whole,
while at the same time taking advantage of the beneficial aspects of the moderate consumption of alcohol. The
UK has a growing and aging population. The chronic diseases for which moderate alcohol consumption offers
significant protection are coronary heart disease, ischaemic stroke, type 2 diabetes, osteoporosis, and dementia.
These are the common diseases of aging. The potential gain is large both for public health, the health of
individuals, and the public purse.
32. The time is certainly overdue for a review of the relationship between alcohol consumption and disease.
Much has been published since 1995, and it all needs to be brought together by a multidisciplinary team,
involving experts in the appropriate fields—eg alcohol misuse, epidemiology, public health, heart disease,
dementia, and social science—who are knowledgeable about the current scientific data and who are capable of
taking a broad overview.](https://image.slidesharecdn.com/guiasalcoholuk-130415104347-phpapp02/85/Guias-alcohol-uk-97-320.jpg)
![cobber Pack: U PL: CWE1 [E] Processed: [03-01-2012 16:31] Job: 015231 Unit: PG03
Ev 50 Science and Technology Committee: Evidence
How well does the Government communicate its guidelines and the risks of alcohol intake to the public?
33. In the short term, giving guidance to specific groups in the general population (men, women, young
people, middle aged and the elderly) is probably the best governments can do. In the longer term, Government
could try to effect a culture change in society’s attitudes to alcohol, eg to make intoxication more socially
unacceptable, in much the same way as attitudes to drinking and driving have changed over the past 50 years.
How do the Government’s guidelines compare to those provided in other countries?
34. World-wide recommendations on alcohol consumption show wide disparity among countries.4
This is in
some ways surprising, given that the science is the same everywhere. But the objective of those who frame
such guidance is to influence their target populations. It follows therefore that several factors then become
relevant, eg the behaviour that is thought to be in need of change, the culture and mindset of the target
population, and the kind of message that is likely to be effective.
35. Therefore the best approach is to formulate advice firmly based on and argued from the science, but that
which is also appropriate to the problems that the UK face and is likely to be effective, and not to take much
notice of what other governments or health bodies recommend.
Declaration of Interest
36. Since leaving Government, I have worked as a consultant, including one study for the wine industry on
labelling in 2007, but I have done no work on the health aspects of alcohol consumption. Further, I am not
seeking further consultancy work. I have given presentations on alcohol and health at two international
conferences for which my flights and hotel were provided, but I received no fee.
September 2011
References
1. Sensible Drinking. Report of an Inter-Departmental Working Group. Department of Health 1995. ISBN 1
85839 621 2
2. Selzer, C C. “Conflicts of Interest” and “Political Science”. Journal of Clinical Epidemiology 50(5),
627–629 (1997).
3. Alcohol and the heart in perspective—Sensible limits reaffirmed. Report of a joint working group. Royal
College of Physicians, Royal College of Psychiatrists, Royal College of General Practitioners. June 1995. ISBN
1 86016 019 0.
4. Harding, R and Stockley, C. Communicating through Government Agencies. Annals of Epidemiology 2007;
17: S98-S102.
5. Ellison, R C. Effects of Alcohol on Cardiovascular Disease Risk. Chapter 18 of “Preventive Cardiology:
Companion to Braunwald’s Heart Disease by Blumenthal”, R, Foody, J, Wong, N. 2011, Elsevier. ISBN
978–1-4377–1366–4.
6. Ford, ES, Zhao, G, Tsai, J, Chaoyang, L. Low-Risk Lifestyle Behaviors and all-cause mortality: Findings
from the National Health and Nutrition Examination Survey III Mortality Study. American Journal of Public
Health 18 August 2011: e1-e8. doi:10.2105/AJPH.2011.300167.
7. Khaw, K-T, Wareham, N, Bingham, S, Welsh, A, Luben, R, Day, N. Combined impact of health behaviours
and mortality in men and women: The EPIC-Norfolk Prospective Population Study. PLoS Med. 2008; 5(1):e12.
Supplementary written evidence submitted by Dr Richard Harding (AG 13a)
1. At the oral evidence session on Wednesday 12 October, a number of issues arose on which I would like
to comment further.
The Cardio-Protective Effect of Moderate Alcohol Consumption
2. There are two separate bodies of evidence for the cardio-protective effect of moderate alcohol
consumption. These are observation studies, based on observation of subjects over time, and the effect of
alcohol consumption on biological markers for coronary heart disease in humans and in animals.
The observational studies
3. Professor Heather has drawn my and the Committee’s attention to the work of Professor Kaye Fillmore,
and a further paper by Tanya Chikrtzhs, a co-author of Professor Fillmore’s paper.
4. When evidence for the cardio-protective effect emerged in the 1970s and 1980s, Shaper1
suggested that
the considerable apparent benefit conferred by moderate alcohol consumption compared with abstainers could](https://image.slidesharecdn.com/guiasalcoholuk-130415104347-phpapp02/85/Guias-alcohol-uk-98-320.jpg)
![cobber Pack: U PL: CWE1 [O] Processed: [03-01-2012 16:31] Job: 015231 Unit: PG03
Science and Technology Committee: Evidence Ev 51
be explained by the abstainer category containing persons terminating or decreasing their alcohol consumption
to very occasional drinking—in other words, previous heavy drinkers. Further, as people age and become ill
or frail or increase use of medications, their alcohol consumption decreases, some abstaining altogether. If
these people are included in the abstainer category, then it is not the absence of alcohol that is elevating their
risk of coronary heart disease (CHD), but, rather, their compromised health. This is the “sick quitter”
hypothesis.
5. This hypothesis has been taken seriously by the epidemiological community. Some analysts strove to
correct for it by excluding ex-drinkers from the abstainers category, and by including only life-long abstainers.
A meta-analysis2
of seven studies concluded that the “sick-quitter” hypothesis had been eliminated, and by the
mid-1990s the hypothesis was relegated, by most, to history.
6. About 10 years later Professor Fillmore revisited this hypothesis, and re-examined the classification of
“abstainers” in 54 epidemiological studies for two characteristics, which she called “errors”. These were:
— inclusion of former drinkers (no drinks in the past year) in the abstainer category, and
— inclusion of occasional drinkers (one drink a month or less) in the abstainer category.
Professor Fillmore’s concerns were that former drinkers might include those whose health had been damaged
by alcohol and had given up, and occasional drinkers may include those who have decreased their consumption
because of age or infirmity. Only two studies relating to CHD of were found free of these characteristics, and
these remaining two studies found no significant cardio-protective effect. It is impossible to draw any general
conclusions from two studies.
7. I was present at a scientific meeting in 2006 when Professor Fillmore presented her work. In the report
of the following discussion (which has been published),3
other workers had no concerns about including
occasional drinkers in the abstainer group, since they had found that these drinkers had the essentially the same
risk as lifetime abstainers. There was agreement that it was inappropriate to use “sick quitters” as controls.
8. In her paper4
that was published following this meeting, Professor Fillmore stated that her own group’s
position on the health benefits of alcohol resulted from extensive discussion among themselves and what
seemed to be a herculean effort to eliminate—rather than prove—the “sick quitter” hypothesis. On the basis of
fine contributions of laboratory science demonstrating plausible and real mechanisms for cardiac protection,
their conclusion is that alcohol (among other substances, lifestyles and behaviours) conveys benefit to the heart.
But, she said, the lot falls to epidemiology to demonstrate whether the population actually does benefit.
9. Many epidemiological papers published since 2006 had data permitting them to include only lifetime
abstainers in the reference category, and have found a marked and significant cardio-protective effect for those
drinkers in the light to moderate category. Fuller5
re-examined the data from a major US study in a way that
avoided the potential pitfalls described by Fillmore, and found a protective effect for moderate consumption
compared to abstainers. A recent comprehensive meta-analysis by Ronksley et al6
in the British Medical Journal
describes in detail how earlier objections have been dealt with, and concluded that consumption levels up to
15g/day (nearly two UK units) were associated with about 25% reduction in risk of cardiovascular disease
mortality. It seems to be clear that epidemiology has demonstrated that the population actually does benefit.
Effect of alcohol consumption on biological markers for coronary heart disease
10. As I mentioned when giving oral evidence, at the time of the 1995 Report on Sensible Drinking, the
biological markers accepted at the time were essentially the increase in high density lipoprotein cholesterol
(HDL-C) and the beneficial effect on clotting factors. There have since been many hundreds of experimental
studies showing numerous other mechanisms by which moderate alcohol consumption lowers the risk of
atheroscerosis and coronary heart disease. A recent review in the British Medical Journal by Brien et al7
described 21 of these mechanisms. The conclusion of this study is there is compelling, indirect evidence in
support of a causal protective effect of alcohol for coronary heart disease. Another recent review by Collins et
al.8
on the effect of alcohol consumption on biomarkers concluded that there is convincing evidence that light-
moderate, non-binge alcohol intake reduces the risk of CHD.
11. One of the most important of these mechanisms remains the elevation of HDL-C. It is important because
the ratio of low density lipoprotein cholesterol (LDL-C) to HDL-C a much better indicator of CHD risk than
total cholesterol concentration. HDL-C removes LDL-C from the bloodstream and transports it to the liver, so
a high level of HDL-C is desirable. People with high level of total cholesterol but favourable ratio have a
lower risk of disease than those with a low level of total cholesterol and poor ratio. Apart from choosing your
own grandparents, there are essentially two lifestyle changes anyone can make which would increase HDL-
C—taking exercise and drinking alcohol. A physical activity level equivalent to 60 minutes/day of leisure time
activity (walking, climbing stairs, jogging) raises HDL-C by about 7%, whereas up to 7–14 drinks/week raises
it by about 20% 9
in men. With a rise in HDL-C of that magnitude, it would be astonishing if moderate alcohol
consumption did not markedly affect CHD risk.](https://image.slidesharecdn.com/guiasalcoholuk-130415104347-phpapp02/85/Guias-alcohol-uk-99-320.jpg)
![cobber Pack: U PL: CWE1 [E] Processed: [03-01-2012 16:31] Job: 015231 Unit: PG03
Ev 52 Science and Technology Committee: Evidence
The Chikritzhs Paper
12. This paper raises four concerns:
— misclassification error—already commented on above;
— confounding;
— self-report, recall bias and drinker “drift”; and
— drinking patterns.
13. Confounding. The argument here is that those who drink alcohol in moderation also are likely to be
those who also live healthy lifestyles, and therefore it is to expected that they will have lower levels of
cardiovascular disease compared to abstainers. What is more, it is impossible to correct for all possible
confounding factors.
14. This point is essentially about causation, ie epidemiological studies only identify associations, and can
never establish causation. It is possible that other factors, or combination of factors, can explain the apparent
protection observed. Bradford-Hill identified10
a number of factors which should be considered when assessing
whether an association is causative. I quote directly from the recent paper by Ronksley et al,6
already cited
above, on this point.
15. “The lingering question is whether this association is causal. Clearly, observational studies cannot
establish causation. However, when the present results are coupled with those from our companion review
paper7
summarising intervention mechanistic studies focusing on biomarkers associated with cardiovascular
disease, the argument for causation becomes more compelling. Indeed, the mechanistic biomarker review
shows biological plausibility for a causal association by showing favourable changes in pathophysiologically
relevant molecules.
Therefore, we can now examine the argument for causation based on Hill’s criteria.10
Beyond the biological
plausibility argument discussed above, there is an appropriate temporal relation with alcohol use preventing
cardiovascular disease. Secondly, we have observed a greater protective association with increasing dose,
except that it seems to be offset somewhat by negative associations with the risk of haemorrhagic stroke.
Thirdly, the protective association of alcohol has been consistently observed in diverse patient populations in
both men and women. Fourthly, the association is specific: moderate drinking (up to one drink or 12.5g alcohol
per day for women and two drinks or 25g alcohol per day for men) is associated with lower rates of
cardiovascular disease but is not uniformly protective for other conditions such as cancer. Lastly, the reduction
in risk is notable even when controlling for known confounders (such as smoking, diet and exercise). Any
potential unmeasured confounder would need to be very strong to explain away the apparent protective
association.”
16. Finally, some observational studies can isolate those in their study population those with the healthiest
combination of lifestyles. In my first submission (paragraph 30, final bullet), I pointed out that moderate alcohol
consumption is now identified as one element of a healthy lifestyle (along with lifetime non-smoking, a healthy
diet and physical activity) by researchers who are exploring the concept of “successful ageing”. The mortality
risk for those with all four lifestyle characteristics was significantly lower than who had three, but were
abstainers. Others have reported that for the most healthy members of society, moderate alcohol consumption
can make them healthier. Mukamal11
explored exactly this issue, and found that for those who were already at
a low risk of cardiovascular disease (on the basis of body mass index, physical activity, smoking and diet),
moderate alcohol consumption lowered the risk much further. Joosten et al12
reported, “In subjects already at
lower risk of type 2 diabetes on the basis of multiple low-risk lifestyle behaviors, moderate alcohol consumption
was associated with an approximately 40% lower risk compared with abstention.” So among the healthiest
people, those who consume alcohol moderately have much better health outcomes, and the major confounding
factors are therefore not playing a role.
17. Self-report, recall bias and drinker “drift”. Finding out how much alcohol people drink is really quite
difficult. It is true that people generally under-estimate their consumption, and the best that researchers can do
is rely on questionnaires. As Professor Fillmore says,4
“It should not be forgotten that epidemiology deals with
crude approximations, beset by confounding—often unmeasured—especially when single estimates or limited
measurements are used.” Yet despite these inbuilt sources of inaccuracy, which would tend to weaken any
protective effect, studies around the world consistently find that the cardio-protective effect of moderate
consumption is still apparent.
18. Drinking patterns. Yes, drinking patterns are very important to health outcomes, and there will be great
variation among the drinkers in any study. In studies that have had data on the pattern of drinking, subjects
consuming alcohol on a regular basis consistently have better health outcomes than subjects who consume
alcohol only on one or two days per week, usually in a binge-drinking pattern. But again, despite lack of
information on the pattern of drinking in many other studies, the protective effect of alcohol is still apparent
from them.](https://image.slidesharecdn.com/guiasalcoholuk-130415104347-phpapp02/85/Guias-alcohol-uk-100-320.jpg)
![cobber Pack: U PL: CWE1 [O] Processed: [03-01-2012 16:31] Job: 015231 Unit: PG03
Science and Technology Committee: Evidence Ev 53
Other Points that arose in the Oral Evidence Session
The Australian approach
19. I have seen the Australian Alcohol Policy Coalition Position Statement on Cancer, Cardiovascular
Disease and Alcohol Consumption, September 2011.13
I realise that the Coalition is only concerned with
reducing the level of alcohol misuse in Australia, but I am afraid that in my view it is not the result of a sound,
balanced and up to date appraisal of the science, but is misleading and a misrepresentation of the actual
position. As such is it not a proper basis for policy.
Q11
20. I gave an unsatisfactory response to Pamela Nash’s question, “Would you advocate the guidelines being
reinforced by the evidence base?” I said I would not change them, which is true, but I did not explain why. It
is not really a question of the guidelines being reinforced by the evidence base, because in the 1995 Sensible
Drinking report, the guidelines were transparently argued from the evidence base. The evidence base has grown
over time, and so the question is whether any new evidence changes the rationale for the guidelines. My view
is that the current evidence base has reinforced the existing guidelines rather than undermined them, hence
my answer.
21. The current guideline range of consumption, 1–4 units/day for men and 1–3 units/day for women,
coincided broadly with the bottom of the all-cause mortality curve. For men over 40 and post-menopausal
women, risk increases therefore for consumption on either side of this range, both higher and lower. Hence
also the advice for these people to consider drinking 1–2 drinks/day if they wished to take advantage of the
beneficial effects. For younger people, provided the anti-intoxication messages were respected and alcohol was
consumed responsibly, there did not appear to be any significant health risk which would accrue at this level
of consumption.
Q13
22. In an answer on how messages should be conveyed to the public, Professor Heather advised that there
should be both daily and weekly limits that should never be exceeded, and advocated a return to the old weekly
limits. The weekly “limit” of 21 units for men and 14 units for men were the UK Guidelines before the 1995
Report. The basis for these limits was never clear to me. It was never clear to me. The Joint Royal Colleges
Report published in June 1995, which I cited in my first submission, was entitled, “Alcohol and the Heart in
Perspective, Sensible Limits Confirmed”, and yet, despite the title, nowhere in that report was I able to find
any justification for limits of 21 and 14 units/week for individuals. But it is clear from the Joint Royal Colleges
Report that the concern was the need to reduce the mean level of consumption, and, although acknowledging
the cardio-protective effect, advised against raising the “sensible limits” because there would be an adverse
effect on public health.
23. As the summary of this Report explains on page 1, if the mean increases, the proportion of people
drinking in the higher risk categories is likely to increase, with a consequent increased risk of alcohol associated
harm. This is the so-called “whole population theory”, and was addressed in the 1995 Report on Sensible
Drinking Report in paragraphs 9.2–9.4. Essentially it requires the whole population to conform to a mean level
of consumption in order that there are fewer drinkers at the higher end of consumption, which is where most
of the misuse is.
24. The problem with this is that public health messages on alcohol are addressed to populations, but received
by individuals, and those individuals are encouraged to believe that following this advice will benefit their
health. But this is not necessarily the case if the purpose of the advice is to peg individual consumption to a
particular population mean so that other people, towards the end of the graph, are less likely to misuse alcohol.
It seems to me that this is manipulative, and in my view any advisory level of intake justified on this basis is
politically indefensible. That is why, in my response in oral evidence to Question 2 on the purpose of alcohol
guidelines, I said that the guidelines should be meaningful to adults as individuals.
Alcohol and cancer
25. In her response to Question 11, Dr Morgan cited the International Agency for Research on Cancer Report
on Alcohol Consumption, and said that it included a statement that there is clear evidence of about 10%
increase in the risk of cancer for every 10g of alcohol/day. I believe that she meant to say breast cancer, rather
than all or any other cancer. I could not find that statement in the IARC Monograph, but the data presented
there seems to suggest the figure is in the 5%–10% range for breast cancer. On page 1271, it says, “for regular
consumption of 18g/day, the relative risk is still significantly increased at 1.13”, which equates to 7% per
10g/day.
26. I would like to draw the Committee’s attention to the transcript14
of an interview given on the BBC
Radio 4 programme “More or Less” in May 2009 with Professor David Spiegelhalter, Winton Professor of the
Public Understanding of Risk at Cambridge University. He was talking about alcohol and cancer in the context
of the Million Women Study,15
and I drew in part from his comments in my oral evidence. It demonstrates
how important (and difficult) it is to gain a proper perspective on the overall effect of alcohol on public health,](https://image.slidesharecdn.com/guiasalcoholuk-130415104347-phpapp02/85/Guias-alcohol-uk-101-320.jpg)
![cobber Pack: U PL: CWE1 [E] Processed: [03-01-2012 16:31] Job: 015231 Unit: PG03
Ev 54 Science and Technology Committee: Evidence
rather on specific health outcomes, and not be swayed by how the science is reported, even sometimes by the
researchers themselves.
19 October 2011
References
1. Shaper A G, Wannamethee G, Walker M. Alcohol and mortality in British men: Explaining the U-shaped
curve. Lancet 1988; 2:1267–1273
2. Maclure M. Demonstration of deductive meta-analysis: Ethanol intake and risk of myocardial infarction.
Epidemiol. Rev. 1993; 15:328–335
3. Panel Discussion I: Does alcohol consumption prevent cardiovascular disease? Proceedings of an
international conference. Annals of Epidemiology 2007;17: S37-S39.
4. Fillmore, K M, Stockwell, T, Chikritzhs T, Bostrom, A and Kerr, W. Moderate Alcohol use and reduced
mortality risk: Systematic error in prospective studies and new hypotheses. Annals of Epidemiology 2007; 17:
S16-S23
5. Fuller TD. Moderate alcohol consumption and the risk of mortality. Demography 2011. DOI 10.1007/
s13524–011–0035–2
6. Ronksley P E, Brien S E, Turner B J, and Mukamal, K J. Association of alcohol consumption with selected
cardiovascular disease outcomes: a systematic review and meta-analysis. British Medical Journal 2011;
342:d671; doi:10.1136/bmj.d671
7. Brien S E, Ronksley P E, Turner B J, Mukamal K J, and Ghali A G. Effect of alcohol consumption on
biological markers associated with risk of coronary heart disease: systematic review and meta-analysis of
intervention studies. British Medical Journal 2011; 342:d636; doi: 10.1136/bmj.d636
8. Collins M A, Neafsey E J, Mukamal K J, Gray M O, Parks D A, Das K D, and Kortuis R J. Alcohol in
moderation, cardioprotection, and neuroprotection: epidemiological considerations and mechanistic studies.
Alcoholism: Clinical and Experimental Research 2009; 33(2):206–219. DOI: 10.1111/
j.1530–0277.2008.00828x
9. Ellison R C, Zhang Y, Qureshi M M, Knox S, Arnett D K, and Province M A. Lifestyle determinants of
high-density lipoprotein cholesterol: The National Heart, Lung and Blood Institute Family Heart Study.
American Heart Journal 2003; 147: 529–535, DOI: 10.1016/j.ahj.2003.10.033
10. Bradford-Hill A. The environment of disease : association or causation? Proceedings of the Royal Society
of Medicine. 1965; 58:295–300
11. Mukamal K J, Chiuve S E, Rimm E B. Alcohol consumption and risk for coronary heart disease in men
with healthy lifestyles. Archives of Internal Medicine 2006; 166: 2145–2150
12. Joosten M M, Grobbee D E, van der A D L, Verschuren W W M, Hendriks H F J, Beulens J W J.
Combined effect of alcohol consumption and lifestyle behaviors on risk of type 2 diabetes. Am J Clin Nutrition,
published on-line 21 April 2010. doi:10.3945/ajcn.2010.29170
13. Alcohol Policy Coalition Position Statement. Cancer, Cardiovascular Disease and Alcohol Consumption.
September 2011
14. Transcript of an interview with Professor David Spiegelhalter, “More or Less”, BBC Radio 4, 9 May 2009
15. Allen N E, Beral V, Casabonne D, Kann S W, Reeves G K, Brown A, Green J. Moderate alcohol intake
and cancer incidence in women. Journal of the National Cancer Institute 2009; 101(5): 296–30
Written evidence submitted by Drinkaware (AG 18)
1. About Drinkaware
1.1 Drinkaware is an independent, UK-wide charity, which aims to equip people with the knowledge they
need to make informed decisions about how much alcohol they drink. Drinkaware is entirely funded by
voluntary donations from across the drinks industry, but operates completely independently from it. Our
behaviour change campaigns are designed upon an evidence-based approach, and our work is informed by a
panel of experts from across public health and industry.
2. Declaration of Interest
2.1 Drinkaware welcomes the opportunity to submit evidence to this inquiry. As the leading source of alcohol
information for consumers in the UK with more than 225,000 visitors coming to its website every month,
Drinkaware is one of the primary resources consumers turn to for evidence-based advice.](https://image.slidesharecdn.com/guiasalcoholuk-130415104347-phpapp02/85/Guias-alcohol-uk-102-320.jpg)
![cobber Pack: U PL: CWE1 [O] Processed: [03-01-2012 16:31] Job: 015231 Unit: PG03
Science and Technology Committee: Evidence Ev 55
2.2 Unit guidelines are referenced in all of Drinkaware’s campaigns across all communication channels.
We convey the guidance in practical everyday language so people can integrate recommendations into their
everyday lifestyle.
2.3 Drinkaware has worked with the UK Government in communicating unit guidelines. This work has
included coordinating campaigns and messages to reflect Government advice as well as practical partnerships
including mail drops of a “unit and calorie calculator” (Annex 1) to more than 2.3 million households in
support of the Change4Life January 2011 campaign activity.
2.4 This year also saw the launch of MyDrinkaware, an online drink diary and unit calculator. The tool
allows consumers to better understand the number of units they consume and how it affects their health and
wealth. More than 80,000 consumers now regularly use MyDrinkaware.
(http://www.my.drinkaware.co.uk or http://bit.ly/px7va2)
2.5 Drinkaware works closely with the devolved administrations, most notably with the Scottish Government
and its Alcohol Awareness Week activities in 2008, 2009 and 2010. Drinkaware provided almost 400,000 unit
measure cups to help consumers in Scotland easily identify the number of units of alcohol in wine, beer and
spirits and assist them to moderate their drinking behaviour.
2.6 In 2011 Drinkaware and the British Beer and Pub Association (BBPA) developed a new “2–2-2–1” unit
campaign, providing a simple and quick way to gauge the number of units in the four most popular drinks—a
pint of beer, a 175ml glass of wine, a 330ml bottle of 5% beer, and a 25ml pour of spirits. The campaign has
started rolling out in pubs and restaurants across the UK and it is intended to become one of the most used
“rules of thumb” for consumers.
2.7 Through a partnership with the Wine and Spirits Trade Association, Drinkaware has helped develop a
similar “2–2-2–1” campaign for use in the off trade. Varying slightly from the BBPA version, the proposed
version will replace the pint of beer with a 440ml can of 4% beer and a 330ml bottle of ready-to-drink (RTD)
for the 330 ml bottle of 5% lager. When approved it is anticipated that it will be rolled out in every retail
outlet across the UK.
3. Summary of Our Views
3.1 Our views can be summarised as follows:
— It is essential that consumers view the scientific evidence that supports the unit guidelines as
credible.
— Any revised evidence base must be endorsed by the expert research community to avoid the current
situation where consumers receive different opinions on low risk drinking.
— Government and Drinkaware communications have both led to a raised awareness of unit
guidelines and this should be continued.
— We would recommend the Government maintain its use of current terminology on unit guidelines
so as to continue progress in consumer awareness.
— It is critical that consumer knowledge of unit guidelines is translated into real life drinking
scenarios whereby consumers can learn to choose their drinks appropriately.
4. Question 1: What evidence are Government’s guidelines on alcohol intake based on, and how regularly is
the evidence base reviewed?
We have no response to this question.
5. Question 2: Could the evidence base and sources of scientific advice to Government on alcohol be
improved?
5.1 Drinkaware is one of the primary resources consumers turn to for evidence-based advice on low-risk
drinking. It is essential that its advice is trusted and seen as credible by consumers, including the 225,000
unique users who come to our website every month looking for information about alcohol and the 80,000 who
use MyDrinkaware to moderate their drinking.
5.2 The scientific evidence that supports the unit guidelines is thus critical to the effectiveness of our
campaigns and for this reason we have recently commissioned research on consumer attitudes to units (Annex
2). This qualitative research highlighted how consumers aged 30–45 years and drinking to increasing risk
levels, perceive there to be conflicting opinions and advice on unit guidelines. This has led to some consumers
feeling the guidelines are unsubstantiated or inaccurate and therefore irrelevant.
5.3 Drinkaware believes that consumers would welcome a thorough examination of the evidence base for
unit guidelines. A set of guidelines issued by the Chief Medical Officer with the underlying evidence would
ensure Drinkaware and other organisations could continue to provide consumers with substantiated information.
This endorsement, coupled with Drinkaware’s educational resources and tools could help reduce consumers’
confusion about what is good or bad for their health and be better able to take personal responsibility for their
alcohol intake.](https://image.slidesharecdn.com/guiasalcoholuk-130415104347-phpapp02/85/Guias-alcohol-uk-103-320.jpg)
![cobber Pack: U PL: CWE1 [E] Processed: [03-01-2012 16:31] Job: 015231 Unit: PG03
Ev 56 Science and Technology Committee: Evidence
5.4 It is critical that any evidence base for unit guidelines is endorsed by the expert research community.
Currently, as our consumer research shows, there are conflicting opinions being voiced over the number of
units that may be consumed, the timeline in which they are consumed, and the impact on health if the guidelines
are ignored. Without a reasonable level of agreement any revised evidence base would face significant
challenges in achieving acceptance by consumers and ultimately in shaping their behaviour.
6. Question 3: How well does the Government communicate its guidelines and the risks of alcohol intake to
the public?
6.1 Between 2007 and 2010, the UK Government carried out a series of unit guideline campaigns, spending
about £4 million in 2008–09. The impact of these campaigns alongside those run by Drinkaware has led
directly to an increased awareness and understanding of unit guidelines and how they translate to individual
drinks. It is our belief that although there are still significant numbers of consumers to inform, we are certainly
approaching a “tipping point” with consumers and that many more are beginning to understand units on a
practical level. We would therefore caution against creating new terminology or presentation, which would set
back the progress these communication programmes have achieved.
6.2 Drinkaware has found through its own research (Annex 3), that while the term “alcohol units” is well
recognised among the general population (85% aware of the term), many fewer are able to translate this to
actual drinks that they might consume. Just over a third of adults (38%) were able to select a drink from a list
which correctly contained one unit of alcohol, but this only rises to 42% in those who were aware of the term
“units”. For consumers who are unable to make a direct correlation between “units” and “drinks” the practical
impact of guidelines will be limited.
6.3 Unit guidelines are an important reference point to those seeking to manage their drinking, particularly
amongst certain key age groups. Drinkaware’s recent research amongst 30–45 year olds “increasing risk
drinkers” found that 44% aimed to drink within the daily guidelines, 34% actively sought out information
about the unit content of different drinks and the same proportion relied on information provided on drinks
cans and bottles to help them moderate their drinking (Annex 4).
6.4 If the Government is able to recommend a widely endorsed set of guidelines we believe that both its
own and Drinkaware’s abilities to communicate effectively with consumers will be improved. By coupling
behaviour change campaigns with proven digital tools like MyDrinkaware and simple mnemonic devices like
“2–2-2–1”, consumers will be able to have a clearer understanding of units and their equivalents and be better
informed about the decisions they need to make about their own drinking behaviour.
7. Question 4: How do the UK Government’s guidelines compare to those provided in other countries?
We have no response to this question.
September 2011
Annex 1
“Unit and calorie counter” distributed to more than 2.3 million households in support of the Change4Life
campaign activity.
January 2011](https://image.slidesharecdn.com/guiasalcoholuk-130415104347-phpapp02/85/Guias-alcohol-uk-104-320.jpg)
![cobber Pack: U PL: CWE1 [O] Processed: [03-01-2012 16:31] Job: 015231 Unit: PG03
Science and Technology Committee: Evidence Ev 57
Annex 2
Summary of findings from research on consumer attitudes to units conducted by Penn Schoen Berland for
Drinkaware and focusing on 30–45 year old increasing risk drinkers
August 2011
METHODOLOGY AND OBJECTIVES
Phase 1 Phase 2 Phase 3
6 Qualitative focus groups with Quantitative online survey with 4 Qualitative focus groups with
Adults aged 30–45 who drink at Adults aged 30–45 who drink at Adults aged 30–45 who drink at
least five times a week and exceed least four times a week and exceed least four times a week and exceed
the daily guidelines across the daily guidelines. the daily guidelines across London
London, Manchester and Glasgow. and Birmingham.
1 Qualitative group with three 500 respondents. Using the segments identified in
couples in London phase 2, the audience was limited
to those who were considering
moderation
Key aims: Key aims: Key aims:
— Explore key attitudes, — To identify segments within — Understand which creatives
motivations and barriers to the overall audience and best convey the messages
moderating their drinking understand what drives
them to moderate
— Understand how Drinkaware — Explore their relationship — Identify which creative
messaging can interact with with alcohol route is most successful for
current behaviour encouraging moderation
— Identify key themes and tone — Identify most effective — Explore possible
for Drinkaware messaging messaging for encouraging improvements to strengthen
Adults to moderate creatives](https://image.slidesharecdn.com/guiasalcoholuk-130415104347-phpapp02/85/Guias-alcohol-uk-105-320.jpg)
![cobber Pack: U PL: CWE1 [E] Processed: [03-01-2012 16:31] Job: 015231 Unit: PG03
Ev 58 Science and Technology Committee: Evidence
Key Insights for Adult Audience
1. Adults are very set in their routine of drinking alcohol and see it as an enjoyable reward or moment of
relaxation when they have a drink at home, either before with or after dinner.
2. Adults view their behaviour as normal and do not consider themselves in any way at risk because of their
level of drinking. They feel they are in control of their drinking and already exert a level of moderation easily
in their lives as they do not tend to get drunk. They see little need to further limit themselves and reject the
idea of daily guidelines as too restrictive. They struggle to equate units with their own drinking as they drink
at home and therefore are less aware of measures. They appreciate simple, general examples of drinks that
feel relevant.
3. This audience need to realise they are drinking too much and there are risks associated with this, to
prompt them to reassess their behaviour and consider moderation within daily guidelines.
4. Many Adult drinkers are open to the idea of moderating their alcohol consumption—underpinned by a
growing anxiety around the health harms. Also many feel pulled in many directions—wanting to be successful,
family oriented, healthy and look good. This opens the door to the idea of moderation to provide a way of
achieving their aspirations—providing a clear benefit that taps into their desires.
5. While there are few substitutions for alcohol as a reward or for relaxation some are moderating their
alcohol, employing avoidance or limitation techniques, eg avoiding having alcohol at home, drinking smaller
volumes of drinks or trying to make alcohol last longer.
6. There is a need to highlight that messaging around risks associated with alcohol is relevant to them by
demonstrating empathy with the benefits they derive from drinking, targeting their behaviour to make it feel it
speaks to them. The risks that hold most relevance are weight gain (calories), cancer and liver disease.
7. Highlighting the excuses adults make for having a drink works well as it is empathetic and resonates with
the reasons they give themselves, for example, Monday/Friday or a good/bad day at work. This helps messaging
feel targeted at them and illustrates how risks are relevant.
8. This audience like to feel they are in control and many already are. Any demonstrations that they are
drinking at a high-risk level needs to be done carefully as they do not like to be told what to do. They prefer
to be provided with the facts to make their own informed decisions.
Relaxation and Reward are Key Motivations for Drinking
Adults are very set in their routine of drinking alcohol and see it as an enjoyable reward or moment of
relaxation when they have a drink at home, either before with or after dinner.
Selected quotations:
“After a hard day at work you want to unwind.” (Male, London)
“It’s slightly ritualistic, it’s 7pm, I watch the clock and wait for the sweet release of the cork opening.”
(Male, London)
“I certainly think of it as a reward. You feel like you deserve it.” (Female, London)
“It’s exciting, you’ve finished your day, you’re at home, it’s your reward.” (Female, Manchester)
Many Feel no Desire to Moderate their Drinking
— Strong lack of self-realisation in how much they are drinking and most feel that they are already
“moderating”—particularly when they think back to past behaviours.
— They have built up a tolerance for drinking and subsequently don’t feel hung-over the next day
(again they use their 20’s hangovers as a frame of reference).
— But a small minority are reappraising their drinking—and some moderating is occurring:
— Monday/Tuesday nights off.
— Have a cup of tea instead.
— Nonetheless this is a particularly difficult group to prompt a behavioural change. Many messages
struggled to connect, in part because they were anchored in the guidelines, which they quickly
dismissed as unrealistic and/or unfounded.
Selected quotation:
“I personally don’t see a significant effect on my life from drinking alcohol. Maybe 10 years down the
line it will come back to hit me in the face.” 34. Male, London
They Feel they Already Exert Enough Control and Drink in Moderation
Adults do not consider themselves in any way at risk. They feel in control and already moderating so there
is little need to limit further. They struggle to equate units with their own drinking as they drink at home and
therefore are less aware of measures.](https://image.slidesharecdn.com/guiasalcoholuk-130415104347-phpapp02/85/Guias-alcohol-uk-106-320.jpg)
![cobber Pack: U PL: CWE1 [O] Processed: [03-01-2012 16:31] Job: 015231 Unit: PG03
Science and Technology Committee: Evidence Ev 59
Selected quotations:
“I can come home and think ‘oh I don’t want one [a drink] tonight’. I can control myself like that.”
(Female, Manchester)
“When it is pre-measured like pints it makes sense but as you’re pouring your own glass of wine or
spirits, it isn’t measure.” (Male, Glasgow)
High Awareness of Units, but Daily Guidelines Lack Credibility
Attitudes towards the unit guidelines were mixed. While there was a high awareness of the term units and
could rank drinks in order of unit content, most had little knowledge of exact unit content in drinks. Few could
link guidelines to their own behaviour and daily guidelines were largely seen as restrictive and unrealistic.
Selected quotations:
“I’d have two small glasses of wine and still drive. I shouldn’t have any more than that if I was driving.
I think that’s like logically how I think about units.” (Male, Manchester)
“If drink was measured in units it would sound silly. I wouldn’t go ‘four units of lager please.’” (Male,
Manchester)
“I think it used to be 14 and 21 units for a week, two small glasses of wine or a pint a day.” (Female,
Glasgow)
“Because it’s so restrictive you just think if I’m going over I might as well go over properly.” (Female,
London)
Annex 3
Selection of results from research involving 4,164 participants conducted by IPSOS Mori on behalf of
Drinkaware.
2010
Awareness of Measuring Alcohol by Units
The large majority of people (85%) say they have heard of the term “alcohol units”. As might be expected,
95% of regular drinkers are aware of units, compared to only 58% of those who do not drink. There are no
significant differences in awareness between those who drink regularly within guidelines, and those who drink
to increasing risk or higher risk levels. However, there is a difference between non drinkers and those who
drink even rarely (58% vs. 89% have heard of units), suggesting that any level of alcohol consumption at all
appears to make a difference.
There are no differences by gender in awareness of the term units. Those aged under 45 are less likely to be
aware of the term than those aged 45 and over. (82% compared to 88% aware). Those in the highest social
grades are more likely to be aware of units than those in the lowest social grades—more than nine in ten (93%)
ABs are aware compared to less than three quarters (73%) of Des.
% Yes
85%
95%
93%
58%
82%
82%
88%
87%
73%
Total
Regular drinkers
Non/occasional drinkers
18-24s
25-44s
45+
AB
C1C2
DE
Q Before today, had you heard of the term alcohol units?
Base: All adults(4164), Regular drinkers(1905), Non/occasional drinkers (2269), 18-24s (733),
25-44s (1225), 45+ (2206), AB (802), C1C2 (2305), DE (1057)
Ipsos MORI
Knowledge of the term “alcohol units” is much lower among BMEs compared to white respondents with
only four in ten (40%) non-white respondents being aware of this term compared to nine in ten (89%) white
respondents. This is likely to reflect the much higher proportion of non-drinkers in the non-white group.](https://image.slidesharecdn.com/guiasalcoholuk-130415104347-phpapp02/85/Guias-alcohol-uk-107-320.jpg)
![cobber Pack: U PL: CWE1 [E] Processed: [03-01-2012 16:31] Job: 015231 Unit: PG03
Ev 60 Science and Technology Committee: Evidence
Those living in the South are more aware of the term units than those who live in the North or the Midlands
(94% aware compared to 88% and 86% respectively). London respondents stand out as especially unlikely to
be aware of the term units—only half (51%) say they have heard of this term. This difference is likely to be
explained by the higher proportion of non drinkers and BME residents in London than in other regions. The
gap between London and other regions has widened since last year—with awareness in the South rising from
89% and falling in London from 64%. This may also be linked to a persistent trend for adults in London to be
less likely to drink than the England average.39
Applying Unit Measures to Actual Drinks
A new question was added to the survey in 2010, to explore whether awareness of units as a concept was
able to be applied by respondents to actual drinks that they might consume. Respondents were given a list of
different drinks, from which they were asked to select the drink which best matched one unit of alcohol.
Although the large majority of adults have heard of the term alcohol units, many fewer are able to translate
this to actual drinks that they might consume. Just over a third of adults (38%) were able to select a drink
from a list which correctly contained one unit of alcohol,40
this only rises to 42% in those who were aware
of the term units before taking the survey.
However, it is reassuring that very few people selected drinks which are equal to 2 or more units as a proxy
for one unit—less than 1% selected double shots or cocktails, and only 3% thought a large glass of wine
represents one unit of alcohol. One in eight adults (13%) say they didn’t know—a greater proportion of non
drinkers than drinkers fall into this group (19% of non drinkers say don’t know compared to 4% of increasing
risk drinkers).
% TotaL
30%
21%
8%
8%
3%
3%
3%
2%
1%
1%
1%
1%
13%
3%
Half pint of Lager
Small glass of wine (125ml)
Medium glass of wine (175ml)
Pint of lager
Large glass of wine (250ml)
Single spririt and mixer
Half a medium glass of wine (90ml)
Single shot
Half pint of cider
Bottle of alcopop
Pint of bitter
Bottle of lager
Don’t know
None of these
Base: All adults (4,164)
Ipsos MORI
Q. Roughly speaking, which of the following drinks do you think is equal to one unit of alcohol?
Men were significantly more likely than women to be able to select a drink which contained one unit (46%
of men were correct compared to only 30% of women). This may be linked to a higher proportion of men
choosing a half pint of lager (which contains 1 unit) and a higher proportion of women choosing a small
(125ml) glass of wine (which contains 1.5 units).
Differences between age groups in terms of their ability to recognise a drink containing one unit of alcohol
were not significant. However, those in higher social grades were more likely than those in lower social grades
to recognise a unit (42% of ABs got the proxy measure correct compared to 33% of DEs). Those from white
backgrounds were much more likely to recognise a drink containing a unit than BME respondents (40%
compared to 16%).
The difference between white and BME respondents on this measure is likely to be linked to the finding that
only a quarter (24%) of those who do not drink are able to recognise a drink which contains one unit, compared
to 46% of regular drinkers. Interestingly, understanding of how to relate units to actual drinks increases the
more alcohol one consumes—52% of increasing risk drinkers and 58% of higher risk drinkers select correctly
compared to 41% of those who drink less than the recommended consumption limits. The following chart
shows the breakdown of correct and incorrect responses according to level of drinking.
39
London key facts: Alcohol consumption and its health consequences, The London Health Observatory Report, May 2010
40
Drinks equal to one unit include: a half pint of lager, a single spirit and mixer, a single shot, and half a medium glass of wine
(90ml).](https://image.slidesharecdn.com/guiasalcoholuk-130415104347-phpapp02/85/Guias-alcohol-uk-108-320.jpg)
![cobber Pack: U PL: CWE1 [O] Processed: [03-01-2012 16:31] Job: 015231 Unit: PG03
Science and Technology Committee: Evidence Ev 61
Correct
Incorrect
Don’t know/depend/none of these
5%
8%
25%
7%
45%
44%
51%
43%
38%
31%
41%
52%
% Total
% Drinks at lower risk levels
% Non drinkers
% Increasing risk drinkers
Q. Roughly speaking, which of the following drinks do you think is equal to one unit of alcohol?
Base: All Adults (4164), regular drinkers(non/occassional drinkers (2289), increasing risk drinkers (804)
Ipsos MORI
There are also some broad patterns which emerge when we analyse responses to this question by the types
of drinks that respondents typically drink. For instance, those who drink lager are more likely to select “half a
pint of lager” as a proxy measure—48% of those who say they typically drink pints of lager select this option,
compared to 30% of adults overall. Similarly, those who list a medium glass of wine (175ml) among the drinks
which they consume over the course of a typical week are more likely to select the “small glass or wine
(125ml)” as their proxy measure (33%, compared to 21% overall). This may indicate that people are more
likely to choose a proxy measure based on the types of drink that they themselves are familiar with, or that
respondents’ choice of proxy measure may reflect the personal rules of thumb that they themselves employ.
Awareness of Recommended Unit Consumption Guidelines
As in 2009, respondents were also asked how many units of alcohol they thought was the safe guideline
amount for alcohol consumption per day, for each gender. When it comes to knowing the recommended daily
number of alcohol units adults are advised to limit themselves to, less than a third are able to correctly identify
this. 29% of women got the limit for their own gender correct, compared to 32% of men getting their own
limit correct. One in six (16%) say they don’t know what the recommended limit is. The proportion getting
the daily limits correct has fallen slightly since 2009—for example last year 36% of all adults correctly stated
the limit for women compared to 31% in 2010.
However, people are generally more likely to under, rather than overestimate guideline amounts—43%
selected less than the actual guideline amount for women, and 42% selected a lower amount for men. Only
10% overestimate the limit for women, and 13% overestimate the mens’ limit. The proportion underestimating
the guideline amounts has increased significantly since last year—from 30% underestimating for women and
26% underestimating for men.
18–24 year olds are more likely than other age groups to get the recommended amounts correct (39% on
both men and women’s guidelines, compared to 31% of those aged 25–44 and 30% of those aged 45+). Those
from white backgrounds are more likely to get the guidelines correct than BME respondents (32% compared
to 22% for women’s guidelines, and 31% vs. 18% for men’s guidelines). There are no significant differences
between social grades on women’s guidelines, but ABs are slightly more likely than DEs to get the guidelines
correct for men (32% vs. 27%).41
41
Response options were: 1–2, 2–3, 3–4, 4–5 and 5+ for women (5–6 and 6+ for men). The correct answers are 2–3 units for
women, and 3–4 units for men.](https://image.slidesharecdn.com/guiasalcoholuk-130415104347-phpapp02/85/Guias-alcohol-uk-109-320.jpg)
![cobber Pack: U PL: CWE1 [E] Processed: [03-01-2012 16:31] Job: 015231 Unit: PG03
Ev 62 Science and Technology Committee: Evidence
43%
34%
46%
44%
31%
39%
31%
30%
10%
12%
10%
9%
16%
14%
13%
18%
Underestimate
Correct
Over estimate
Don’t know
% Total % Age 18-24
% Age 25-44 % Age 45+
Q. How many units do you think is the maximum recommended level for a women to drink per day?
Base: All adults (4,164), aged 18-24 (733), Aged 25-44 (2295), aged 45+ (2206)
Ipsos MORI
42%
31%
44%
43%
31%
39%
30%
29%
13%
16%
14%
12%
16%
14%
13%
18%
Underestimate
Correct
Over estimate
Don’t know
% Total % Age 18-24
% Age 25-44 % Age 45+
Q. How many units do you think is the maximum recommended level for a men to drink per day?
Base: All adults (4,164), aged 18-24 (733), Aged 25-44 (1225), aged 45+ (2206)
Ipsos MORI
Awareness of guidelines is clearly related to one’s level of alcohol consumption—for example, 35% of
regular drinkers get the guideline limit for women correct, compared to 23% of those who say they do not
drink. Ability to select the correct guideline amount for women rises to 38% among increasing risk drinkers
and 43% in higher risk drinkers. However, awareness of the recommended limits has fallen slightly since last
year—in 2009, 41% of regular drinkers got the limits for women correct, as did 44% of increasing risk drinkers.](https://image.slidesharecdn.com/guiasalcoholuk-130415104347-phpapp02/85/Guias-alcohol-uk-110-320.jpg)
![cobber Pack: U PL: CWE1 [O] Processed: [03-01-2012 16:31] Job: 015231 Unit: PG03
Science and Technology Committee: Evidence Ev 63
42%
47%
43%
30%
30%
33%
38%
41%
13%
12%
14%
24%
16%
8%
5%
5%
Underestimate
Correct
Over estimate
Don’t know
% Total % Lower risk drinker
% Increasing risk drinker % Higher risk drinker
Q. How many units do you think is the maximum recommended level for a man to drink per day?
Base: All adults (4,164), Increasing risk drinker (753),Higher risk drinker (183), Lower risk drinker (1136)
Ipsos MORI
Information Provided to Understand Units
Less than a third of adults who drink regularly (30%) feel that the information provided on cans and bottles
of alcoholic drinks helps them to monitor how much they are drinking. This view is fairly uniformly held, with
no significant differences by age or gender. However, the more one drinks the more likely one is to feel that
the information is not helpful—48% of regular drinkers who drink below guidelines think that the information
provided on bottles/cans does not help them to monitor how much they drink, compared to 50% of increasing
risk drinkers and 61% of higher risk drinkers.
% Strongly agree
% Tend to disagree
% Tend to agree
% Strongly agree
% Neither/nor
% Don’t know
Total
Non/occasional drinkers
Lower risk drinkers
Increasing risk drinkers
higher risk drinkers
Base: All adults (4,164), increasing risk drinker (752), higher risk drinker (183), Lower risk drinker (1136)
Ipsos MORI
Q How much do you agree or disagree with the following statement?
The information provided on drinks cans and bottles help me to monitor how much I drink
7% 23% 22% 28% 19% 1%
7% 22% 26% 26% 16% 2%
8% 24% 20% 29% 19% 2%
5% 23% 21% 29% 21%
4%16% 18% 34% 27%
Annex 4
Summary of findings from research on consumer attitudes to units conducted by Penn Schoen Berland for
Drinkaware and focusing on 30–45 year old increasing risk drinkers
August 2011
METHODOLOGY AND OBJECTIVES
Phase 1 Phase 2 Phase 3
6 Qualitative focus groups with Quantitative online survey with 4 Qualitative focus groups with
Adults aged 30–45 who drink at Adults aged 30–45 who drink at Adults aged 30–45 who drink at
least 5 times a week and exceed least four times a week and exceed least four times a week and exceed
the daily guidelines across the daily guidelines. the daily guidelines across London
London, Manchester and Glasgow. and Birmingham.](https://image.slidesharecdn.com/guiasalcoholuk-130415104347-phpapp02/85/Guias-alcohol-uk-111-320.jpg)
![cobber Pack: U PL: CWE1 [E] Processed: [03-01-2012 16:31] Job: 015231 Unit: PG03
Ev 64 Science and Technology Committee: Evidence
Phase 1 Phase 2 Phase 3
1 Qualitative group with 3 couples 500 respondents. Using the segments identified in
in London phase 2, the audience was limited
to those who were considering
moderation
Key aims: Key aims: Key aims:
— Explore key attitudes, — To identify segments within — Understand which creatives
motivations and barriers to the overall audience and best convey the messages
moderating their drinking understand what drives
them to moderate
— Understand how Drinkaware — Explore their relationship — Identify which creative
messaging can interact with with alcohol route is most successful for
current behaviour encouraging moderation
— Identify key themes and tone — Identify most effective — Explore possible
for Drinkaware messaging messaging for encouraging improvements to strengthen
Adults to moderate creatives
Many Already Adopting Moderating Techniques
The following table illustrates the percentage of people (from a sample of 500, 30–45 year old increasing
risk drinkers) who replied “often do” or “do from time to time” to each suggestion in response to the request:
Here are some things people have said they do to moderate their drinking. Using the following scale please
tell us whether you have ever tried any of these.
% Agreeing often do/do
from time to time
Avoid drinking at lunchtime during the week 72%
Make a bottle of wine last for a few days (by buying a screw top or 46%
having a stopper)
Have a cup of tea instead 46%
Drink within the daily guidelines 44%
Drink smaller glasses of wine or smaller bottles of beer 44%
Avoid drinking on a “school night” 44%
Try alternative ways to unwind eg taking a bath, reading a magazine, 43%
watched a film, etc.
Limit myself to just one drink 42%
Look at the information provided on drinks cans and bottles to help me 35%
monitor how much I drink
Find out about the unit content of different drinks to help monitor 34%
how much I am drinking
Avoid always having wine and beer in the house 32%
Drink lower alcoholic drinks 28%
Keep a drink diary to monitor how much I am drinking 19%](https://image.slidesharecdn.com/guiasalcoholuk-130415104347-phpapp02/85/Guias-alcohol-uk-112-320.jpg)
![cobber Pack: U PL: CWE1 [O] Processed: [03-01-2012 16:31] Job: 015231 Unit: PG03
Science and Technology Committee: Evidence Ev 65
Supplementary written evidence submitted by Drinkaware (AG 18a)](https://image.slidesharecdn.com/guiasalcoholuk-130415104347-phpapp02/85/Guias-alcohol-uk-113-320.jpg)
![cobber Pack: U PL: CWE1 [E] Processed: [03-01-2012 16:31] Job: 015231 Unit: PG03
Ev 66 Science and Technology Committee: Evidence](https://image.slidesharecdn.com/guiasalcoholuk-130415104347-phpapp02/85/Guias-alcohol-uk-114-320.jpg)
![cobber Pack: U PL: CWE1 [O] Processed: [03-01-2012 16:31] Job: 015231 Unit: PG03
Science and Technology Committee: Evidence Ev 67
Written evidence submitted by the Royal College of Physicians (AG 22)
About the Royal College of Physicians
1. The Royal College of Physicians (RCP) has been at the forefront of improving healthcare and public
health since its formation in 1518. The RCP plays a leading role in the delivery of high quality patient care by
setting standards of medical practice and promoting clinical excellence. As an independent body representing
over 25,000 fellows and members worldwide, we advise and work with government, the public, patients and
other professions to improve health and healthcare.
2. The RCP has played a crucial role in the debate surrounding government alcohol policy since its first
comments on the gin epidemic in 1725, more recently publishing a series of seminal reports on the topic
including: “The medical consequences of alcohol abuse; a great and growing evil” (1987),42
“Alcohol and
the heart in perspective; sensible limits reaffirmed” (1995).43
The first of these reports recommended sensible
limits of drinking for men and women and was quickly adopted by government.
3. The RCP continues to play a leadership and advocacy role in relation to alcohol policy. The RCP
coordinates the Alcohol Health Alliance UK (AHA), which was launched in November 2007 and is chaired
by the RCP’s former president, and RCP special advisor on alcohol, Professor Sir Ian Gilmore. The AHA brings
together medical bodies, patient representatives, charities and alcohol health campaigners to work together to:
— Highlight the rising levels of alcohol health harm.
— Propose evidence-based solutions to reduce this harm.
— Influence decision makers to take positive action to address the damage caused by alcohol misuse.
Introduction
4. The future viability of the National Health Service (NHS) depends on an effective approach to public
health, nationally and locally. Only through long-term strategies, investment and integrated action across all
three domains of public health (health improvement, health protection and healthcare) can we reduce the
burden of disease, disability and dependence in an ageing population. Tackling alcohol misuse is a key part of
this challenge.
5. The evidence suggests that policy measures to tackle the price, availability and promotion of alcoholic
drinks are the most effective way of dealing with alcohol misuse.44
However, the RCP believes that
government advice on sensible drinking limits can play an important role, as doctors, patients and the public
need advice that is easily understood and reasonable. It is essential that this government advice is evidence
based and regularly reviewed.
6. The RCP welcomes the opportunity to submit evidence to the Science and Technology Select Committee
on this important issue.
Summary of the RCP’s Written Evidence
What evidence are government guidelines on alcohol intake based on and how regularly is the evidence base
reviewed?
— The government’s original guidelines on alcohol consumption were based on the 1987 RCP report
“The medical consequences of alcohol abuse; a great and growing evil”.
— The current guidelines are predominantly based on the report “Sensible Drinking; The Report of
an Inter-Departmental Working Group”, which was published in 1995.
— Since 1995 government guidelines have been slightly altered but there has not been a systematic
review of the evidence by government to which interested parties have been invited to give their
views.
Could the evidence base and sources of scientific advice to government on alcohol be improved?
— The RCP believes that the government’s guidelines on alcohol consumption could be improved to
better reflect the evidence base in a number of areas:
(i) overall levels of consumption that are “safe” or within “sensible limits”;
(ii) frequency of alcohol consumption;
(iii) the physiological effects of ageing; and
(iv) the balance of the health benefits of alcohol consumption for coronary heart disease against
wider alcohol-related health harms.
42
1987 RCP, The medical consequences of alcohol abuse, a great and growing evil, Tavistock Publications Ltd.
43
1995 RCP, RCGP, RCPsych, Alcohol and the heart in perspective, sensible limits reaffirmed, Oxprint, Oxford.
44
2010 Babor, Thomas et al, Alcohol, no ordinary commodity; research and public policy, Second edition, Oxford University
Press, pages 243–246.](https://image.slidesharecdn.com/guiasalcoholuk-130415104347-phpapp02/85/Guias-alcohol-uk-115-320.jpg)
![cobber Pack: U PL: CWE1 [E] Processed: [03-01-2012 16:31] Job: 015231 Unit: PG03
Ev 68 Science and Technology Committee: Evidence
How well does the government communicate its guidelines and the risks of alcohol intake to the public?
— The RCP believes that there needs to be clear, independent evaluation of any communications
strategy.
How do the UK government’s guidelines compare to those provided in other countries?
— Comparisons with guidelines in other countries are not straightforward, as there are differences in
the size of standard drinks and units.
— Recent analysis by the Australian government found that 12 countries recommended lower limits
than the UK for women and 15 for men, whereas six countries recommended higher limits for
women and six for men.
— Though a comparison of the guidelines with other countries can provide useful insights, the RCP
believes that it is important that the UK government guidelines are a considered and expert
judgement on the risks of alcohol consumption, based on the scientific and medical evidence.
What evidence are government guidelines on alcohol intake based on and how regularly is the evidence base
reviewed?
1987 sensible drinking guidelines
7. The government’s original guidelines for sensible drinking were based on the findings of the seminal RCP
report “The medical consequences of alcohol abuse; a great and growing evil”, which was published in 1987.
8. This report was the culmination of an RCP working party, which considered the available evidence on
the effect of alcohol consumption on the nervous system, the liver, the gastro-intestinal system and pancreas,
nutrition, the heart, blood pressure, the respiratory system, endocrine function, and on the incidence and severity
of injuries.
9. The report shows that the evidence on the risks of alcohol consumption is complex. Most systems in the
body can be damaged by alcohol consumption, but the rate at which harm increases in relation to the amount
of alcohol consumed varies. For example liver disease has an exponential relationship with alcohol
consumption, whereas the risk of cancers shows a dose dependent relationship. The risk to which an individual
is exposed to is also related to a number of factors, including both the amount and the frequency of drinking,
but also genetics, and age.
10. Therefore the report concluded that advising on “safe” levels of alcohol consumption is difficult and that
there was “insufficient evidence to make completely confident statements about how much alcohol is ‘safe’”.
However, the report argued that it is essential that this was not used as an excuse for inaction as doctors and
the public need guidance which is both easily understood and reasonable.
11. Given this need for guidance the report made a recommendation for “sensible limits of drinking” which
represented the expert judgement of leading doctors based on the available evidence.
12. All alcohol consumption carries a level of risk, but given the fact that alcohol consumption is widespread
and enjoyed by many, this was a judgement about what an acceptable level of risk was. These guidelines were
not “plucked out of thin air”, but were the result of this very difficult judgement.](https://image.slidesharecdn.com/guiasalcoholuk-130415104347-phpapp02/85/Guias-alcohol-uk-116-320.jpg)
![cobber Pack: U PL: CWE1 [O] Processed: [03-01-2012 16:31] Job: 015231 Unit: PG03
Science and Technology Committee: Evidence Ev 69
Figure 1
RELATIVE RISK OF VARIOUS HEALTH PROBLEMS WITH DIFFERENT LEVELS OF ALCOHOL
CONSUMPTION45
Alcohol and relative risk
0.1
1
10
100
0 22 44 88 131 175
Alcohol intake (cl / week)
Relativerisk(-1)
mean liver
mean coronary heart
disease
mean breast
13. There is no such thing as a “safe level” and the RCP weekly guidelines of 1987 were the result of a
balanced judgement of health experts taking into account two of the key parameters of risk: frequency of
consumption and amount consumed on drinking occasion.
14. The report recommended “sensible limits of drinking” of not more than 21 units a week for men, and
not more than 14 units a week for women, including two or three days without any alcohol, and provided that
the total amount was not drunk in one or two bouts. These sensible limits of drinking were quickly adopted
by the government and remained the government’s guidance until 1995.
1995 review of the alcohol guidelines
15. In 1995 the governments guidelines on sensible drinking were reviewed following the publication of
evidence which indicated that drinking alcohol might give protection from coronary heart disease. An
interdepartmental group, comprising predominantly of civil servants from across Government, was established
to review the evidence base and to make recommendations. This culminated in the publication of the report,
“Sensible Drinking, The Report of an Inter-Departmental Working Group”, in December 1995.46
16. This committee made two extremely significant changes to the RCP guidelines, firstly they substituted
the weekly limit with a daily guideline. This in affect appeared to sanction daily or near daily drinking, one of
the key risk factors for alcohol-related harm and dependency. Second if the daily limit of four units was
drunk with no drink free days this would be the equivalent of 28 units per week, a 30% increase on the
RCP’s guidelines.
17. These revised guidelines were not supported by a review of the evidence carried out by the Royal
College of Physicians, Royal College of General Practitioners and Royal College of Psychiatrists, published in
June 1995. This is covered in more detail later in this submission in the section on coronary heart disease. The
review of the guidelines was received with concern by the wider alcohol health community, and Griffith
Edwards, a leading world expert in the field of alcohol dependency addressed this is in a BMJ editorial.47
Government guidelines since 1995
18. The government’s advice on sensible drinking has remained broadly similar since 1995 and there has
not been a similar examination of the evidence to which interested parties have been invited to submit their
views. However the Department of Health has publicly stated that it does keep the issue under regular review.48
45
2004, Corrao G, Bagnardi V, Zambon A, La VC, A meta-analysis of alcohol consumption and the risk of 15 diseases. Prev
Med, 38(5):613–9.
46
1995 Department of Health, Sensible Drinking—The Report of an Inter-Departmental Working Group.
47
1996 BMJ 312 : 1
48
2011, Tamara Cohen, Cheers... an extra glass of wine is fine as the daily allowance could be raised, The Daily Mail, 26 July.](https://image.slidesharecdn.com/guiasalcoholuk-130415104347-phpapp02/85/Guias-alcohol-uk-117-320.jpg)
![cobber Pack: U PL: CWE1 [E] Processed: [03-01-2012 16:31] Job: 015231 Unit: PG03
Ev 70 Science and Technology Committee: Evidence
Figure 2
DEATHS UNDER AGE 65 FROM MAJOR DISEASES COMPARED WITH 1970
600 00
500 00
400 00
300 00
200 00
100 00
0 00
Value
1970
1972
1974
1976
1978
1980
1982
1984
1988
1990
1992
1996
1998
2000
2002
2004
2006
Sensibile Drinking
The Report of an Inter Departmental Working Group
December 1995
Country: UK
Deaths under age 65 from major diseases compared with 1970
circulatory
ischemicheart
brain
cancer
respiratory
liver
endocrine
diabetes
blood
19. Government guidance has altered slightly to define “regular”, as “drinking every day or most days of
the week.”49
The RCP disputes the claim that drinking every day will not accrue a significant health risk, as
frequency of alcohol consumption is an important risk factor for the development of alcohol dependency and
alcoholic liver disease. This is covered in more detail later in this submission. In addition the government
changed the terminology it uses from “safe”, “hazardous” and “harmful” to “low risk”, “increasing risk” and
“high risk”. The medical profession, in standard tests to identify individuals at risk of alcohol-related harms,
including the gold standard World Health Organization Alcohol Use Disorders Identification Test (AUDIT),
uses the “safe” “hazardous” and “harmful” terminology. Consistency in the use of terminology would help to
communicate clearly with the public.
Could the evidence base and sources of scientific advice to government on alcohol be improved?
20. The RCP believes the government’s alcohol guidelines could be improved in a number of areas:
— overall levels;
— frequency of alcohol consumption; and
— age.
Overall levels
21. The Department of Health guidelines currently state that regular consumption of between two and three
units a day for women and three or four units a day for men will not accrue any significant health risk, with
regular consumption defined as drinking every day or most days. This equates to weekly guidelines for sensible
drinking of 28 units a week for men or 21 units a week for women.
22. The RCP recommends that in order for individuals to keep their alcohol consumption within “safe limits”
that they should consume between 0–21 units a week for men and 0–14 units a week for women. At such
levels, most individuals are unlikely to come to harm, provided the total amount is not drunk in one or two
bouts and that there are two to three alcohol free days a week.
23. Consuming between 21–49 units a week for men and 14–35 units a week for women, is “hazardous”
and would put them at an “increasing risk” and consuming above 49 units a week is “harmful”. Above the
“safe limit” of consumption, the risk of mortality from all causes increases as alcohol consumption increases.
24. It is important to note that these recommendations are a best judgement in light of the evidence, and
were reached having taken into account a number of areas of uncertainty and inaccuracy.
49
2008, Department of Health, Units and You [online] available at: http://www.dh.gov.uk/prod_consum_dh/groups/dh_digitalassets/
documents/digitalasset/dh_085427.pdf](https://image.slidesharecdn.com/guiasalcoholuk-130415104347-phpapp02/85/Guias-alcohol-uk-118-320.jpg)
![cobber Pack: U PL: CWE1 [O] Processed: [03-01-2012 16:31] Job: 015231 Unit: PG03
Science and Technology Committee: Evidence Ev 71
The frequency of alcohol consumption
25. Current Department of Health sensible drinking guidelines state that regular consumption of between
three and four units a day for men, and between two and three units a day by women will not accrue significant
health risk. Regular is defined as “drinking every day or most days of the week”.
26. This suggestion that daily drinking is low risk runs against evidence which suggests that frequency of
drinking is a significant risk factor for the development of alcohol dependency, and the development of
alcoholic liver disease.50
27. The World Health Organisation’s (WHO) gold standard tool to identify individuals at risk of alcohol-
related harm, the Alcohol Use Disorders Identification Test (AUDIT)51
can be simplified into the AUDIT-C
test, which retains the majority of its discriminatory value. This test consists of just three questions, the first
of which is how often do you have a drink containing alcohol? Someone drinking four units each day, within
the current guidelines, would be classed as a hazardous or higher risk drinker.
28. Although the mechanisms for alcohol related liver damage are not fully delineated, further studies have
shown an increased risk of cirrhosis for those who drink daily or near daily compared with those who drink
periodically or intermittently.52
A Japanese study showed that heavy drinkers had higher rates of all-cause
mortality when alcohol was consumed over five to seven days compared with one to four days.53
29. A study published in 2009 concluded that increases in UK liver deaths are the result of daily or near-
daily heavy drinking, not episodic or binge drinking, and that this regular drinking pattern is often discernable
at an early age.54
30. It should also be noted that the majority of young people confine their drinking to binges once or twice
each week. These are associated with health harms including accidents, violence, self harm and suicide and as
a result alcohol is the leading cause of death in the 16–24 age group.55
However a very significant minority
of young people drink heavily on a regular basis. As a result very large numbers of young people develop
alcohol dependency, on track to develop physical health complications as they move into their 30s and 40s
(Figure 3).
Figure 3
NUMBERS OF INDIVIDUALS WITH SIGNIFICANT ALCOHOL DEPENDENCY IN ENGLAND
CALCULATED FROM THE PREVALENCE DATA IN THE SURVEY OF PSYCHIATRIC MORBIDITY
2000,56
TOTAL NUMBER OF ALCOHOL ATTRIBUTABLE DEATHS ARE INCLUDED FOR
COMPARISON57
The prevalence of significant alcohol dependency (total number in England with SADQ >20)
together with numbers of alcohol attributable deaths for comparison
0
10000
20000
30000
40000
50000
60000
70000
16-24 25-34 35-44 45-54 55-64 65-74 75+
Alcohol dependency (SADQ
>20)
Attributable alcohol deaths
50
2010, Sheron, Nick, and Brandish, Emma, Drinking patterns and the risk of serious liver disease, Expert Rev. Gastroenterol.
Hepatol. 4(3), xxx–xxx.
51
2001 Babor, T. et al, The Alcohol Use Disorders Identification Test, guidelines for use in primary care, World Health Organisation
52
Ibid
53
2007 Marugame, T. et al, Patterns of drinking and all-cause mortality: results from a large-scale population-based cohort study
in Japan, Am J Epidemiol, 1, 1039–46.
54
2009, Burton, Andrew et al, Drinking patterns, dependency and life-time drinking history in alcohol-related liver disease,
Addiction, 104, 587.
55
2008, Jones, L, Bellis, M. A., Dedman, D., Sumnall, H, and Tocque, K. ‘Alcohol attributable fractions for England; alcohol
attributable mortality and hospital admissions’, North-West Public Health Observatory and Department of Health.
56
2011, Singleton, N, Bumpstead, R, O’Brien, M, Lee, A, and Meltzer, H, ‘Psychiatric morbidity among adults living in private
households 2000’, London, ONS.
57
2008, Jones, L, Bellis, M. A., Dedman, D., Sumnall, H, and Tocque, K, ‘Alcohol attributable fractions for England; alcohol
attributable mortality and hospital admissions’, North-West Public Health Observatory and Department of Health.](https://image.slidesharecdn.com/guiasalcoholuk-130415104347-phpapp02/85/Guias-alcohol-uk-119-320.jpg)
![cobber Pack: U PL: CWE1 [E] Processed: [03-01-2012 16:31] Job: 015231 Unit: PG03
Ev 72 Science and Technology Committee: Evidence
31. There are relatively few older individuals with significant alcohol dependency: some stop drinking and
it is unknown how many die of non-alcohol recorded causes but it is likely to be a significant number.
32. The government guidelines should recognise that hazardous drinking has two components: frequency of
drinking and amount of drinking. To ignore either of these components is scientifically unjustified. A very
simple addition would remedy this problem namely a recommendation that to remain within safe limits of
alcohol consumption that people have three alcohol-free days a week.
Coronary heart disease
33. Following the publication of evidence which indicated that drinking alcohol might give some protection
from coronary heart disease the Royal College of Physicians, together with the Royal College Psychiatrists and
Royal College of General Practitioners published a report in June 1995 entitled “Alcohol and the heart in
perspective; sensible limits reaffirmed”, which reviewed the evidence on the relationship between alcohol
consumption and cardiovascular disease, including coronary heart disease. It considered this evidence alongside
data on all-cause mortality, psychosocial risks, and on the possibility that recommendations that led to an
overall increase in alcohol consumption would also increase the number of heavy drinkers.
34. The report concluded that although the evidence showed that low to moderate drinking of alcohol is
associated with a lower risk of coronary heart disease than in non drinkers, that to increase the upper limit of
the sensible drinking guidelines would benefit neither individuals nor the population as a whole and therefore
recommended no change in the health education advice. This directly conflicted with the changes made to the
Department of Health guidelines to increase the upper limit of the sensible drinking guidelines in 1995.
Effect on individual risk
35. Based on this analysis of the net benefit to the individual the RCP came to the conclusion not to
recommend an increase in the guidelines. The net benefit to the individual balanced not only the potential
health benefits but also the other risks related to increased alcohol consumption:
— For young men, a major cause of death is accidents and violent deaths, of which a large proportion
are alcohol-related, as such any increase in alcohol consumption in this section of the population
would have adverse consequences.
— For premenopausal women, breast cancer is a more significant cause of death than coronary heart
disease, though there may be a narrow window of benefit before a protective effect against coronary
heart disease is balanced by a deleterious effect on breast cancer.
— For men aged above 55 to 60 coronary heart disease is a major cause of death and although one
to three units per day reduces the risk of heart attack, at a population level alcohol harms still
outweigh the health benefits.
Population effects
36. In addition, the RCP’s report concluded that “there would be an adverse effect on the public health from
any recommendation that increased the overall level of consumption in the population. If the mean increases,
the proportion of people drinking in higher risk categories is likely to increase, with consequent increased risk
of alcohol associated harm.”
Further evidence since 1995
37. Following the Department of Health’s review of alcohol guidelines in 1995, further studies have found
that the protective effect of alcohol from coronary heart disease can be obtained at below 21 units per week
for men and 14 units a week for women, and that the majority of the health benefit for men aged over 40 and
post menopausal women can be reached through drinking as little as one unit of alcohol every other day.58
38. There are also other ways to protect those at risk from coronary heart disease, including changing
lifestyle factors such as diet and exercise, as well as the use of statins.
Older people
39. Older people are particularly vulnerable to harm from the various effects of alcohol due to physiological
changes associated with ageing, even at relatively modest levels of intake. As a whole, older people have
higher blood alcohol levels than younger people on drinking the same amount of alcohol due to lower body
mass to water ratio, reduced hepatic blood flow and less efficient hepatic metabolism. Alcohol use in older
people is also associated with depression, dementia, falls and physical illness. However moderate alcohol intake
is also associated with cardiovascular benefits.
40. The current guidelines are based predominantly on evidence for younger age groups and there is concern
that current guidelines are not appropriate for older people. The recent report “Our invisible addicts” published
58
2006, Tolstrup et al, Prospective study of alcohol drinking patterns and coronary heart disease in women and men, BMJ,
doi:10.1136/bmj.38831.503113.7C](https://image.slidesharecdn.com/guiasalcoholuk-130415104347-phpapp02/85/Guias-alcohol-uk-120-320.jpg)
![cobber Pack: U PL: CWE1 [O] Processed: [03-01-2012 16:31] Job: 015231 Unit: PG03
Science and Technology Committee: Evidence Ev 73
by the Royal College of Psychiatrists in 2011, suggests that a “safe limit” for older people is 11 units per week
for men, or seven units per week for women.59
41. However, defining the barrier between moderate and hazardous or harmful drinking is not clear cut, and
there is no arbitrary age when drinking patterns should be advised to change. Individual factors also contribute
to the risks of alcohol consumption, including factors such as medication use, co-morbidity and frailty, as well
as the physiological changes associated with ageing.
42. Recommended limits for safe drinking by older people in the UK require further consideration, especially
considering the ageing UK population alongside changing drinking patterns, which are expected to increase
alcohol-related morbidity and mortality. A consensus on information for healthcare professionals and the public
on recommended drinking limits for older people would help to address this.
How well does the government communicate its guidelines and the risks of alcohol intake to the public?
43. We have no robust evidence that enables us to answer this question but all government public health
messages should be clearly expressed and easy to understand and there should be clear, independent evaluation
of any communications strategy. People have the right to the clear concise and widespread provision of public
information of the health risks of alcohol consumption.
44. Government messages need to be consistent and also need to be tailored to key groups. Given that people
of different ages have markedly different drinking patterns and very different health and other risks, it would
seem sensible to have public health messages which reflect these risks and lifestyles. Recommending to young
people who drink to oblivion one night per week that they should substitute this with a pattern of two to four
units daily drinking has two dangers. First the advice is so inappropriate to their lifestyles that it is effectively
ignored. Second, the implied sanctioning of a pattern of regular daily drinking is potentially extremely
dangerous given that alcohol dependence is effectively a disease of the young.
How do the UK government’s guidelines compare to those provided in other countries?
45. Comparisons with guidelines in other countries are not straightforward, as there are differences in the
size of standard drinks and units. Guidelines which may appear to be significantly different may not actually
be so when standardised into a measure so as to be directly comparable.
46. When the Australian government reviewed its alcohol guidelines in 2009 it provided an analysis and
summary of alcohol guidelines in OECD countries. It found that:
— For women 12 countries had lower guidelines than the UK, and six countries had higher guidelines.
— For men 15 countries had lower guidelines than the UK and six countries had higher guidelines.60
47. Though a comparison of guidelines with other countries can provide useful insights, the RCP believes
that it is important that the UK government guidelines are a considered and expert judgement of the risks of
alcohol consumption, based on the scientific and medical evidence.
September 2011
Written evidence submitted by the Institute of Alcohol Studies (AG 24)
Summary of Main Points
— There is no evidence to support raising the current recommended guidelines for alcohol
consumption.
— There is some evidence to suggest the recommended guidelines should be lowered.
— Recent research indicates that alcohol poses a greater risk, both to the health of the individual
drinker (especially cancer) and the population at large (eg crime and social disorder) than was
known at the time of establishing the current drinking guidelines.
— Given the lack of a proven threshold for risk, the widespread publicity of “safe”, “sensible” or
“responsible” has to be seriously questioned.
— The evidence for the effectiveness of drinking guidelines is inconclusive.
— A full review of the evidence base for drinking guidelines, which takes into consideration the
health and social impact of drinking, with international comparisons is needed.
(1) Upon what evidence are the government’s guidelines on alcohol intake based and how regularly is this
evidence reviewed?
The current recommended drinking guidelines were originally based on evidence submitted in a report by
the Royal College of Physicians to the UK government in 1987. This report acknowledged that there was
59
2011, Royal College of Psychiatrists, Our invisible addicts.
60
2009 National Health and Medical Research Council, Australian Government, ‘Australian Guidelines to reduce health risks from
drinking alcohol’ http://www.nhmrc.gov.au/_files_nhmrc/publications/attachments/ds10-alcohol.pdf](https://image.slidesharecdn.com/guiasalcoholuk-130415104347-phpapp02/85/Guias-alcohol-uk-121-320.jpg)
![cobber Pack: U PL: CWE1 [E] Processed: [03-01-2012 16:32] Job: 015231 Unit: PG03
Ev 74 Science and Technology Committee: Evidence
“insufficient evidence to make completely confident statements about how much alcohol is safe”.61
However,
making the judgement that the public needed to be informed about the risks associated with drinking, it
suggested the following guidelines for “sensible limits of drinking”:
— Men—no more than 21 units per week.
— Women—no more than 14 units per week.
— Both men and women should have two or three alcohol-free days.
— The total number of weekly units should not be drunk in one or two bouts.
These guidelines were based on the underlying assumption that they did not apply to children and
adolescents, to adults who had particular health problems or a family history of alcohol problems or to women
during pregnancy.
In 1995 these guidelines were reviewed by an inter-departmental government working group, following the
publication of evidence that alcohol may provide a protective factor against coronary heart disease. Evidence
was submitted to the inter-departmental working group by leading health experts, including the BMA62
, and
the Royal Colleges of Physicians, Psychiatrists and GPs, stating that the original 1987 guidelines were still the
most appropriate means of communicating to the public the risks associated with drinking63
. There was no
valid evidence to suggest increasing the guidelines.
However, the inter-departmental working group amended the original guidelines, to advise on daily drinking
limits, stating that “men should not regularly drink more than 3–4 units of alcohol a day and women should
not regularly drink more than 2–3 units a day”.64
This effectively increased the weekly limit for men by 33%
and women 50%, exceeding the recommended threshold for low risk drinking as presented by the medical
profession. These changes were met with concern by the health community, as they contradicted the evidence
base and seemingly recommended “safe” levels of drinking that were in fact over and above what was deemed
a “low risk” threshold.65
This will be discussed in the following section about “improving the evidence base”.
The current drinking guidelines for men and women used by the government have largely remained the
same since this amendment. There was an addition in 2009 of the advice from the Chief Medical Officer that
no children under the age of 15 years should consume alcohol, after evidence indicated that drinking before
this age increased the risk of alcohol dependency in later life and also affected cognitive development66
.
(2) Could the evidence base and sources of scientific advice to Government on alcohol be improved?
The IAS is a strong advocate for evidence-based policy and therefore considers that the Government needs
to assess all the available evidence on alcohol consumption when developing public health messages about
drinking. To date, the evidence on the effectiveness of drinking guidelines as a means to reduce harmful alcohol
consumption is inconclusive. Since the 1995 guidelines were established there have been changes in alcohol
consumption trends and developments in the field of alcohol research. These developments need to be taken
into account by the Government when using appropriate advice in the future.
A full review of the evidence base for drinking guidelines, which takes into consideration the health and
social impact of drinking, with international comparisons is needed.
The IAS suggests that the Government establish a working group, with representation of health experts, to
regularly review the evidence base and provide scientific advice for public health messaging on alcohol. This
working group could report to the Health Select Committee and have representation from the Royal Colleges
of Physicians, Psychiatrists and GPs amongst other public health interest groups.
Regular drinking and its associated risks:
Importantly, the recommendation that “regular drinking”, defined as “drinking every day or most days of the
week” does not pose a significant health risk is a direct contradiction to the evidence base on the health harms
associated with alcohol. Daily and frequent drinking is associated with a greater risk of developing dependency
problems with alcohol and alcoholic liver disease and cannot therefore be considered a “safe” or “low risk”
practice. Furthermore, the guideline for men to drink up to 4 alcoholic drinks per day on a regular basis would
be classified as “hazardous” drinking under the WHO standards for assessing risky alcohol consumption (the
Alcohol Use Disorder Identification Test, AUDIT).
The IAS recommends that both volume and frequency of alcohol consumption are accounted for in any
drinking guidelines.
61
Royal College of Physicians (1987), “The medical consequences of alcohol abuse, a great and growing evil”, Tavistock
Publications Ltd
62
British Medical Association (1995), “Alcohol: guidelines on sensible drinking”, BMA, London
63
Royal College of Physicians, Royal College of Psychiatrists, Royal College of General Practitioners (1995), “Alcohol and the
Heart in Perspective, sensible limits reaffirmed”, Oxprint, Oxford
64
Department of Health (1995), “Sensible Drinking—The report of an Inter-Departmental Working Group”, DH, London
65
Edwards, Griffith (1996), “Sensible Drinking: Doctors should stick with the independent medical advice”, British Medical
Journal, vol 312, no 7022
66
Department of Health (2009), “Guidance on the consumption of alcohol by children and young people. A report by the Chief
Medical Officer”, DH, London](https://image.slidesharecdn.com/guiasalcoholuk-130415104347-phpapp02/85/Guias-alcohol-uk-122-320.jpg)
![cobber Pack: U PL: CWE1 [O] Processed: [03-01-2012 16:32] Job: 015231 Unit: PG03
Science and Technology Committee: Evidence Ev 75
Scope of guidelines—alcohol harm to the individual and society:
The current guidelines are limited in their scope to the risk to the individual drinker of developing chronic
health problems. The risks posed by alcohol both to the individual and society are much broader than this and
need to be taken into consideration when developing any form of guidance with the objective of reducing
alcohol related harm.
A wider perspective provided by the WHO Global Burden of Disease calculations for Disability and Quality
Adjusted Life Years (DALYs and QALYs) would provide a better indicator of alcohol-related harm to
individuals in respect to biological, psychological and social issues. In other words chronic risk should be seen
from the perspective of number of years of disability caused by drinking behaviour. These types of studies
have been undertaken in Sweden and Canada. Acute health and social harms, such as the increased risk of
accidents, should be addressed alongside chronic conditions. Guidance can be taken from the Australian model
of alcohol public health messaging, which is discussed in section 4 of this document.
Effectiveness of guidelines as a major policy to reduce alcohol harm:
There is much debate both in the UK and internationally about the efficacy of drinking guidelines as a policy
to reduce alcohol harm. Many health experts have raised concerns about the prioritisation of drinking guidelines
and public health education programmes over and above more proven effective policies such as regulation of
price, availability and promotion.67
Given that the UK Government has placed a large emphasis on drinking
guidelines as a means to “foster a culture of responsible drinking”,68
it is important to note here that whilst
guidelines have a role to play in educating the public and increasing knowledge about the risks of alcohol,
they have not been proven to be effective at changing behaviour. The pharmacological properties of alcohol,
which include loss of inhibitions in the short term and dependence in the long term, make it impractical to
rely on a “nudge” framework of “rational man making informed decisions” about drinking alcohol to effect
behaviour change.
Evidence to change the guidelines:
There is no evidence to support raising the current unit guidelines. Despite media coverage that suggests the
review by the Science & Technology Committee may increase the “healthy alcohol limit”,69
no research has
been published to date that suggests any health benefit will be achieved by regular consumption above the
current unit guidelines.
There has been some evidence published to support lowering the current drinking limits recommended
by Government.
A recent report by the Harvard School of Public Health found that post-menopausal women (average age
58) who were registered nurses from European backgrounds experienced improved health outcomes in older
age if they consumed very modest amounts of alcohol70
. The authors of this study warned against regular
consumption of more that 15g per day amongst women of this demographic, due to the increased risk of
developing breast cancer. This study therefore indicates that the current drinking guidelines of up to 3 units
per day for women (3 x 8g = 24g) may increase the risk of breast cancer and should therefore be reduced to
less than 2 units.
A report published by the Royal College of Psychiatrists in 2011, suggests that older men and women should
be issued with lower drinking guidelines due to a range of physiological changes associated with ageing,
including reduced liver function and also the association of alcohol with dementia, depression and an increased
risk of falls. The report recommended the revised limits for older people of 11 units per week for men and 7
units per week for women.71
A further study in the UK found that any protective factor from drinking alcohol against coronary heart
disease can be reached through drinking as little as one unit of alcohol every other day for men over 40 years
and post-menopausal women.
However, the evidence to suggest thresholds for “low risk” drinking is inconclusive and there is no proof
that any level of alcohol consumption is completely safe.
With regard to chronic consumption of alcohol there is not a threshold at which harm occurs. There is a
curvilinear relationship between harm and alcohol consumption, there being different risk curves for different
outcomes. For example the pattern of chronic diseases such as cirrhosis will be different from the risk data for
other internal organs, including brain damage.
67
Babor, T et al (2010), “Alcohol: No Ordinary Commodity; research and public policy”, second edition, Oxford University Press,
Oxford
68
Department of Health (2011), Public Health Responsibility Deal, http://www.dh.gov.uk/en/Publichealth/
Publichealthresponsibilitydeal/index.htm
69
The Independent (2011), “Healthy alcohol limits likely to be increased” http://www.independent.co.uk/life-style/food-and-drink/
news/healthy-alcohol-limits-likely-to-be-increased-2319904.html 25 July 2011
70
Sun, Q et al (2011), “Alcohol Consumption at Midlife and Successful Ageing in Women: A Prospective Cohort Analysis in the
Nurses’ Health Study”, PLoS Med 8(9): e1001090
71
Royal College of Psychiatrists (2011), “Our invisible addicts. First Report of the Older Persons” Substance Misuse Working
Group of the Royal College of Psychiatrists, London](https://image.slidesharecdn.com/guiasalcoholuk-130415104347-phpapp02/85/Guias-alcohol-uk-123-320.jpg)
![cobber Pack: U PL: CWE1 [E] Processed: [03-01-2012 16:32] Job: 015231 Unit: PG03
Ev 76 Science and Technology Committee: Evidence
Furthermore, there is a significant difference in these risk curves between different populations, people of
different ages, social class, health status, ethnicity and gender. It is therefore extremely difficult to produce a
universal public health message about “safe” levels of drinking.
Change in consumption trends and the rise of alcohol harm:
There have been significant changes in patterns of alcohol consumption and associated harms since the
establishment of the current drinking guidelines.
Liver deaths have increased markedly in the UK since 1995.72
Studies have shown that this increase is the
result of an increase in levels of daily and near daily heavy drinking.
The overall affordability of alcohol has increased in the past 20 years by 44% and by around 130% in the
off trade sector, where approximately 70% of alcohol is now purchased.73
The link between alcohol and cancer has been explored in more detail, with a recent study indicating that
alcohol may be associated with up to 13,000 new cases of cancer in the UK each year.74
Alcohol is the single largest cause of mortality amongst 15–24 year olds, with almost a quarter of all deaths
in this age group associated with alcohol.75
There has been a marked rise in crime and social problems due to alcohol. Approximately half (50%) of all
violent incidents recorded are alcohol related with figures suggesting alcohol may contribute to up to one
million assaults each year.
According to the latest report from the NHS Information Centre on Alcohol Statistics in England, almost
one quarter (24%) of all adults in England were classified as hazardous drinkers in 2007.
3. How well does the Government communicate its guidelines and the risks of alcohol intake to the public?
As stated above, there is limited evidence to show that drinking guidelines are effective at changing
behaviour with regards to alcohol consumption. Rather, the available evidence suggests that guidelines can be
used to increase knowledge and awareness about the risks associated with drinking.
There is available data to show that public awareness of drinking guidelines has increased since 1997.
Omnibus surveys carried out by the Office of National Statistics show that 90% of respondents had heard of
measuring alcohol in units in 2009, which was a significant increase from 79% 1997. This increase in awareness
was reported equally amongst men and women, however there were significant differences between levels of
awareness amongst respondents from different age groups and socioeconomic status.
Those aged 65 and over were less likely to have heard of alcohol units: 80% had done so, compared with
96% of those aged 45 to 64 and 88% of the youngest age group (16 to 24). Given the increased vulnerability
of older people to the harmful effects of alcohol (as outlined above) this data would suggest that the
Government should seek to increase knowledge on the risks associated with drinking amongst this group.
Those in managerial and professional occupational groupings were the most likely to have heard of
measuring alcohol in units (96%), and those in routine and manual occupations the least likely to have done
so (87%). The harms caused by alcohol are disproportionately felt amongst lower socioeconomic groups: Men
and women in routine and manual jobs are at a greater risk (3.5 and 5.7 times respectively) of dying from an
alcohol related disease than those in higher managerial and professional jobs.76
Heavy drinking has also been
shown to have a negative effect on educational achievement and subsequent occupational status.77
This
evidence suggests that the Government should make the reduction of health inequalities a priority in any public
health policy for alcohol.
The IAS suggests that in order to ensure the highest levels of credibility for public health messaging around
alcohol, any guidance should originate from the Chief Medical Officer (as opposed to “Government”
guidelines).
4. How do the UK Government’s guidelines compare to those provided in other countries?
International examples can be used as a guide to how the latest research developments have impacted upon
recommended guidelines. The most recent comprehensive review of drinking guidelines was conducted in
Australia, which concluded that the guideline for low risk drinking is that neither men nor women should
exceed 20g of pure alcohol per day, which is equivalent to 2.5 standard UK units. The Australians define “low
risk” as the level of alcohol intake that, for healthy adults, will reduce the lifetime risk of death from an
72
Data from the Office of National Statistics (ONS), 2011
73
NHS Information Centre 2011, Statistics on Alcohol, England, 2010
74
Schuzte et al (2011), “Alcohol attributable burden of incidence of cancer in eight European countries based on results from
prospective cohort study”, British Medical Journal, 7 April 2007
75
ONS, 2011
76
ONS, 2011
77
World Health Organisation (2010), Global strategy to reduce the harmful use of alcohol, WHO Geneva](https://image.slidesharecdn.com/guiasalcoholuk-130415104347-phpapp02/85/Guias-alcohol-uk-124-320.jpg)
![cobber Pack: U PL: CWE1 [O] Processed: [03-01-2012 16:32] Job: 015231 Unit: PG03
Science and Technology Committee: Evidence Ev 77
alcohol-related injury or disease to less than 1 in 100 (that is, one death for every 100 people who drink at
that level).
The review of the Australian drinking guidelines found that of all the OECD countries, only six had higher
recommended unit guidelines for men and women. In comparison, for women 12 countries had lower guidelines
than the UK and for men 15 countries had lower guidelines than the UK.
In Conclusion
There are many problems in establishing drinking guidelines due to the considerable variability of individuals
in specific populations. There is limited evidence to suggest that use of drinking guidelines can affect behaviour
change in order to reduce levels of alcohol harm. In view of the curvilinear relationship between consumption
and alcohol health harms, and the lack of a proven threshold for risk, the widespread publicity of “safe”,
“sensible” or “responsible” has to be seriously questioned.
A full review of the evidence base for drinking guidelines, which takes into consideration the health and
social impact of drinking, with international comparisons is needed.
A short-term solution:
The IAS understands the desire for the Government to publicise guidance to the population on the risks
associated with drinking alcohol. Given the available evidence, the IAS recommends the Government consider
adopting the following measures on a short term basis, whilst in the long-term conducting a thorough review
of the efficacy of guidelines:
— That the messaging around any guidelines avoids using language that may be perceived as “targets”
or encourage drinking. Phrases such as “recommended”, “responsible” and “sensible” should be
avoided and the term “low risk drinking” used.
— Any guidelines should be explicit about their role as guidance only, and it should be made clear
that no universal limits exist that apply to the whole population due to age, ethnic background,
health status and other variables.
— Guidelines should emphasise the CMO’s advice that no children under the age of 15 should
drink alcohol.
— Guidelines should stipulate that pregnant women should avoid alcohol, that there is no evidence
to suggest any level of “risk free” drinking whilst pregnant.
— Guidelines should be specific and measurable, not open to ambiguity, for example “1–2 units a
day” should be replaced with “maximum of 2 units in any one day”.
— The term “daily” and “regular” drinking should be avoided as this implies that drinkers should
drink regularly, which increases the risk of developing dependency.
— Guidelines should link to nutritional advice, highlighting the impact of eating certain foods whilst
drinking and the risks of drinking outside of mealtimes.
— The link to alcohol and a variety of non-communicable diseases should be highlighted in health
warnings, especially the increased risk of cancer.
— The risks associated with regular and daily drinking should be highlighted, with a recommendation
that people do not drink every day and have at least three alcohol free days each week.
— An emphasis should be placed on the fact that no alcohol consumption is risk free.
September 2011
Supplementary written evidence submitted by the Institute of Alcohol Studies (AG 24a)
I have appended the additional evidence that was promised to the Committee which should help to further
clarify some of the points raised.
Correction (in italic) to Professor Heather’s oral evidence on 12 October:
Q8: Professor Heather: [...] In relation to the cardio-protective effect, when the “Sensible Drinking”
report was written in 1995, which was the last time that the Government addressed this problem,
there was much more confidence in the cardio-protective effect, which is reflected in the report by
the committee of which Dr Harding was a member, and also in the report of the three royal colleges
that came out at roughly the same time (correction—were published some eight to 10 years earlier).
That consensus has now largely disappeared, which is the result of more careful research. [...]
Dr Marsha Morgan
Institute of Alcohol Studies](https://image.slidesharecdn.com/guiasalcoholuk-130415104347-phpapp02/85/Guias-alcohol-uk-125-320.jpg)
![cobber Pack: U PL: CWE1 [E] Processed: [03-01-2012 16:32] Job: 015231 Unit: PG03
Ev 78 Science and Technology Committee: Evidence
Attachment 1
EXPRESSING RISK IN RELATIVE OR ABSOLUTE TERMS
The Australian alcohol guidelines (Rehm et al, Int. J. Methods Psychiatr Res 2008; 17: 141–151) are based
on an assessment of the absolute risk of alcohol consumption while the Canadian guidelines are allegedly
based on an assessment of relative risk (Stockwell et al, Drug and Alcohol Review 2012)
When discussing the implementation of research evidence into clinical practice:
1. Relative risks (RRs) associated with an exposure (eg alcohol) should be lifted from credible research
studies.
2. A particular individual’s baseline risk should be calculated, or roughly estimated.
3. The RR can be multiplied by the individual’s baseline risk to calculate the risk the individual would
experience if exposed to alcohol.
4. The difference between baseline risk and risk if exposed to alcohol equals the absolute risk difference.
The Australians focused on the absolute risk difference and set the lifetime risk standard at one in 100. They
argued that if the risk for alcohol-related chronic disease mortality fell below 1% for a given level of alcohol
consumption, that level of consumption would be safe, but once it exceeds 1%, it is no longer safe. As a result
of their analysis they deemed that both men and women should not drink more than two drinks a day
(equivalent to 2.5 standard UK units) and for occasional drinking three or four drinks seem tolerable. They set
a weekly maximum of 17.5 units for both sexes.
However, Stockwell et al argued that this threshold is arbitrary. However, the Australian team felt that in
general the public would most likely accept a risk of 1:100. Stockwell et al claimed that their “relative risk
approach” in which the risks for alcohol-related chronic diseases were compared with the risk in abstainers
was better geared towards individuals’ own decisions. However, in presenting their data on relative risk they
also included data on the frequency of the specific cause of death (Table 1). In a sense, this latter piece of
information is analogous to baseline risk. So in reality Stockwell’s approach is not based on relative risks
alone. The authors make the point, for example, that a 19% relative risk reduction in ischaemic heart disease
associated with two drinks per day may more than wipe out the alarming 43% increase in oesophageal cancer,
since the former is 10 times more common as a cause of death than the latter.
Table 1
% CHANGE IN RELATIVE RISK OF DEATH FROM ILLNESSES LINKED TO DRINKING FOR MEN
AND WOMEN AGED BELOW 70 YEARS BY AVERAGE STANDARD DRINKS PER DAY*
Zero or Decreased Risk
0% -1 to -24% -25% to -50%
Increased Risk
Up to +49% +50 to 99% +100 to 199% Over +200%
Type of illness
or disease
Proportion
of All
Deaths,
2002-
2005
1 drink 2 drinks 3-4 drinks 5-6 drinks + 6 drinks
Conditions for which risks are similar for males and females
Oesophageal Cancer 1 in 150 +20 +43 +87 +164 +367
Colon Cancer 1 in 40 +3 +5 +9 +15 +26
Rectum Cancer 1 in 200 +5 +10 +18 +30 +53
Liver Cancer 1 in 200 +10 +21 +38 +60 +99
Ischaemic. Heart Disease 1 in 13 -19 -19 -14 0 +31
Conditions for which risks are significantly different for males
Hemorrhagic Stroke 1 in 30 +10 +21 +39 +68 +133
Hypertension 1 in 150 +13 +28 +54 +97 +203
Liver Cirrhosis 1 in 90 +26 +59 +124 +254 +691
Ischemic Stroke 1 in 80 -13 0 +8 +29 +70
Diabetes Mellitus 1 in 30 -12 0 0 0 +72
Conditions for which risks are significantly different for females
Breast Cancer 1 in 45 +13 +27 +52 +93 +193
Hemorrhagic Stroke 1 in 20 +22 +49 +101 +199 +502
Liver Cirrhosis
Mortality
1 in 160 +139 +242 +408 +666 +1251
Liver Cirrhosis 1 in 160 +21 +70 +125 +182 +260
Hypertension 1 in 85 0 +48 +161 +417 +1414
Ischemic Stroke 1 in 65 -34 -25 0 +86 +497
Diabetes Mellitus 1 in 30 -36 -40 0 +739 +1560
*Estimates provided by Rehm and colleagues as part of a specially commissioned report.](https://image.slidesharecdn.com/guiasalcoholuk-130415104347-phpapp02/85/Guias-alcohol-uk-126-320.jpg)
![cobber Pack: U PL: CWE1 [O] Processed: [03-01-2012 16:32] Job: 015231 Unit: PG03
Science and Technology Committee: Evidence Ev 79
Thus, Stockwell’s recommendation of levels where the net benefit equals zero must involve multiplying
relative risks by absolute risks for the Canadian population. Supposedly Stockwell allows that individuals will
have their own baseline risks, so that the balance may vary for individuals. Thus Stockwell’s assertion that
they are using a relative risk approach is incorrect as they are in reality also considering absolute risks. As a
result they recommended that, for a net zero risk, daily intake should not exceed two standard Canadian drinks
for women (equivalent to 3.4 standard UK units) and three standard Canadian drinks in men (equivalent to 5.
standard UK units). However in recommending weekly limits it is clear that they have included two drink free
days as the totals for women equate to17.0 standard UK units in women and 25.5 standard UK units in men.
Attachment 2
A REVIEW OF HUMAN CARCINOGENS—PART E: TOBACCO, ARECA NUT, ALCOHOL, COAL
SMOKE, AND SALTED FISH:78
Béatrice Secretan, Kurt Straif, Robert Baan, Yann Grosse, Fatiha El Ghissassi, Véronique Bouvard, Lamia
Benbrahim-Tallaa, Neela Guha, Crystal Freeman, Laurent Galichet, Vincent Cogliano, on behalf of the WHO
International Agency for Research on Cancer Monograph Working Group, International Agency for Research
on Cancer, Lyon, France.
Attachment 3
ALCOHOL AS A RISK FACTOR FOR LIVER CIRRHOSIS: A SYSTEMATIC REVIEW AND META-
ANALYSIS:79
Jürgen Rehm, Benjamin Taylor, Satya Mohapatra, Hyacinth Irving, Dolly Baliunas, Jayadeep Patra &
Michael Roerecke.
Attachment 4
OUR INVISIBLE ADDICTS: FIRST REPORT OF THE OLDER PERSONS’ SUBSTANCE MISUSE
WORKING GROUP OF THE ROYAL COLLEGE OF PSYCHIATRISTS, COLLEGE REPORT CR165,
JUNE 2011
This report can be criticised on many accounts but only the main ones will be highlighted:
1. The Report at first seems ambivalent about lowering the safe limits: On pp 35–36 it states: “Screening
instruments may not be appropriate for an older population, and criteria such as safe limits’ (see pp.
35–36) for alcohol consumption may be set too high to be of valid use with elderly people”.
Later, however, a definite recommendation is made that “safe limits” for those aged 65 and older
should be set lower than those for the general population at 1.5 units /day or 11 units/week. The US
National Institutes of Health (NIH) is quoted (page 35) as the source for the recommended intake
limit of 1.5 units per day. However the authors clearly have not appreciated that a US drink contains
13 g whereas a UK drink contains 8 g. They have not taken this difference into account and they have
miscalculated the figures.
The NIH recommendations state:
For healthy men up to age 65:
— no more than four drinks in a day (UK equivalent 6.5 units); and
— no more than 14 drinks in a week (UK equivalent 23.0 units).
For healthy women (and healthy men over age 65):
— no more than three drinks in a day (UK equivalent 4.9 units); and
— no more than seven drinks in a week (UK equivalent 11.4 units).
See: http://pubs.niaaa.nih.gov/publications/practitioner/cliniciansguide2005/clinicians_guide5_help_
p.htm
Thus if we followed the NIH lead, as the authors of the report suggest, we would recommend intakes
of no more than 5 units /day which is greater than the current recommended UK levels for the general
population—in other words the daily allowance for the >65’s would INCREASE not DECREASE.
2. It is correct that for various physiological reasons, a dose of alcohol that might not have caused
unsteadiness or altered behaviour at age 50, may affect the individual more at the age of 80. It is also
true that blood alcohol levels may be slightly higher level in an older person than in a younger person
of the same body weight (p 23). These seems to be the main reasons for “lowering safe limits” for
the over 65’s. However, the authors provide no evidence to support this view. Thus, they so not show
data on hospital admission rates for accidents in the home, falls or injury, by age, nor do they review
the data on alcohol and falls in the literature, particularly in relation to age.
78
http://old.ensp.org/files/lancet-iarc-100–1.pdf
79
http://onlinelibrary.wiley.com/doi/10.1111/j.1465–3362.2009.00153.x/pdf](https://image.slidesharecdn.com/guiasalcoholuk-130415104347-phpapp02/85/Guias-alcohol-uk-127-320.jpg)
![cobber Pack: U PL: CWE1 [E] Processed: [03-01-2012 16:32] Job: 015231 Unit: PG03
Ev 80 Science and Technology Committee: Evidence
3. They do not attempt to review the relationship between cognitive impairment and dementia and
alcohol. The literature is extensive and somewhat complicated because of confounders such as
sociability, diet, lifestyle and income. However there is some evidence to suggest that individuals who
consume one to four drinks a day may be at lower risk of developing dementia.
4. The authors imply that many people aged over 65 are on medications and are frail. This is clearly a
substantial generalisation. Most medications widely used in the elderly—eg statins, calcium and
vitamin D supplements and even hypoglycaemic agents have no interaction with alcohol. In addition
many people in this age group live happy, useful and active lives.
October 2011
Written evidence submitted by the British Medical Association (AG 27)
The British Medical Association (BMA) welcomes the opportunity to submit evidence to the Committee’s
inquiry on the evidence base for alcohol guidelines.
The BMA has looked extensively at the issue of alcohol-related harm, and has published a number of reports
in this area, which includes Under the influence—the damaging effect of alcohol marketing on young people
(2009), Alcohol misuse: tackling the UK epidemic (2008) and Fetal alcohol spectrum disorders: a guide for
healthcare professionals (2007). These reports have been used to inform this submission, and can be accessed
at www.bma.org.uk/alcohol.
The BMA has not considered the evidence base for the Government’s guidelines on alcohol, or how the UK
guidelines compare with other countries. As such, our submission focuses on the BMA’s policies in relation to
the Government’s approach to communicating its guidelines on alcohol and the risks of alcohol intake to
the public.
Evidence
1. A significant proportion of individuals in the UK drink above recommended UK guidelines. Most recent
figures from the Office for National Statistics (ONS) show that in 2009, 22% of those consuming alcohol
exceeded recommended UK drinking guidelines.1
This equates to 26% of males and 18% of females.2
The
greatest proportion of men exceeding recommended drinking guidelines in 2009 were aged 45 to 64, whereas
women aged 16 to 24 exceeded drinking guidelines the most.3
2. Much of the strategy to reduce alcohol related harm in the UK focuses on recommended drinking
guidelines. While most people are aware of the existence of recommended drinking guidelines, few can
accurately recall them, understand them, or appreciate the relationship between units, glass sizes and drink
strengths.4,5,6,7,8
A 2009 ONS survey of adults in the UK, found that 75% of adults had heard of daily drinking
guidelines, however, having heard of daily recommended levels did not necessarily mean that people
understood what they were.9
The percentage of people who said they had heard of, but did not know the
recommended limits in 2009, was around 30%.10
3. To ensure greater knowledge and understanding of UK drinking guidelines, the BMA recommends
mandatory labelling of all alcoholic beverage containers. We believe it should be a legal requirement to
prominently display on all labels information on alcohol content in units, recommended daily UK guidelines
for alcohol consumption, and a warning message advising that exceeding these guidelines may cause the
individual and others harm. It should also be a legal requirement to prominently display at all points where
alcoholic products are for sale information on recommended daily UK guidelines, and a warning message on
exceeding these guidelines.
4. The mandatory labelling of alcoholic beverage containers, along with point of sale information, will
provide a useful method of increasing awareness of recommended drinking guidelines and health warnings, as
well as supporting other alcohol polices that reduce alcohol-related harm. Labelling of alcoholic beverage
containers and point of sale information, should be supported by information resources on what the
recommending guidelines are, and what the effects of “exceeding” these limits can be, as well as sources of
help and support to those recognising they may have a problem.
5. The BMA believes that this labelling and point of sale information should be mandatory, as the existing
self-regulatory approach is ineffective, and has resulted in variable and limited market coverage. 11
Industry
self-regulation has at its heart a conflict of interest that does not adequately address individual or public
health.12
Assessments of compliance must be effectively measured and enforced by a genuinely independent
body, with strong and meaningful penalties for non-compliance.
6. In relation to alcohol consumption during pregnancy, there is clear evidence that drinking heavily during
pregnancy impacts on the development of the fetus, and it is as yet unclear whether there are any safe levels
of maternal alcohol consumption.13,14,15,16,17
While there is no conclusive evidence that drinking at the](https://image.slidesharecdn.com/guiasalcoholuk-130415104347-phpapp02/85/Guias-alcohol-uk-128-320.jpg)
![cobber Pack: U PL: CWE1 [O] Processed: [03-01-2012 16:32] Job: 015231 Unit: PG03
Science and Technology Committee: Evidence Ev 81
maximum levels recommended when pregnant is harmful to the fetus, evidence continues to emerge on the
possible risks of prenatal alcohol exposure at low to moderate levels.18,19,20,21,22,23,24,25
Given the current
ambiguity regarding the level of risk to the developing fetus, as well as the reported underestimation or
uncertainty of drinking guidelines by the public, the BMA believes the only safe sensible drinking message is
not to consume any alcohol during pregnancy.
Professor Vivienne Nathanson
Director of Professional Activities
British Medical Association
September 2011
References
1
Robinson S & Lader D (2011). Smoking and drinking among adults, 2009: a report on the 2009 General
lifestyle Survey. Newport: Office for National Statistics.
2
Robinson S & Lader D (2011). Smoking and drinking among adults, 2009: a report on the 2009 General
lifestyle Survey. Newport: Office for National Statistics.
3
Robinson S & Lader D (2011). Smoking and drinking among adults, 2009: a report on the 2009 General
lifestyle Survey. Newport: Office for National Statistics.
4
Hasking P, Shortell C & Machalek M (2005). University students’ knowledge of alcoholic drinks and their
perception of alcohol-related harm. Journal of Drug Education 35: 95–109.
5
Gill F & O’May F (2006). How “sensible” is the UK sensible drinking message? Preliminary findings
amongst newly matriculated female university students in Scotland. Journal of Public Health 29: 13–6.
6
Plant MA & Plant ML (2006). Binge Britain: alcohol and the national response. Oxford: Oxford University
Press.
7
Office for National Statistics (2010). Drinking: adults’ behaviour and knowledge in 2009. London: Office for
National Statistics.
8
HM Government (2007). Safe. Sensible. Social: the next steps in the national alcohol strategy. London: The
Stationery Office.
9
Office for National Statistics (2010). Drinking: adults’ behaviour and knowledge in 2009. London: Office for
National Statistics.
10
Office for National Statistics (2010). Drinking: adults’ behaviour and knowledge in 2009. London: Office
for National Statistics.
11
Department of Health (2010). Consultation on options for improving information on the labels of alcoholic
drinks to support consumers to make healthier choices in the UK—response to consultation. London: The
Stationery Office.
12
Babor T, Caetano R, Casswell et al (2003). Alcohol: no ordinary commodity. Oxford: Oxford University
Press.
13
Gray R & Henderson J (2006). Review of the fatal effects of prenatal alcohol exposure. Report to the
Department of Health. Oxford: National Perinatal Epidemiology Unit, University of Oxford.
14
Welch-Carre E (2005). The neurodevelopmental consequences of prenatal alcohol exposure. Advances in
Neonatal Care 5: 217–29
15
Sokol R J, Delaney-Black V & Nordstrom B (2003). Fetal alcohol spectrum disorder. Journal of the
American Medical Association 290: 2996–9.
16
O’leary C M (2004). Feta alcohol syndrome: diagnosis, epidemiology, and developmental outcomes. Journal
of Paediatrics and Child Health 40: 2–7.
17
Royal College of Obstetricians and Gynaecologists (2006). alcohol consumption and the outcomes of
pregnancy, London: Royal College of Obstetricians and Gynaecologists.
18
Gray R & Henderson J (2006). Review of the fatal effects of prenatal alcohol exposure. Report to the
Department of Health. Oxford: National Perinatal Epidemiology Unit, University of Oxford.
19
O’leary C M (2004). Feta alcohol syndrome: diagnosis, epidemiology, and developmental outcomes. Journal
of Paediatrics and Child Health 40: 2–7.
20
Royal College of Obstetricians and Gynaecologists (2006). alcohol consumption and the outcomes of
pregnancy, London: Royal College of Obstetricians and Gynaecologists.
21
Mukherjee R A S, Hollins S, Abou-Saleh M T et al (2005). Low level alcohol consumption and the fetus.
British Medical Journal. 330: 375–6.](https://image.slidesharecdn.com/guiasalcoholuk-130415104347-phpapp02/85/Guias-alcohol-uk-129-320.jpg)
![cobber Pack: U PL: CWE1 [E] Processed: [03-01-2012 16:32] Job: 015231 Unit: PG03
Ev 82 Science and Technology Committee: Evidence
22
Sood B, Delaney-Black V, Covington C et al (2001). Prenatal alcohol exposure and childhood behaviour at
age six to seven years L I. Dose-response effect. Paediatrics 108: e34
23
Little J F, Hepper P G & Dornan J C (2002). Maternal alcohol consumption during pregnancy and fetal
startle behaviour. Physiology and Behaviour 76: 691–4.
24
Hepper P G, Dornan J C & Little J F (2005). Maternal alcohol consumption during pregnancy may delay
the developmental of spontaneous fetal startle behaviour. Physiology and Behaviour 83: 711–4.
25
Sayal K, Heron J & Golding J (2007). Prenatal alcohol exposure and gender differences in childhood mental
health problems: a longtitudinal population-based study. Paediatrics 119: 426–34.
Printed in the United Kingdom by The Stationery Office Limited
01/2012 015231 19585](https://image.slidesharecdn.com/guiasalcoholuk-130415104347-phpapp02/85/Guias-alcohol-uk-130-320.jpg)

This document summarizes the report of the House of Commons Science and Technology Committee on the UK government's alcohol consumption guidelines. It provides background on the guidelines and their history. It discusses the evidence base for the guidelines and whether it has been adequately reviewed. It also examines how well the guidelines are communicated to and understood by the public, and compares the UK guidelines to those of other countries. The report concludes that the evidence base for using purported health benefits of alcohol as a basis for daily guidelines is weak. It finds public awareness of guidelines is high but understanding is lacking. It recommends the government establish a working group to thoroughly review the evidence and advise on updating the guidelines.


