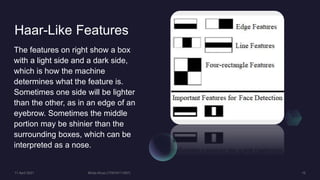
Face Detection
Using Viola-
Jones Algorithm
Agenda
Introduction
Face
Recognition
Face
Detection
Face
Detection
Viola-Jones Algorithm
Viola-Jones outlines a box and
searches for a face within the box. It
is essentially searching for these
haar-like features, which will be
explained later. The box moves a
step to the right after going through
every tile in the picture. In this case,
we have used a large box size and
taken large steps for demonstration,
but in general, you can change the
box size and step size according to
your needs.
Haar-Like Features
With smaller steps, a number of
boxes detect face-like features
(Haar-like features) and the data of
all of those boxes put together,
helps the algorithm determine
where the face is.
Haar-Like Features
The features on right show a box
with a light side and a dark side,
which is how the machine
determines what the feature is.
Sometimes one side will be lighter
than the other, as in an edge of an
eyebrow. Sometimes the middle
portion may be shinier than the
surrounding boxes, which can be
interpreted as a nose.
Haar-Like Features
There are 3 types of Haar-like
features that Viola and Jones
identified in their research:
• Edge features
• Line-features
• Four-sided features
Haar-Like Features
These features help the machine
understand what the image is.
Imagine what the edge of a table
would look like on a b&w image.
One side will be lighter than the
other, creating that edge like b&w
feature as you can see in the
picture.
Haar-Like Features
In the two important features for
Face Detection, the horizontal and
the vertical features describe what
eyebrows and the nose,
respectively, look like to the
machine. Additionally, when the
images are inspected, each feature
has a value of its own. It’s quite
easy to calculate: Subtract White
area from the Black area.
Haar-Like Features
Imagine our haar-like feature was converted
into a grid. Each square represents a pixel.
For demonstration, we choose a 4 x 8 grid,
but in reality, there would be many more
pixels and thus a much larger grid for a
certain feature. The numbers in the boxes
represent the darkness of the features. The
higher it is, the darker the pixel. Thus, you
can see the numbers are higher on the right
side than on the left side. Now if you add up
the numbers on the two left-sided (white)
columns, and subtract it from the sum of the
right-sided columns, you will get the value of
the particular feature.
Haar-Like Features
So in this case, the value of our feature is →
(0.5 + 0.4 + 0.5 +0.6 + 0.4 + 0.7 + 0.5 + 0.4
+
0.4 + 0.5 + 0.6 + 0.8 + 0.5 + 0.7 + 0.6 + 0.6)
-
(0.1 + 0.1 + 0.2 + 0. 2+ 0.2 + 0.1 + 0.2 + 0.2
+
0.2 + 0.3 + 0.2 + 0.1 + 0.2 + 0.3 + 0.2 + 0.2)
B - W= 8.7 - 3
= 5.7
Integral Image
In reality, these calculations can be very
intensive since the number of pixels would
be much greater within a large feature.
The integral image plays its part in
allowing us to perform these intensive
calculations quickly so we can understand
whether a feature of a number of features
fit the criteria.
Integral Image
Now imagine the one highlighted in red is
our grid for a certain feature, and we are
trying to calculate the value of that feature.
Normally we would just add up the boxes,
but since that can be computationally
intensive, we will create an integral image.
Integral Image
To calculate the value of a single box in
the integral image, we take the sum of all
the boxes to its left.
Integral Image
The green box in the integral image is
calculated as the sum of the highlighted
area in the regular image. If we did this for
every box, we would have a sequence
going through the grid and it may look
something like the image below.
All we have to do is look at the 4 corners
of our feature, and add the purples,
subtract the greens.
→ 168–114 + 79–110 = 23
Why Integral Image?
Haar-like features are actually rectangular,
and the integral image process allows us
to find a feature within an image very
easily as we already know the sum value
of a particular square and to find the
difference between two rectangles in the
regular image, we just need to subtract
two squares in the integral image. So even
if you had a 1000 x 1000 pixels in your
grid, the integral image method makes the
calculations much less intensive and can
save a lot of time for any facial detection
model.
Flow For Face
Detection
Conditions For
Eyes & Upper
Body Detection
Summary
Thank You

GUI based Face detection using Viola-Jones algorithm in MATLAB.

  • 1.
  • 2.
  • 3.
  • 4.
  • 5.
  • 6.
  • 7.
  • 8.
    Viola-Jones Algorithm Viola-Jones outlinesa box and searches for a face within the box. It is essentially searching for these haar-like features, which will be explained later. The box moves a step to the right after going through every tile in the picture. In this case, we have used a large box size and taken large steps for demonstration, but in general, you can change the box size and step size according to your needs.
  • 9.
    Haar-Like Features With smallersteps, a number of boxes detect face-like features (Haar-like features) and the data of all of those boxes put together, helps the algorithm determine where the face is.
  • 10.
    Haar-Like Features The featureson right show a box with a light side and a dark side, which is how the machine determines what the feature is. Sometimes one side will be lighter than the other, as in an edge of an eyebrow. Sometimes the middle portion may be shinier than the surrounding boxes, which can be interpreted as a nose.
  • 11.
    Haar-Like Features There are3 types of Haar-like features that Viola and Jones identified in their research: • Edge features • Line-features • Four-sided features
  • 12.
    Haar-Like Features These featureshelp the machine understand what the image is. Imagine what the edge of a table would look like on a b&w image. One side will be lighter than the other, creating that edge like b&w feature as you can see in the picture.
  • 13.
    Haar-Like Features In thetwo important features for Face Detection, the horizontal and the vertical features describe what eyebrows and the nose, respectively, look like to the machine. Additionally, when the images are inspected, each feature has a value of its own. It’s quite easy to calculate: Subtract White area from the Black area.
  • 14.
    Haar-Like Features Imagine ourhaar-like feature was converted into a grid. Each square represents a pixel. For demonstration, we choose a 4 x 8 grid, but in reality, there would be many more pixels and thus a much larger grid for a certain feature. The numbers in the boxes represent the darkness of the features. The higher it is, the darker the pixel. Thus, you can see the numbers are higher on the right side than on the left side. Now if you add up the numbers on the two left-sided (white) columns, and subtract it from the sum of the right-sided columns, you will get the value of the particular feature.
  • 15.
    Haar-Like Features So inthis case, the value of our feature is → (0.5 + 0.4 + 0.5 +0.6 + 0.4 + 0.7 + 0.5 + 0.4 + 0.4 + 0.5 + 0.6 + 0.8 + 0.5 + 0.7 + 0.6 + 0.6) - (0.1 + 0.1 + 0.2 + 0. 2+ 0.2 + 0.1 + 0.2 + 0.2 + 0.2 + 0.3 + 0.2 + 0.1 + 0.2 + 0.3 + 0.2 + 0.2) B - W= 8.7 - 3 = 5.7
  • 16.
    Integral Image In reality,these calculations can be very intensive since the number of pixels would be much greater within a large feature. The integral image plays its part in allowing us to perform these intensive calculations quickly so we can understand whether a feature of a number of features fit the criteria.
  • 17.
    Integral Image Now imaginethe one highlighted in red is our grid for a certain feature, and we are trying to calculate the value of that feature. Normally we would just add up the boxes, but since that can be computationally intensive, we will create an integral image.
  • 18.
    Integral Image To calculatethe value of a single box in the integral image, we take the sum of all the boxes to its left.
  • 19.
    Integral Image The greenbox in the integral image is calculated as the sum of the highlighted area in the regular image. If we did this for every box, we would have a sequence going through the grid and it may look something like the image below. All we have to do is look at the 4 corners of our feature, and add the purples, subtract the greens. → 168–114 + 79–110 = 23
  • 20.
    Why Integral Image? Haar-likefeatures are actually rectangular, and the integral image process allows us to find a feature within an image very easily as we already know the sum value of a particular square and to find the difference between two rectangles in the regular image, we just need to subtract two squares in the integral image. So even if you had a 1000 x 1000 pixels in your grid, the integral image method makes the calculations much less intensive and can save a lot of time for any facial detection model.
  • 21.
  • 22.
    Conditions For Eyes &Upper Body Detection
  • 23.
  • 24.