GUI
•
0 likes•119 views
This document describes a GUI developed in Python for reading and viewing EEG and PSG signals in EDF format. The GUI allows annotations to be made in time records, loads and saves annotations to a text file, filters data, and generates a PDF report with statistics. PSG is a sleep study that measures physiological variables during sleep from an 8 hour EDF recording containing signals like EEG, EOG, EMG, and ECG. The GUI displays patient and signal information after loading an EDF, allows viewing selected signals by adjusting amplitude and time windows, and reading, adding, deleting, and filtering annotations for events like sleep states and patterns. It can generate a PDF report showing the distribution of events by sleep state and in time
Report
Share
Report
Share
Download to read offline

Recommended
Deep Recurrent Neural Network for Multi-target Filtering
Mehryar Emambakhsh, Alessandro Bay, and Eduard Vazquez, "Deep Recurrent Neural Network for Multi-target Filtering", 25th International Conference MultiMedia Modelling (MMM), Thessaloniki, Greece, pp. 519--531, 2018
Detersivi alla spina_sapospina_sapo_oxitex
SAPOOXITEX
Detersivo alla Spina per un bianco e un pulito impeccabile ed ecologico
SAPOOXITEX è un detersivo alla spina concentrato, un innovativo coadiuvante del lavaggio che in abbinamento al normale detersivo, al dosaggio consigliato, consente di ottenere un’ottima degradazione di tutte le macchie anche le più ostinate, mantenendo il bianco brillante; crea, infatti, un’azione sinergica con i tensioattivi, esaltando le loro capacità di detergenza.
SAPOOXITEX è il detersivo sfuso, che a contatto con l’acqua e i normali detersivi, ha uno sviluppo di ossigeno bilanciato che agisce in modo selettivo come candeggiante del bianco senza intaccare la maggior parte dei colori. E’ ideale per spugne, asciugamani, lenzuola, etc, oltre che per indumenti tessuti di fibra vegetale (cotone, lino). Inoltre non è secondaria la sua alta azione igienizzante che ricopre una funzione importante specialmente se utilizzato in lavanderie a gettone, industriali o istituti geriatrico/ospedalieri. Il danno chimico alle fibre dei tessuti dopo ripetuti lavaggi è IRRILEVANTE rispetto agli altri sbiancanti tipo ipoclorito ecc.; l’effetto di usura è dimezzato anche rispetto all’acqua ossigenata.
SAPOOXITEX è un detersivo alla spina completamente biodegradabile.
Padre rafael ,servicio
Presentación para mostrar el carácter servicial del padre Rafael García reflejado en su compromiso pastoral y sus obras
Đề tài tốt nghiệp "Nâng cao khả năng đáp ứng nhu cầu tuyển dụng của sinh viên...
Đề tài tốt nghiệp "Nâng cao khả năng đáp ứng nhu cầu tuyển dụng của sinh viên ngành quản lý thị trường bất động sản"
Entiti Perniagaan
Dalam perniagaan terdapat perbezaan di antara syarikat dan perniagaan. Jika perniagaan terdapat 2 jenis iaitu jenis milikan tunggal atau jenis perkongsian.
Jika jenis perniagaan itu bersifat syarikat terdapat juga jenis syarikat sama ada berhad atau sendirian berhad
Private Label Clothing Brands in China | Daxue Consulting
China’s apparel market remains one of the fastest growing markets in the world, and the rise of e-commerce as well as fast fashion have further encouraged its growth.
As the quality in China’s apparel industry varies greatly, private label brands may be the solution addressing a growing consumer segment in the market.
Study examines hospitalist malpractice claims by Floyd Arthur (PPT)
Study examines hospitalist malpractice claims by Floyd Arthur (PPT)
http://carmoongroup.com
FPGA BASED HEARTBEATS MONITOR WITH FINGERTIP OPTICAL SENSOR
The heart is an organ of human body which has a vital function, small abnormalities can have a big impact
on the performance of the body. Heart disease is the number one cause of death in the world. Examination
of the heart can be detected from blood flow in the fingertips, in order to obtain information about the
number and rhythm of the heartbeat. This research aims to design and implement the FPGA board to
monitor the heart rate with optical sensors.The results of this study are expected to facilitate the patient's
medical team or independently in detecting heart health. The series is composed of blocks of sensors,
signal conditioning block, the block pulse counter, block timer 10 seconds and blocks the viewer. Based on
the test results of the 10 respondents with a variety of age and gender, has built a tool that the percentage
error of 3.94%.
Motion artifacts reduction in cardiac pulse signal acquired from video imaging
This study examines the possibility of remotely measuring the cardiac pulse activity of a patient, which could be an alternative technique to the classical method. This type of measurement is non-invasive. However, several limitations may deteriorate the accuracy of the results, including changes in ambient illumination, motion artifacts (MA) and other interferences that may occur through video recording. The paper in hand presents a new approach as a remedy for the aforementioned problem in cardiac pulse signals extracted from facial video recordings. Partitioning provides the basis for the presented MA reduction method; the acquired signals are partitioned into two sets for each second and every partition is shifted to the mean level and then all the partitions are recombined again into one signal, which is followed by low-pass filtering for enhancement. The proposed compared with ordinary pulse oximetry Photoplethysmographic (PPG) method. The resulted correlation coefficient was found (0.957) when calculated between the results of the proposed method and the ordinary one. Experiments were implemented using a common camera by creating a dataset from 11 subjects. The ease of implementation of this method with a simple that can be used to monitor the cardiac pulse rates in both home and the clinical environments.
IEEE Embedded Systems Top most Projects 2016-17 for Engineering Students Fre...
IEEE Embedded Systems Top most Projects 2016-17 for Engineering Students Fre...Elysium Technologies Private Ltd
WHY ELYSIUM?
“Ultimate Destination to Boost Your Career Opportunities”
Elysium Technologies is a member of IEEE, ACM, Springer, Science Direct and Wiley and authorized member of Microsoft and ICTACT. We have collaboration with 17 International universities and 7 highly renowned universities in India. We have access for 212 International journals. Currently, 675 research scholars are pursuing their research work with us. Over the years, we have offered projects around 75000 IEEE titles.
• IEEE-based real-time projects
• Projects handled by the highly qualified and experienced experts with more than decades of experience
• Free Software Installations
• Free Video guide, Abstract, base paper and presentations
• Continuous support until Project Completion
• Feasible and convenient appointments for technical discussion
• Online chat sessions
• Live interactive sessions with the technical teams
We assure our best services always.
FACILITIES
Our curriculum is enhanced with highly innovative resources, unique professional approach, including a variety of instructional strategies and collaborative activities to promote professional advancement of the clients. Using a powerful communication interface, Our ETPL enables the students and research scholars to engage in the participatory sessions with the technical team. Based on the current technologies, Elysium has the expertise to design the wired and wireless frameworks and training delivery platform to meet the educational needs of the students and scholars.
24/7 Support
Our online support systems allow the students to give some feedbacks, comments, suggestions, testimonials and uploading of resumes through online. Our best-in-class online ticket support seamlessly routes the inquiries created through email, web-forms and phone calls into a simple, easy-to-use, multi-user, web-based ticket support platform. We have Live Chat support for providing instant and incessant support for the clients.
WHY FINAL YEAR PROJECTS ASSUME MUCH IMPORTANCE?
Irrespective of your discipline in Engineering or Science, the corporate recruiters appraise the worth and competency for the post mainly on the basis of the knowledge gained in the final year project, as they deem it to be a precursor to the real time work environment. Projects are a great opportunity to demonstrate your creative abilities and independence. It stretches your ability to reach the limits beyond the expectations.
Visit us: http://elysiumtechnologies.com/
Mobile No: 9944793398,9677724437
Chat with us: http://support365.elysiumgroups.com/livechat/chat.phpEEG SIGNAL IDENTIFICATION USING SINGLE-LAYER NEURAL NETWORK
EEG signal analysis is applied in various fields such as medicine, communication and control. To control based on EEG signals achieved good result, the system must identify effectively EEG signals. In this paper,
a novel approach proposes the EEG signal identification based on image with the EEG signal processing via Wavelet transform and the identification via single-layer neural network. The system model is designed and evaluated with the dataset of 21,000 samples. The accuracy rate can obtain 91.15%.
Fpga based heartbeats monitor with
The heart is an organ of human body which has a vital function, small abnormalities can have a big impact
on the performance of the body. Heart disease is the number one cause of death in the world. Examination
of the heart can be detected from blood flow in the fingertips, in order to obtain information about the
number and rhythm of the heartbeat. This research aims to design and implement the FPGA board to
monitor the heart rate with optical sensors.The results of this study are expected to facilitate the patient's
medical team or independently in detecting heart health. The series is composed of blocks of sensors,
signal conditioning block, the block pulse counter, block timer 10 seconds and blocks the viewer. Based on
the test results of the 10 respondents with a variety of age and gender, has built a tool that the percentage
error of 3.94%.
A Study of EEG Based MI BCI for Imaginary Vowels and Words
Some people may have congenital or acquired biological or physical disabilities. For individuals in this situation, some positive developments are experienced with the advancement of technology. One of these developments can be considered today as BCI Brain Computer Interface .BCI systems can be divided into invasive and non invasive. Different techniques are used to obtain brain activities in non invasive BCI systems. Some of these techniques are EEG, ECoG, fNIRS, MEG, PET, MRI. Among these techniques, EEG and fNIRS are often preferred because of their easy applicability compared to other techniques. In this study, EEG based motor imagery BCI system is used. In this study, an experimental BCI system has been developed in which Turkish vowels that individuals say imaginatively are perceived over the EEG signal. In the methods section of this article, information is given about the experimental environment and techniques used in the study. The results obtained with the designed system are included in the results section. In the conclusion part, a general evaluation of the study is made and improvements that can be made to improve it are emphasized. Kadir Haltas | Atilla Ergüzen | Erdal Erdal "A Study of EEG Based MI-BCI for Imaginary Vowels and Words" Published in International Journal of Trend in Scientific Research and Development (ijtsrd), ISSN: 2456-6470, Volume-5 | Issue-1 , December 2020, URL: https://www.ijtsrd.com/papers/ijtsrd38165.pdf Paper URL : https://www.ijtsrd.com/engineering/computer-engineering/38165/a-study-of-eeg-based-mibci-for-imaginary-vowels-and-words/kadir-haltas
EEG S IGNAL Q UANTIFICATION B ASED ON M ODUL L EVELS
This article proposes a contribution to quantify EE
G signals outline. This technique uses two tools fo
r EEG
signal characteristics extraction. Our tests were r
ealized on the basis of 32 canals EEG canals using
Neuroscan software. EEG example demonstration is re
ferenced CZ and is sampled at 1000HZ. The
principal aim of this technique is to reduce the im
portant volume of EEG signal data Without losing an
y
information. EEG signals are quantified on the basi
s of a whole predefined levels The obtained results
show that an EEG alignment can be posted in a quant
ified form.
Mini Project final report on " LEAKY BUCKET ALGORITHM "
The project “Leaky Bucket Algorithm” is based on computer networks.The leaky bucket algorithm is a general algorithm that can be effectively used to police real time traffic. Both Frame Relay and Aysnchronous Transfer Mode (ATM) networks use a form of the leaky bucket algorithm for traffic management.
For designing this graphical project we require the knowledge of both computer graphics and the language in which it is to be coded.The use of the language helps in designing a package more user friendly since for a general user high end languages creates complexities in understanding and usage.OpenGL provides us with all the inbuilt functions which makes us easy to understand graphics.
CLASSIFICATION OF ECG ARRHYTHMIAS USING /DISCRETE WAVELET TRANSFORM AND NEURA...
Automatic recognition of cardiac arrhythmias is important for diagnosis of cardiac abnormalies. Several algorithms have been proposed to classify ECG arrhythmias; however, they cannot perform very well. Therefore, in this paper, an expert system for ElectroCardioGram (ECG) arrhythmia classification is proposed. Discrete wavelet transform is used for processing ECG recordings, and extracting some features, and the Multi-Layer Perceptron (MLP) neural network performs the classification task. Two types of arrhythmias can be detected by the proposed system. Some recordings of the MIT-BIH arrhythmias database have been used for training and testing our neural network based classifier. The simulation results show that the classification accuracy of our algorithm is 96.5% using 10 files including normal and two arrhythmias.
EEG Mouse:A Machine Learning-Based Brain Computer Interface_interface
he main idea of the current work is to use a wireless Electroencephalography (EEG) headset as a remote control for the mouse cursor of a personal computer. The proposed system uses EEG signals as a communication link between brains and computers. Signal records obtained from the PhysioNet EEG dataset were analyzed using the Coif lets wavelets and many features were extracted using different amplitude estimators for the wavelet coefficients. The extracted features were inputted into machine learning algorithms to generate the decision rules required for our application. The suggested real time implementation of the system was tested and very good performance was achieved. This system could be helpful for disabled people as they can control computer applications via the imagination of fists and feet movements in addition to closing eyes for a short period of time
Non-Contact Health Monitoring System Using Image and Signal Processing
Presently digital medical devices promise to transform the future of medicine because of their ability to produce exquisitely detailed individual physiological data. As ordinary people start to have access and control over their own physiological data so that they can play a more active role in the management of their health. Currently many techniques are available for counting our heartbeat but it all needs bundles of sensors and wires. For heartbeat measurement using Electrocardiograph(ECG) method, we have to attach a bundle of leads in our chest and have to use adhesive gel. It is very difficult to patients and it can cause irritation to the skin. Another type is pulse oximeters and sensors, in this method sensors are attached to the finger tips or earlobes. This is also difficult for user.
In case of "Non-contact health monitoring system using image and signal processing" which gives contact free measurement about our physiological information using basic image processing devices. Users have the experience of real time health monitoring by just looking into "medical mirror". It recognizes our heartbeat without any external or internal sensor and displays it in real time. This invention helps people to access their own physiological data.
A Wearable Rehabilitation Device For Paralysis
With the huge development and the latest technological advancement in mechatronics, prosthetic devices have acquired interest in many different fields such as medical and industrial fields. A prosthetic device can be an external wearable mobile machine that covers the body or part of it. It is generated by pneumatics and electric motors. It can be installed on an upper and lower limb. Moreover, it can be used for different purposes such as rehabilitation, power assistance, diagnostics, monitoring, ergonomics, etc. Most of the existing wearable devices face different problems in terms of size, cost and weight; they are huge, expensive and heavy. Therefore, the goal of this project is to design a portable, lightweight and low-cost rehabilitation system for people with a paralyzed hand. The wearable device allows a user to perform specific movements and exercises to train the patient's impaired hand. Thus, the user gradually starts to restore the functionality of his hand.
More Related Content
Viewers also liked
Viewers also liked (7)
Similar to GUI
FPGA BASED HEARTBEATS MONITOR WITH FINGERTIP OPTICAL SENSOR
The heart is an organ of human body which has a vital function, small abnormalities can have a big impact
on the performance of the body. Heart disease is the number one cause of death in the world. Examination
of the heart can be detected from blood flow in the fingertips, in order to obtain information about the
number and rhythm of the heartbeat. This research aims to design and implement the FPGA board to
monitor the heart rate with optical sensors.The results of this study are expected to facilitate the patient's
medical team or independently in detecting heart health. The series is composed of blocks of sensors,
signal conditioning block, the block pulse counter, block timer 10 seconds and blocks the viewer. Based on
the test results of the 10 respondents with a variety of age and gender, has built a tool that the percentage
error of 3.94%.
Motion artifacts reduction in cardiac pulse signal acquired from video imaging
This study examines the possibility of remotely measuring the cardiac pulse activity of a patient, which could be an alternative technique to the classical method. This type of measurement is non-invasive. However, several limitations may deteriorate the accuracy of the results, including changes in ambient illumination, motion artifacts (MA) and other interferences that may occur through video recording. The paper in hand presents a new approach as a remedy for the aforementioned problem in cardiac pulse signals extracted from facial video recordings. Partitioning provides the basis for the presented MA reduction method; the acquired signals are partitioned into two sets for each second and every partition is shifted to the mean level and then all the partitions are recombined again into one signal, which is followed by low-pass filtering for enhancement. The proposed compared with ordinary pulse oximetry Photoplethysmographic (PPG) method. The resulted correlation coefficient was found (0.957) when calculated between the results of the proposed method and the ordinary one. Experiments were implemented using a common camera by creating a dataset from 11 subjects. The ease of implementation of this method with a simple that can be used to monitor the cardiac pulse rates in both home and the clinical environments.
IEEE Embedded Systems Top most Projects 2016-17 for Engineering Students Fre...
IEEE Embedded Systems Top most Projects 2016-17 for Engineering Students Fre...Elysium Technologies Private Ltd
WHY ELYSIUM?
“Ultimate Destination to Boost Your Career Opportunities”
Elysium Technologies is a member of IEEE, ACM, Springer, Science Direct and Wiley and authorized member of Microsoft and ICTACT. We have collaboration with 17 International universities and 7 highly renowned universities in India. We have access for 212 International journals. Currently, 675 research scholars are pursuing their research work with us. Over the years, we have offered projects around 75000 IEEE titles.
• IEEE-based real-time projects
• Projects handled by the highly qualified and experienced experts with more than decades of experience
• Free Software Installations
• Free Video guide, Abstract, base paper and presentations
• Continuous support until Project Completion
• Feasible and convenient appointments for technical discussion
• Online chat sessions
• Live interactive sessions with the technical teams
We assure our best services always.
FACILITIES
Our curriculum is enhanced with highly innovative resources, unique professional approach, including a variety of instructional strategies and collaborative activities to promote professional advancement of the clients. Using a powerful communication interface, Our ETPL enables the students and research scholars to engage in the participatory sessions with the technical team. Based on the current technologies, Elysium has the expertise to design the wired and wireless frameworks and training delivery platform to meet the educational needs of the students and scholars.
24/7 Support
Our online support systems allow the students to give some feedbacks, comments, suggestions, testimonials and uploading of resumes through online. Our best-in-class online ticket support seamlessly routes the inquiries created through email, web-forms and phone calls into a simple, easy-to-use, multi-user, web-based ticket support platform. We have Live Chat support for providing instant and incessant support for the clients.
WHY FINAL YEAR PROJECTS ASSUME MUCH IMPORTANCE?
Irrespective of your discipline in Engineering or Science, the corporate recruiters appraise the worth and competency for the post mainly on the basis of the knowledge gained in the final year project, as they deem it to be a precursor to the real time work environment. Projects are a great opportunity to demonstrate your creative abilities and independence. It stretches your ability to reach the limits beyond the expectations.
Visit us: http://elysiumtechnologies.com/
Mobile No: 9944793398,9677724437
Chat with us: http://support365.elysiumgroups.com/livechat/chat.phpEEG SIGNAL IDENTIFICATION USING SINGLE-LAYER NEURAL NETWORK
EEG signal analysis is applied in various fields such as medicine, communication and control. To control based on EEG signals achieved good result, the system must identify effectively EEG signals. In this paper,
a novel approach proposes the EEG signal identification based on image with the EEG signal processing via Wavelet transform and the identification via single-layer neural network. The system model is designed and evaluated with the dataset of 21,000 samples. The accuracy rate can obtain 91.15%.
Fpga based heartbeats monitor with
The heart is an organ of human body which has a vital function, small abnormalities can have a big impact
on the performance of the body. Heart disease is the number one cause of death in the world. Examination
of the heart can be detected from blood flow in the fingertips, in order to obtain information about the
number and rhythm of the heartbeat. This research aims to design and implement the FPGA board to
monitor the heart rate with optical sensors.The results of this study are expected to facilitate the patient's
medical team or independently in detecting heart health. The series is composed of blocks of sensors,
signal conditioning block, the block pulse counter, block timer 10 seconds and blocks the viewer. Based on
the test results of the 10 respondents with a variety of age and gender, has built a tool that the percentage
error of 3.94%.
A Study of EEG Based MI BCI for Imaginary Vowels and Words
Some people may have congenital or acquired biological or physical disabilities. For individuals in this situation, some positive developments are experienced with the advancement of technology. One of these developments can be considered today as BCI Brain Computer Interface .BCI systems can be divided into invasive and non invasive. Different techniques are used to obtain brain activities in non invasive BCI systems. Some of these techniques are EEG, ECoG, fNIRS, MEG, PET, MRI. Among these techniques, EEG and fNIRS are often preferred because of their easy applicability compared to other techniques. In this study, EEG based motor imagery BCI system is used. In this study, an experimental BCI system has been developed in which Turkish vowels that individuals say imaginatively are perceived over the EEG signal. In the methods section of this article, information is given about the experimental environment and techniques used in the study. The results obtained with the designed system are included in the results section. In the conclusion part, a general evaluation of the study is made and improvements that can be made to improve it are emphasized. Kadir Haltas | Atilla Ergüzen | Erdal Erdal "A Study of EEG Based MI-BCI for Imaginary Vowels and Words" Published in International Journal of Trend in Scientific Research and Development (ijtsrd), ISSN: 2456-6470, Volume-5 | Issue-1 , December 2020, URL: https://www.ijtsrd.com/papers/ijtsrd38165.pdf Paper URL : https://www.ijtsrd.com/engineering/computer-engineering/38165/a-study-of-eeg-based-mibci-for-imaginary-vowels-and-words/kadir-haltas
EEG S IGNAL Q UANTIFICATION B ASED ON M ODUL L EVELS
This article proposes a contribution to quantify EE
G signals outline. This technique uses two tools fo
r EEG
signal characteristics extraction. Our tests were r
ealized on the basis of 32 canals EEG canals using
Neuroscan software. EEG example demonstration is re
ferenced CZ and is sampled at 1000HZ. The
principal aim of this technique is to reduce the im
portant volume of EEG signal data Without losing an
y
information. EEG signals are quantified on the basi
s of a whole predefined levels The obtained results
show that an EEG alignment can be posted in a quant
ified form.
Mini Project final report on " LEAKY BUCKET ALGORITHM "
The project “Leaky Bucket Algorithm” is based on computer networks.The leaky bucket algorithm is a general algorithm that can be effectively used to police real time traffic. Both Frame Relay and Aysnchronous Transfer Mode (ATM) networks use a form of the leaky bucket algorithm for traffic management.
For designing this graphical project we require the knowledge of both computer graphics and the language in which it is to be coded.The use of the language helps in designing a package more user friendly since for a general user high end languages creates complexities in understanding and usage.OpenGL provides us with all the inbuilt functions which makes us easy to understand graphics.
CLASSIFICATION OF ECG ARRHYTHMIAS USING /DISCRETE WAVELET TRANSFORM AND NEURA...
Automatic recognition of cardiac arrhythmias is important for diagnosis of cardiac abnormalies. Several algorithms have been proposed to classify ECG arrhythmias; however, they cannot perform very well. Therefore, in this paper, an expert system for ElectroCardioGram (ECG) arrhythmia classification is proposed. Discrete wavelet transform is used for processing ECG recordings, and extracting some features, and the Multi-Layer Perceptron (MLP) neural network performs the classification task. Two types of arrhythmias can be detected by the proposed system. Some recordings of the MIT-BIH arrhythmias database have been used for training and testing our neural network based classifier. The simulation results show that the classification accuracy of our algorithm is 96.5% using 10 files including normal and two arrhythmias.
EEG Mouse:A Machine Learning-Based Brain Computer Interface_interface
he main idea of the current work is to use a wireless Electroencephalography (EEG) headset as a remote control for the mouse cursor of a personal computer. The proposed system uses EEG signals as a communication link between brains and computers. Signal records obtained from the PhysioNet EEG dataset were analyzed using the Coif lets wavelets and many features were extracted using different amplitude estimators for the wavelet coefficients. The extracted features were inputted into machine learning algorithms to generate the decision rules required for our application. The suggested real time implementation of the system was tested and very good performance was achieved. This system could be helpful for disabled people as they can control computer applications via the imagination of fists and feet movements in addition to closing eyes for a short period of time
Non-Contact Health Monitoring System Using Image and Signal Processing
Presently digital medical devices promise to transform the future of medicine because of their ability to produce exquisitely detailed individual physiological data. As ordinary people start to have access and control over their own physiological data so that they can play a more active role in the management of their health. Currently many techniques are available for counting our heartbeat but it all needs bundles of sensors and wires. For heartbeat measurement using Electrocardiograph(ECG) method, we have to attach a bundle of leads in our chest and have to use adhesive gel. It is very difficult to patients and it can cause irritation to the skin. Another type is pulse oximeters and sensors, in this method sensors are attached to the finger tips or earlobes. This is also difficult for user.
In case of "Non-contact health monitoring system using image and signal processing" which gives contact free measurement about our physiological information using basic image processing devices. Users have the experience of real time health monitoring by just looking into "medical mirror". It recognizes our heartbeat without any external or internal sensor and displays it in real time. This invention helps people to access their own physiological data.
A Wearable Rehabilitation Device For Paralysis
With the huge development and the latest technological advancement in mechatronics, prosthetic devices have acquired interest in many different fields such as medical and industrial fields. A prosthetic device can be an external wearable mobile machine that covers the body or part of it. It is generated by pneumatics and electric motors. It can be installed on an upper and lower limb. Moreover, it can be used for different purposes such as rehabilitation, power assistance, diagnostics, monitoring, ergonomics, etc. Most of the existing wearable devices face different problems in terms of size, cost and weight; they are huge, expensive and heavy. Therefore, the goal of this project is to design a portable, lightweight and low-cost rehabilitation system for people with a paralyzed hand. The wearable device allows a user to perform specific movements and exercises to train the patient's impaired hand. Thus, the user gradually starts to restore the functionality of his hand.
Using K-Nearest Neighbors and Support Vector Machine Classifiers in Personal ...
Using K-Nearest Neighbors and Support Vector Machine Classifiers in Personal ...IJCSIS Research Publications
In the present paper, electroencephalogram (EEG)
data have been used to human identification by computing
sample entropy and graph entropy as feature extractions. Used
two classifier types, which are K-Nearest Neighbors (K-NN) and
Support Vector Machine (SVM). Python and Matlab software
were used in this study and EEG data was collected by UCI
repository . Matlab used when Thirteen channels was applied as
feature extraction . The experimental results show that, Python
software classifies the EEG-UCI data better than MATLAB
environment software where the accuracy of KNN and SVM
were 85.2% and 91.5% respectively.A LOW COST EEG BASED BCI PROSTHETIC USING MOTOR IMAGERY
Brain Computer Interfaces (BCI) provide the opportunity to control external devices using the brain
ElectroEncephaloGram (EEG) signals. In this paper we propose two software framework in order to
control a 5 degree of freedom robotic and prosthetic hand. Results are presented where an Emotiv
Cognitive Suite (i.e. the 1st framework) combined with an embedded software system (i.e. an open source
Arduino board) is able to control the hand through character input associated with the taught actions of
the suite. This system provides evidence of the feasibility of brain signals being a viable approach to
controlling the chosen prosthetic. Results are then presented in the second framework. This latter one
allowed for the training and classification of EEG signals for motor imagery tasks. When analysing the
system, clear visual representations of the performance and accuracy are presented in the results using a
confusion matrix, accuracy measurement and a feedback bar signifying signal strength. Experiments with
various acquisition datasets were carried out and with a critical evaluation of the results given. Finally
depending on the classification of the brain signal a Python script outputs the driving command to the
Arduino to control the prosthetic. The proposed architecture performs overall good results for the design
and implementation of economically convenient BCI and prosthesis.
ECG SIGNAL ACQUISITION, FEATURE EXTRACTION AND HRV ANALYSIS USING BIOMEDICAL ...
This Paper contains the complete process of ECG/EKG signal Acquisition from
hardware to its analysis using LabVIEW and Biomedical Workbench. Hardware of ECG
has the amplification, filtering and conversion of analog ECG data to digital by using
Arduino Uno. The acquisition part deal with acquiring the hardware data to analyzable
file format into pc. Here 6-channel ADC in Arduino Uno with LabVIEW interface is used
for conversion. Now the acquired ECG data is processed and analyzed with biomedical
workbench that provides the various features of ECG signal processing. This system is
very easy to implement and cost effective
IRJET- Analysis of Electroencephalogram (EEG) Signals
https://www.irjet.net/archives/V5/i8/IRJET-V5I8306.pdf
Roka P.L. et al.: Software tool for analysing ventilation EIT data.
Swisstom Scientific Library; 16th International Conference on Biomedical Applications of Electrical Impedance Tomography, Neuchâtel Switzerland, June 2-5, 2015
Similar to GUI (20)
FPGA BASED HEARTBEATS MONITOR WITH FINGERTIP OPTICAL SENSOR
FPGA BASED HEARTBEATS MONITOR WITH FINGERTIP OPTICAL SENSOR
FPGA BASED HEARTBEATS MONITOR WITH FINGERTIP OPTICAL SENSOR
FPGA BASED HEARTBEATS MONITOR WITH FINGERTIP OPTICAL SENSOR
Motion artifacts reduction in cardiac pulse signal acquired from video imaging
Motion artifacts reduction in cardiac pulse signal acquired from video imaging
IEEE Embedded Systems Top most Projects 2016-17 for Engineering Students Fre...
IEEE Embedded Systems Top most Projects 2016-17 for Engineering Students Fre...
EEG SIGNAL IDENTIFICATION USING SINGLE-LAYER NEURAL NETWORK
EEG SIGNAL IDENTIFICATION USING SINGLE-LAYER NEURAL NETWORK
A Study of EEG Based MI BCI for Imaginary Vowels and Words
A Study of EEG Based MI BCI for Imaginary Vowels and Words
EEG S IGNAL Q UANTIFICATION B ASED ON M ODUL L EVELS
EEG S IGNAL Q UANTIFICATION B ASED ON M ODUL L EVELS
Mini Project final report on " LEAKY BUCKET ALGORITHM "
Mini Project final report on " LEAKY BUCKET ALGORITHM "
CLASSIFICATION OF ECG ARRHYTHMIAS USING /DISCRETE WAVELET TRANSFORM AND NEURA...
CLASSIFICATION OF ECG ARRHYTHMIAS USING /DISCRETE WAVELET TRANSFORM AND NEURA...
EEG Mouse:A Machine Learning-Based Brain Computer Interface_interface
EEG Mouse:A Machine Learning-Based Brain Computer Interface_interface
Non-Contact Health Monitoring System Using Image and Signal Processing
Non-Contact Health Monitoring System Using Image and Signal Processing
Using K-Nearest Neighbors and Support Vector Machine Classifiers in Personal ...
Using K-Nearest Neighbors and Support Vector Machine Classifiers in Personal ...
A LOW COST EEG BASED BCI PROSTHETIC USING MOTOR IMAGERY
A LOW COST EEG BASED BCI PROSTHETIC USING MOTOR IMAGERY
ECG SIGNAL ACQUISITION, FEATURE EXTRACTION AND HRV ANALYSIS USING BIOMEDICAL ...
ECG SIGNAL ACQUISITION, FEATURE EXTRACTION AND HRV ANALYSIS USING BIOMEDICAL ...
IRJET- Analysis of Electroencephalogram (EEG) Signals
IRJET- Analysis of Electroencephalogram (EEG) Signals
Roka P.L. et al.: Software tool for analysing ventilation EIT data.
Roka P.L. et al.: Software tool for analysing ventilation EIT data.
GUI
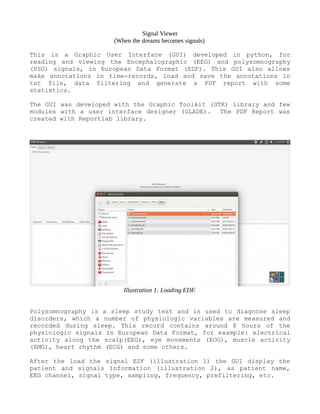
- 1. Signal Viewer (When the dreams becomes signals) This is a Graphic User Interface (GUI) developed in python, for reading and viewing the Encephalographic (EEG) and polysomnography (PSG) signals, in European Data Format (EDF). This GUI also allows make annotations in time-records, load and save the annotations in txt file, data filtering and generate a PDF report with some statistics. The GUI was developed with the Graphic Toolkit (GTK) library and few modules with a user interface designer (GLADE). The PDF Report was created with Reportlab library. Polysomnography is a sleep study test and is used to diagnose sleep disorders, which a number of physiologic variables are measured and recorded during sleep. This record contains around 8 hours of the physiologic signals in European Data Format, for example: electrical activity along the scalp(EEG), eye movements (EOG), muscle activity (EMG), heart rhythm (ECG) and some others. After the load the signal EDF (illustration 1) the GUI display the patient and signals Information (illustration 2), as patient name, EEG channel, signal type, sampling, frequency, prefiltering, etc. Illustration 1: Loading EDF.
- 2. Illustration 2: EDF Information loaded Illustration 4: Signals Display
- 3. In the illustration 4, the GUI displays the selected polysomnography signals by the combo-boxes, also it can change the signal amplitude and the time window size viewing. The GUI allow read, load, add and delete the duration of basic medical annotations, as dream states, cyclic alternate patterns subtypes and some activity autonomic. The illustration 5, show a extra window for filter design, the filter can be applied for any selected signal by the combo-box. For this develops Numpy and Matplotlib python libraries was used. The GUI generate a PDF report (illustration 6, 7) with some statistics: • Distribution of events by sleep states . • Distribution of events by sleep states in time. Illustration 5: Signal Filtering.
- 4. Illustration 6: PDF Report Generate
- 5. Illustration 7: PDF Report Generate