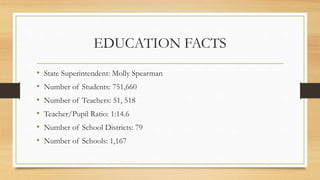
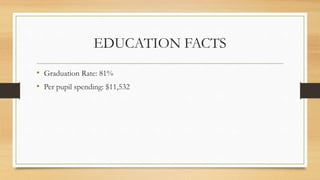
EDUCATIONAL
SYSTEM IN
SOUTH
CAROLINA
REPORTER: ISABEL D. GUAPE
SOUTH CAROLINA
• South Carolina, nicknamed "The Palmetto State," is
bordered by North Carolina, Georgia and the Atlantic
Ocean. It was the eighth state to ratify the U.S.
Constitution and to be admitted to the Union.
While Columbia is South Carolina’s capital and largest
city, Greenville is the state’s largest metropolitan area.
PUBLIC EDUCATION IN SOUTH
CAROLINA
• The South Carolina public school system (prekindergarten
through grade 12) operates within districts governed by locally
elected school boards and superintendents. In 2022, South
Carolina had 751,660 students enrolled in a total of 1,167 schools
in 79 school districts. There were 51,158 teachers in the public
schools, or roughly one teacher for every 15 students, compared to
the national average of 1:16. In 2020, South Carolina spent on
average $11,532 per pupil.The state's graduation rate was 81
percent in the 2018-2019 school year
DISTRICT TYPES
• School districts in South Carolina are
organized by county. Each county has at
least one public school district offering K-12
courses.
SCHOOL BOARD COMPOSITION
• South Carolina school board members are generally elected by residents of the school
district, although some school board members are appointed to fill vacancies until the
next election for the seat is held. South Carolina school board elections typically follow one
of these two methods:[
 At-large: All voters residing in the school district may vote for any candidates running,
regardless of geographic location.
 Trustee area at-large: All voters residing in the school district may vote for any
candidates running, but candidates must reside in specific geographic areas within the
school district.
• School boards can consists of five, seven or nine members. Board members serve terms of
two, three or four years.
STUDIES AND REPORTS
• Education Week, a publication that reports on many education issues throughout the country,
began using an evaluation system in 1997 to grade each state on various elements of education
performance. This system, called Quality Counts, uses official data on performance from each
state to generate report cards for all 50 states and the District of Columbia. The report card in
2014 uses six different categories:
1. Chance for success
2. K-12 achievement
3. Standards, assessments and accountability
4. The teaching profession
5. School finance
6. Transitions and alignment
• South Carolina received a score of 72.6, or a C average in the
"chance for success" category. This was below the national average.
The state's highest score was in "standards, assessments and
accountability" at 94.4, or an A average. The lowest score was in "K-
12 achievement" at 62.6, or a D average. South Carolina had the
highest score in the "standards, assessments and accountability"
category when compared to neighboring states. The chart below
displays the scores of South Carolina and its surrounding states.
Public education report cards, 2014
State
Chance for
success
K-12
achievemen
t
Standards,
assessment
s and
accountabil
ity
The
teaching
profession
School
finance
Transitions
and
alignment
South
Carolina
72.6 (C) 62.6 (D) 94.4 (A) 89.0 (B+) 68.7 (D+) 71.4 (C-)
Georgia 73.9 (C) 70.7 (C-) 91.1 (A-) 79.8 (B-) 71.6 (C-) 100.0 (A)
North
Carolina
75.7 (C) 69.8 (C-) 92.8 (A) 77.8 (C+) 67.0 (D+) 85.7 (B)
Tennessee 73.9 (C) 68.8 (D+) 90.0 (A-) 80.3 (B-) 64.5 (D) 92.9 (A)
United States 77.3 (C+) 70.2 (C-) 85.3 (B) 72.5 (C) 75.5 (C) 81.1 (B-)
Source: Education Week, "Quality Counts 2014"
A full discussion of how these numbers were generated can be found here.
NAEP scores
• The National Center for Education Statistics provides state-by-state data
on student achievement levels in mathematics and reading in
the National Assessment of Educational Progress (NAEP). The table below
presents the percentage of fourth and eighth grade students that scored
at or above proficient in reading and math during school year 2012-2013.
Compared to three neighboring states (Georgia, North Carolina, and
Tennessee), South Carolina had the smallest share of fourth grade
students who scored at or above proficient in both math and
reading.
Percent of students scoring at or above proficient, 2012-2013
Math - Grade 4 Math - Grade 8 Reading - Grade 4 Reading - Grade 8
South Carolina 35% 31% 28% 29%
Georgia 39% 29% 34% 32%
North Carolina 45% 36% 35% 33%
Tennessee 40% 28% 34% 33%
United States 41% 34% 34% 34%
Source: United States Department of Education, ED Data Express, "State Tables"
Graduation, ACT and SAT scores
• South Carolina schools reported a graduation rate of
77.6 percent, second lowest among its neighboring
states.
• In South Carolina, more students took the SAT than the
ACT, earning an average SAT score of 1436.
Comparison table for graduation rates and test scores, 2012-2013
State
Graduation rate, 2013
Average ACT composite,
2013
Average SAT composite,
2013
Percent
Quintile
ranking**
Score
Participati
on rate
Score
Participati
on rate
South
Carolina
77.6% Fourth 20.4 51% 1436 64%
Georgia 71.7% Fifth 20.7 51% 1452 75%
North
Carolina
82.5% Third 18.7 100% 1479 62%
Tennessee 86.3% Second 19.5 100% 1709 8%
United
States
81.4% 20.9 54% 1498 50%
**Graduation rates for states in the first quintile ranked in the top 20 percent nationally. Similarly, graduation rates for states in the
fifth quintile ranked in the bottom 20 percent nationally.
Sources: United States Department of Education, "ED Data Express"
ACT.org, "2013 ACT National and State Scores"
The Commonwealth Foundation, "SAT scores by state, 2013"
DROPOUT RATE
• The high school event dropout rate indicates the proportion of students who were
enrolled at some time during the school year and were expected to be enrolled in grades
nine through 12 in the following school year but were not enrolled by October 1 of the
following school year. Students who have graduated, transferred to another school, died,
moved to another country, or who are out of school due to illness are not considered
dropouts. The average public high school event dropout rate for the United States
remained constant at 3.3 percent for both school year 2010–2011 and school year 2011–
2012. The event dropout rate for South Carolina was lower than the national average at 2.8
percent in the 2010-2011 school year, and 2.5 percent in the 2011-2012 school year.
EDUCATIONAL CHOICE OPTIONS
• As of June 2015, school choice options in South
Carolina included charter schools, a tax incentive program, inter-
district open enrollment policies and online learning programs. In
addition, about 7.46 percent of school-age children in the state
attended private schools in the 2011-2012 academic year, and an
estimated 2.67 percent were homeschooled in 2012-2013.
GOVERNMENT SECTOR LOBBYING
The main education government sector
lobbying organization is the South
Carolina School Boards Association.
EDUCATION FUNDING AND
EXPENDITURES
• According to the National Association of State Budget Officers (NASBO), states
spent an average of 19.8 percent of their total budgets on elementary and
secondary education during fiscal year 2013. In addition, the United States
Census Bureau found that approximately 45.6 percent of the country's school
system revenue came from state sources while about 45.3 percent came from
local sources. The remaining portion of school system revenue came from federal
sources.
• South Carolina spent approximately 17.6 percent of its budget on elementary
and secondary education during fiscal year 2013. School system revenue came
primarily from state funds. South Carolina spent a smaller percentage of its
total budget on public education than any of its neighboring states.
PERSONNEL SALARIES
• According to the National Center for Education Statistics,
the average national salary for classroom teachers in
public elementary and secondary schools declined by 1.3
percent from the 1999-2000 school year to the 2012-2013
school year. During the same period in South Carolina,
the average salary decreased by 2.8 percent.
Estimated average salaries for teachers (in constant dollars**)
1999-2000 2009-2010 2011-2012 2012-2013
Percent
difference
South Carolina $49,308 $50,712 $48,217 $47,924 -2.8%
Georgia $56,062 $56,694 $53,819 $52,880 -5.7%
North Carolina $53,849 $50,010 $46,712 $45,947 -14.7%
Tennessee $49,645 $49,412 $47,866 $48,289 -2.7%
United States $57,133 $58,925 $56,340 $56,383 -1.3%
**"Constant dollars based on the Consumer Price Index (CPI), prepared by the Bureau of Labor Statistics, U.S.
Department of Labor, adjusted to a school-year basis. The CPI does not account for differences in inflation rates from state
to state."
TRANSPARENCY
• "South Carolina Spending Transparency" is the
transparency website sponsored by the state. It discloses
information about South Carolina's spending and is
managed by the Comptroller General. On August 30,
2007, then-Governor Mark Sanford signed South Carolina
Executive Order 2007-14, which mandated the creation of
the website.
ORGANIZATIONS
“
Our mission is to ensure that every student in South Carolina
receives an education that meets their individual needs while also
preparing them to be contributing members of society. We work
closely with students, parents, teachers, staff, school districts,
government officials, and the media to facilitate the best possible
education for South Carolina's students.
The Superintendent of Education is responsible generally for the administration of
the Department of Education. The Superintendent of Education is elected to a four-year term
Molly Mitchell Spearman was first elected to the office in 2014.
The South Carolina State Board of Education is the governing body for public elementary and
secondary education in the state. The board is composed of 17 members: 16 are appointed
from each of the state's judicial circuits by their respective legislative delegations and one is
appointed directly by the governor. Members serve four-year terms
UNIONS
In 2012 the Fordham Institute and Education Reform Now assessed the power and
influence of state teacher unions in all 50 states and the District of Columbia. Their rankings
were based on 37 different variables in five broad areas, including resources and
membership, involvement in politics, scope of bargaining, state policies and perceived
influence. South Carolina ranked 49th overall for union power and influence, or
"weakest," which was in the fifth of five tiers.
• The main union related to the South Carolina school system is the South Carolina
Education Association (SCEA), an affiliate of the National Education Association (NEA).
EDUCATION FACTS
• State Superintendent: Molly Spearman
• Number of Students: 751,660
• Number of Teachers: 51, 518
• Teacher/Pupil Ratio: 1:14.6
• Number of School Districts: 79
• Number of Schools: 1,167
EDUCATION FACTS
• Graduation Rate: 81%
• Per pupil spending: $11,532
QUESTION
• From the information's provided about the South Carolina Educational
System, what area do you think South Carolina needs to be improve?
THANK YOU FOR
LISTENING 

Guape_EdSystemSouthCarolina.pptx

  • 1.
  • 2.
    SOUTH CAROLINA • SouthCarolina, nicknamed "The Palmetto State," is bordered by North Carolina, Georgia and the Atlantic Ocean. It was the eighth state to ratify the U.S. Constitution and to be admitted to the Union. While Columbia is South Carolina’s capital and largest city, Greenville is the state’s largest metropolitan area.
  • 3.
    PUBLIC EDUCATION INSOUTH CAROLINA • The South Carolina public school system (prekindergarten through grade 12) operates within districts governed by locally elected school boards and superintendents. In 2022, South Carolina had 751,660 students enrolled in a total of 1,167 schools in 79 school districts. There were 51,158 teachers in the public schools, or roughly one teacher for every 15 students, compared to the national average of 1:16. In 2020, South Carolina spent on average $11,532 per pupil.The state's graduation rate was 81 percent in the 2018-2019 school year
  • 4.
    DISTRICT TYPES • Schooldistricts in South Carolina are organized by county. Each county has at least one public school district offering K-12 courses.
  • 5.
    SCHOOL BOARD COMPOSITION •South Carolina school board members are generally elected by residents of the school district, although some school board members are appointed to fill vacancies until the next election for the seat is held. South Carolina school board elections typically follow one of these two methods:[  At-large: All voters residing in the school district may vote for any candidates running, regardless of geographic location.  Trustee area at-large: All voters residing in the school district may vote for any candidates running, but candidates must reside in specific geographic areas within the school district. • School boards can consists of five, seven or nine members. Board members serve terms of two, three or four years.
  • 6.
    STUDIES AND REPORTS •Education Week, a publication that reports on many education issues throughout the country, began using an evaluation system in 1997 to grade each state on various elements of education performance. This system, called Quality Counts, uses official data on performance from each state to generate report cards for all 50 states and the District of Columbia. The report card in 2014 uses six different categories: 1. Chance for success 2. K-12 achievement 3. Standards, assessments and accountability 4. The teaching profession 5. School finance 6. Transitions and alignment
  • 7.
    • South Carolinareceived a score of 72.6, or a C average in the "chance for success" category. This was below the national average. The state's highest score was in "standards, assessments and accountability" at 94.4, or an A average. The lowest score was in "K- 12 achievement" at 62.6, or a D average. South Carolina had the highest score in the "standards, assessments and accountability" category when compared to neighboring states. The chart below displays the scores of South Carolina and its surrounding states.
  • 8.
    Public education reportcards, 2014 State Chance for success K-12 achievemen t Standards, assessment s and accountabil ity The teaching profession School finance Transitions and alignment South Carolina 72.6 (C) 62.6 (D) 94.4 (A) 89.0 (B+) 68.7 (D+) 71.4 (C-) Georgia 73.9 (C) 70.7 (C-) 91.1 (A-) 79.8 (B-) 71.6 (C-) 100.0 (A) North Carolina 75.7 (C) 69.8 (C-) 92.8 (A) 77.8 (C+) 67.0 (D+) 85.7 (B) Tennessee 73.9 (C) 68.8 (D+) 90.0 (A-) 80.3 (B-) 64.5 (D) 92.9 (A) United States 77.3 (C+) 70.2 (C-) 85.3 (B) 72.5 (C) 75.5 (C) 81.1 (B-) Source: Education Week, "Quality Counts 2014" A full discussion of how these numbers were generated can be found here.
  • 9.
    NAEP scores • TheNational Center for Education Statistics provides state-by-state data on student achievement levels in mathematics and reading in the National Assessment of Educational Progress (NAEP). The table below presents the percentage of fourth and eighth grade students that scored at or above proficient in reading and math during school year 2012-2013. Compared to three neighboring states (Georgia, North Carolina, and Tennessee), South Carolina had the smallest share of fourth grade students who scored at or above proficient in both math and reading.
  • 10.
    Percent of studentsscoring at or above proficient, 2012-2013 Math - Grade 4 Math - Grade 8 Reading - Grade 4 Reading - Grade 8 South Carolina 35% 31% 28% 29% Georgia 39% 29% 34% 32% North Carolina 45% 36% 35% 33% Tennessee 40% 28% 34% 33% United States 41% 34% 34% 34% Source: United States Department of Education, ED Data Express, "State Tables"
  • 11.
    Graduation, ACT andSAT scores • South Carolina schools reported a graduation rate of 77.6 percent, second lowest among its neighboring states. • In South Carolina, more students took the SAT than the ACT, earning an average SAT score of 1436.
  • 12.
    Comparison table forgraduation rates and test scores, 2012-2013 State Graduation rate, 2013 Average ACT composite, 2013 Average SAT composite, 2013 Percent Quintile ranking** Score Participati on rate Score Participati on rate South Carolina 77.6% Fourth 20.4 51% 1436 64% Georgia 71.7% Fifth 20.7 51% 1452 75% North Carolina 82.5% Third 18.7 100% 1479 62% Tennessee 86.3% Second 19.5 100% 1709 8% United States 81.4% 20.9 54% 1498 50% **Graduation rates for states in the first quintile ranked in the top 20 percent nationally. Similarly, graduation rates for states in the fifth quintile ranked in the bottom 20 percent nationally. Sources: United States Department of Education, "ED Data Express" ACT.org, "2013 ACT National and State Scores" The Commonwealth Foundation, "SAT scores by state, 2013"
  • 13.
    DROPOUT RATE • Thehigh school event dropout rate indicates the proportion of students who were enrolled at some time during the school year and were expected to be enrolled in grades nine through 12 in the following school year but were not enrolled by October 1 of the following school year. Students who have graduated, transferred to another school, died, moved to another country, or who are out of school due to illness are not considered dropouts. The average public high school event dropout rate for the United States remained constant at 3.3 percent for both school year 2010–2011 and school year 2011– 2012. The event dropout rate for South Carolina was lower than the national average at 2.8 percent in the 2010-2011 school year, and 2.5 percent in the 2011-2012 school year.
  • 14.
    EDUCATIONAL CHOICE OPTIONS •As of June 2015, school choice options in South Carolina included charter schools, a tax incentive program, inter- district open enrollment policies and online learning programs. In addition, about 7.46 percent of school-age children in the state attended private schools in the 2011-2012 academic year, and an estimated 2.67 percent were homeschooled in 2012-2013.
  • 15.
    GOVERNMENT SECTOR LOBBYING Themain education government sector lobbying organization is the South Carolina School Boards Association.
  • 16.
  • 17.
    • According tothe National Association of State Budget Officers (NASBO), states spent an average of 19.8 percent of their total budgets on elementary and secondary education during fiscal year 2013. In addition, the United States Census Bureau found that approximately 45.6 percent of the country's school system revenue came from state sources while about 45.3 percent came from local sources. The remaining portion of school system revenue came from federal sources. • South Carolina spent approximately 17.6 percent of its budget on elementary and secondary education during fiscal year 2013. School system revenue came primarily from state funds. South Carolina spent a smaller percentage of its total budget on public education than any of its neighboring states.
  • 18.
    PERSONNEL SALARIES • Accordingto the National Center for Education Statistics, the average national salary for classroom teachers in public elementary and secondary schools declined by 1.3 percent from the 1999-2000 school year to the 2012-2013 school year. During the same period in South Carolina, the average salary decreased by 2.8 percent.
  • 19.
    Estimated average salariesfor teachers (in constant dollars**) 1999-2000 2009-2010 2011-2012 2012-2013 Percent difference South Carolina $49,308 $50,712 $48,217 $47,924 -2.8% Georgia $56,062 $56,694 $53,819 $52,880 -5.7% North Carolina $53,849 $50,010 $46,712 $45,947 -14.7% Tennessee $49,645 $49,412 $47,866 $48,289 -2.7% United States $57,133 $58,925 $56,340 $56,383 -1.3% **"Constant dollars based on the Consumer Price Index (CPI), prepared by the Bureau of Labor Statistics, U.S. Department of Labor, adjusted to a school-year basis. The CPI does not account for differences in inflation rates from state to state."
  • 20.
    TRANSPARENCY • "South CarolinaSpending Transparency" is the transparency website sponsored by the state. It discloses information about South Carolina's spending and is managed by the Comptroller General. On August 30, 2007, then-Governor Mark Sanford signed South Carolina Executive Order 2007-14, which mandated the creation of the website.
  • 21.
    ORGANIZATIONS “ Our mission isto ensure that every student in South Carolina receives an education that meets their individual needs while also preparing them to be contributing members of society. We work closely with students, parents, teachers, staff, school districts, government officials, and the media to facilitate the best possible education for South Carolina's students.
  • 22.
    The Superintendent ofEducation is responsible generally for the administration of the Department of Education. The Superintendent of Education is elected to a four-year term Molly Mitchell Spearman was first elected to the office in 2014. The South Carolina State Board of Education is the governing body for public elementary and secondary education in the state. The board is composed of 17 members: 16 are appointed from each of the state's judicial circuits by their respective legislative delegations and one is appointed directly by the governor. Members serve four-year terms
  • 23.
    UNIONS In 2012 theFordham Institute and Education Reform Now assessed the power and influence of state teacher unions in all 50 states and the District of Columbia. Their rankings were based on 37 different variables in five broad areas, including resources and membership, involvement in politics, scope of bargaining, state policies and perceived influence. South Carolina ranked 49th overall for union power and influence, or "weakest," which was in the fifth of five tiers. • The main union related to the South Carolina school system is the South Carolina Education Association (SCEA), an affiliate of the National Education Association (NEA).
  • 24.
    EDUCATION FACTS • StateSuperintendent: Molly Spearman • Number of Students: 751,660 • Number of Teachers: 51, 518 • Teacher/Pupil Ratio: 1:14.6 • Number of School Districts: 79 • Number of Schools: 1,167
  • 25.
    EDUCATION FACTS • GraduationRate: 81% • Per pupil spending: $11,532
  • 26.
    QUESTION • From theinformation's provided about the South Carolina Educational System, what area do you think South Carolina needs to be improve?
  • 27.