Downloaded 539 times
![ALUMS‐OMP‐L2‐014 ALUMS OPERATIONAL PROCESS MANUAL
EDITION 1.2 EFFECTIVE DATE: 01January 2011
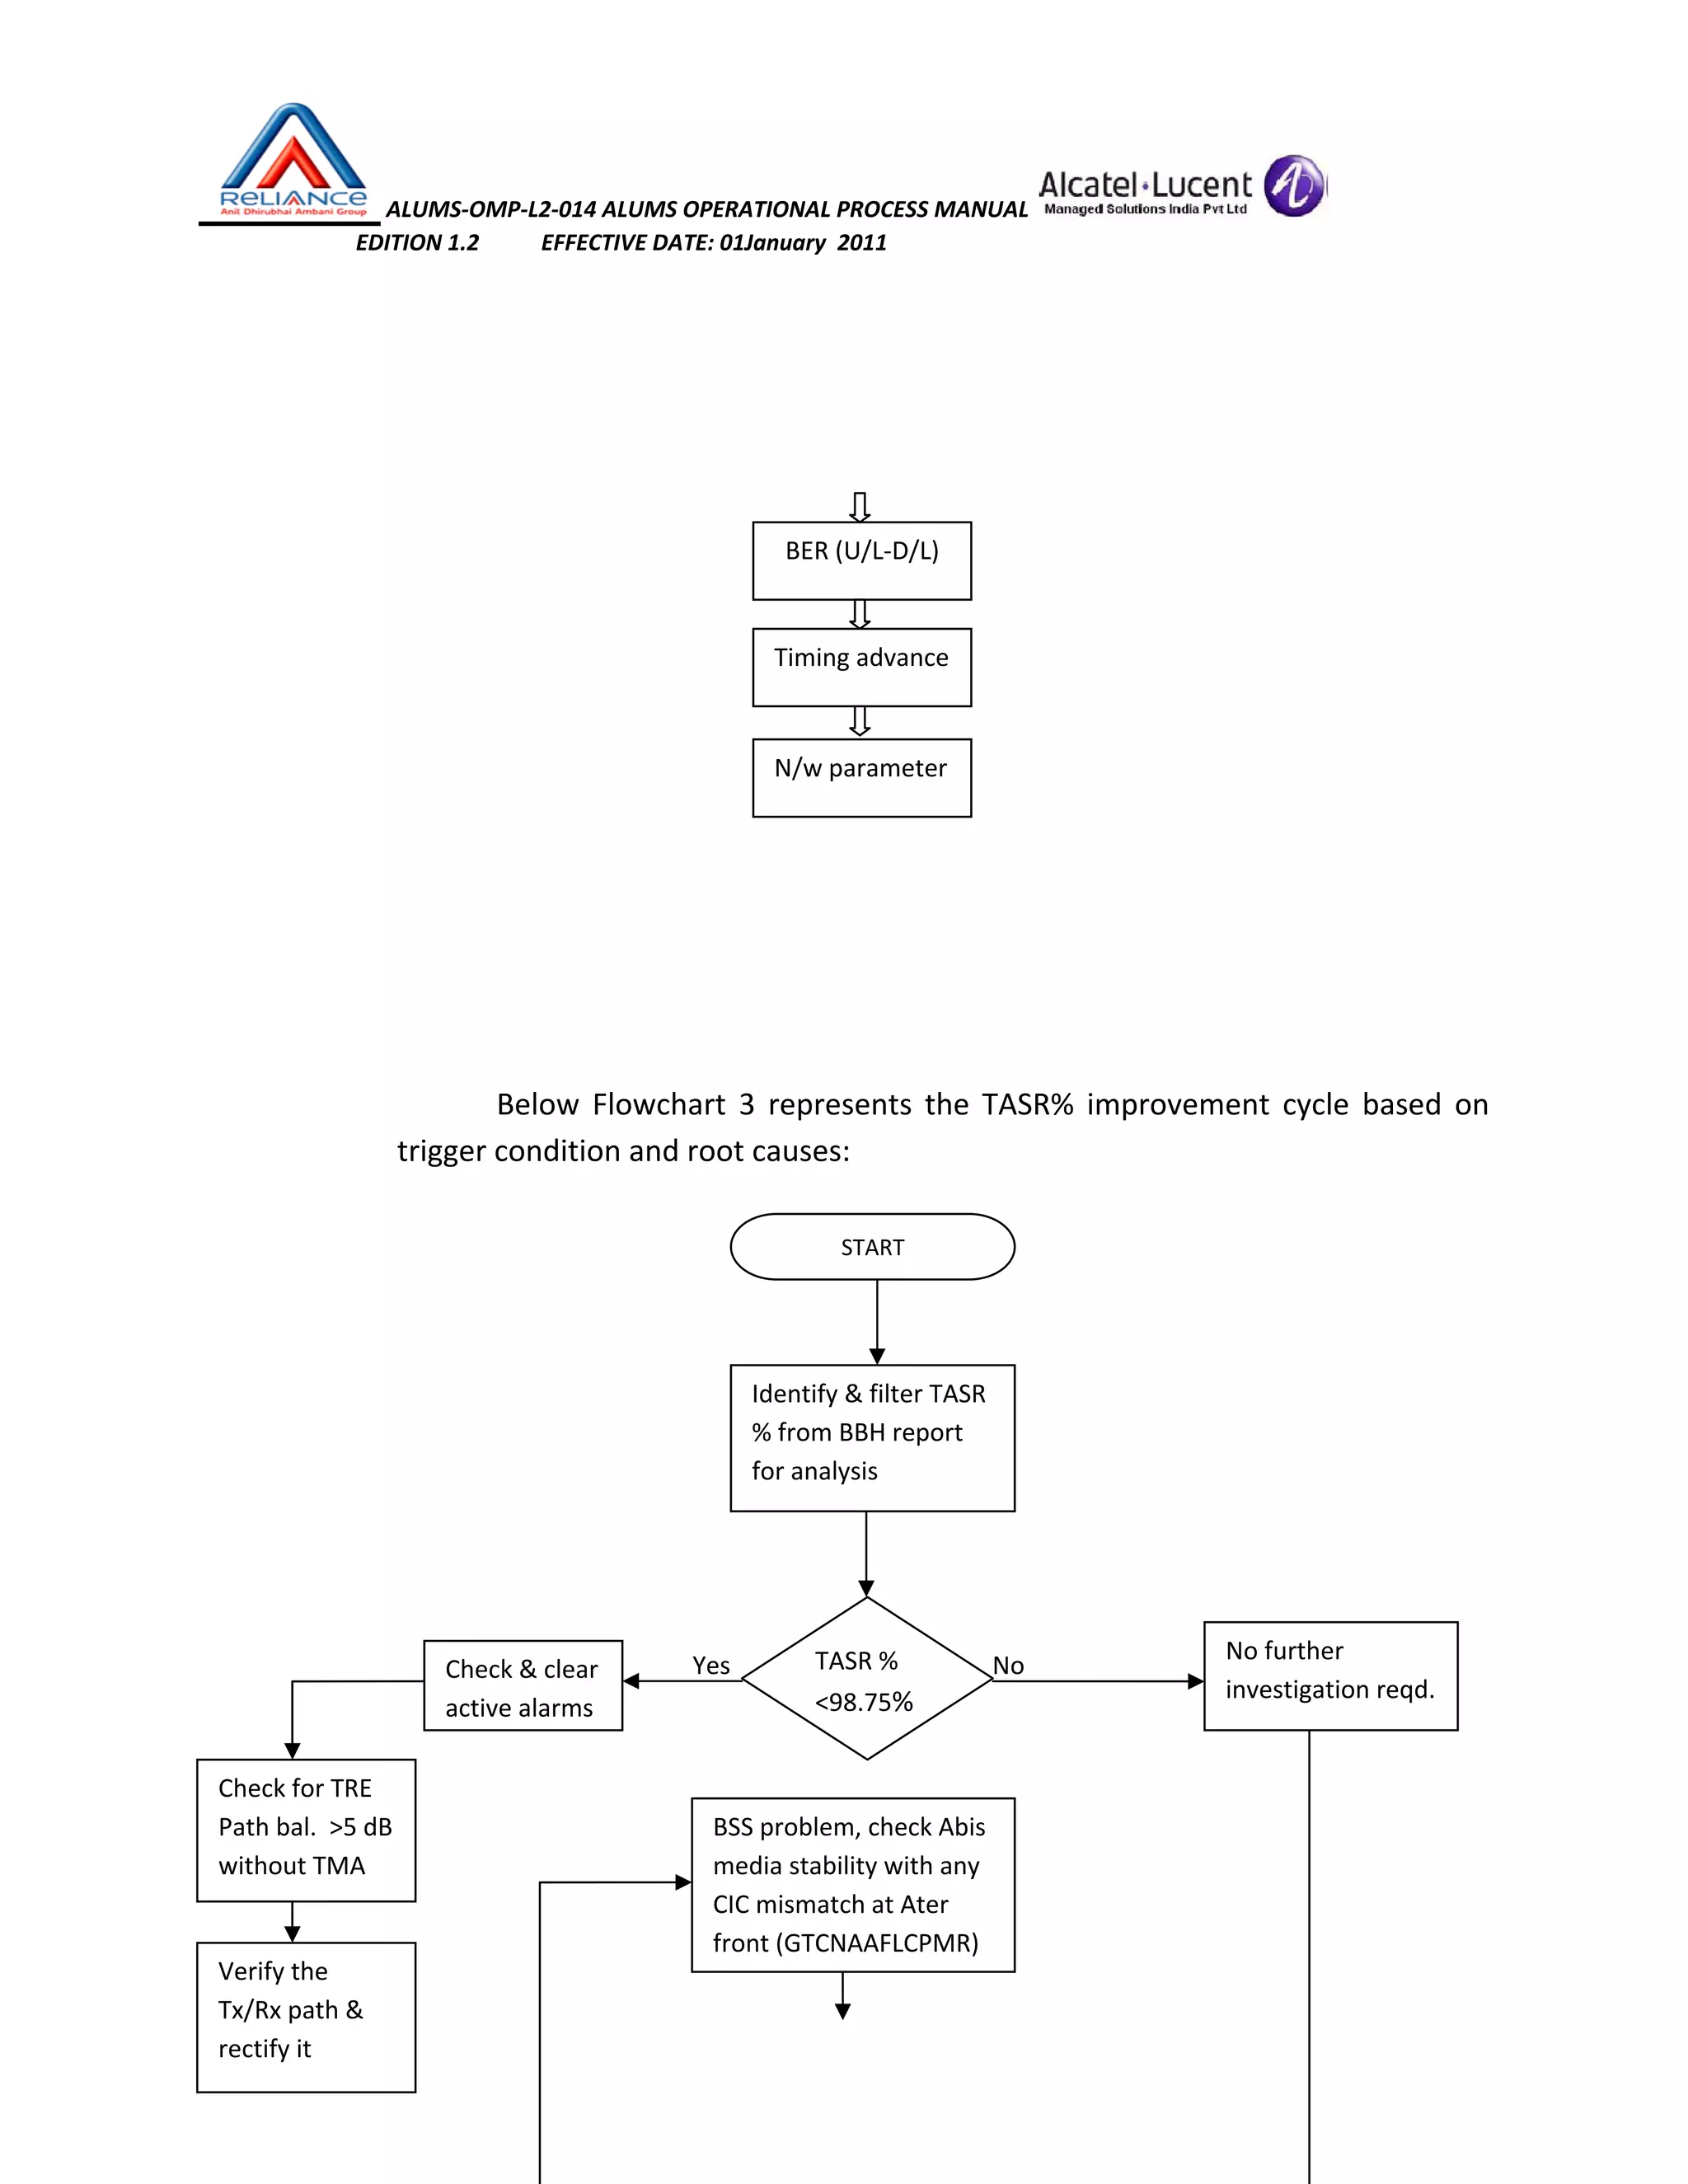
5.1.1 ALCATEL TASR DESCRIPTION
Alcatel BSS system (B10) evaluates the TASR based on certain measurable
counters from NPO with below relation:
TASR (%) = MC718 / [MC140a‐(MC142e+MC142f)*100.
Also, MC142e=C142a+C142c & MC142f=C142b+C142d.
Counters increment or decrement based on various factors governing the
network operator settings and real time operational status. It is important to be
aware of TASR % value on cell basis to visualize the impact & validity of these
counters.
5.1.2 ZTE TASR DESCRIPTION
ZTE BSS system (ZXG10‐V2.97) evaluates the TASR based on certain
measurable counters from OMCR with below relation:
TASR % = {(C11609‐C11696) ‐ (C11610+C11654+C11658‐C11697‐
C116101‐C116133)} * 100 / (C11609‐C11696)
Counter description & details can be found in Appendix section or on
click to respective counter in quicker way.
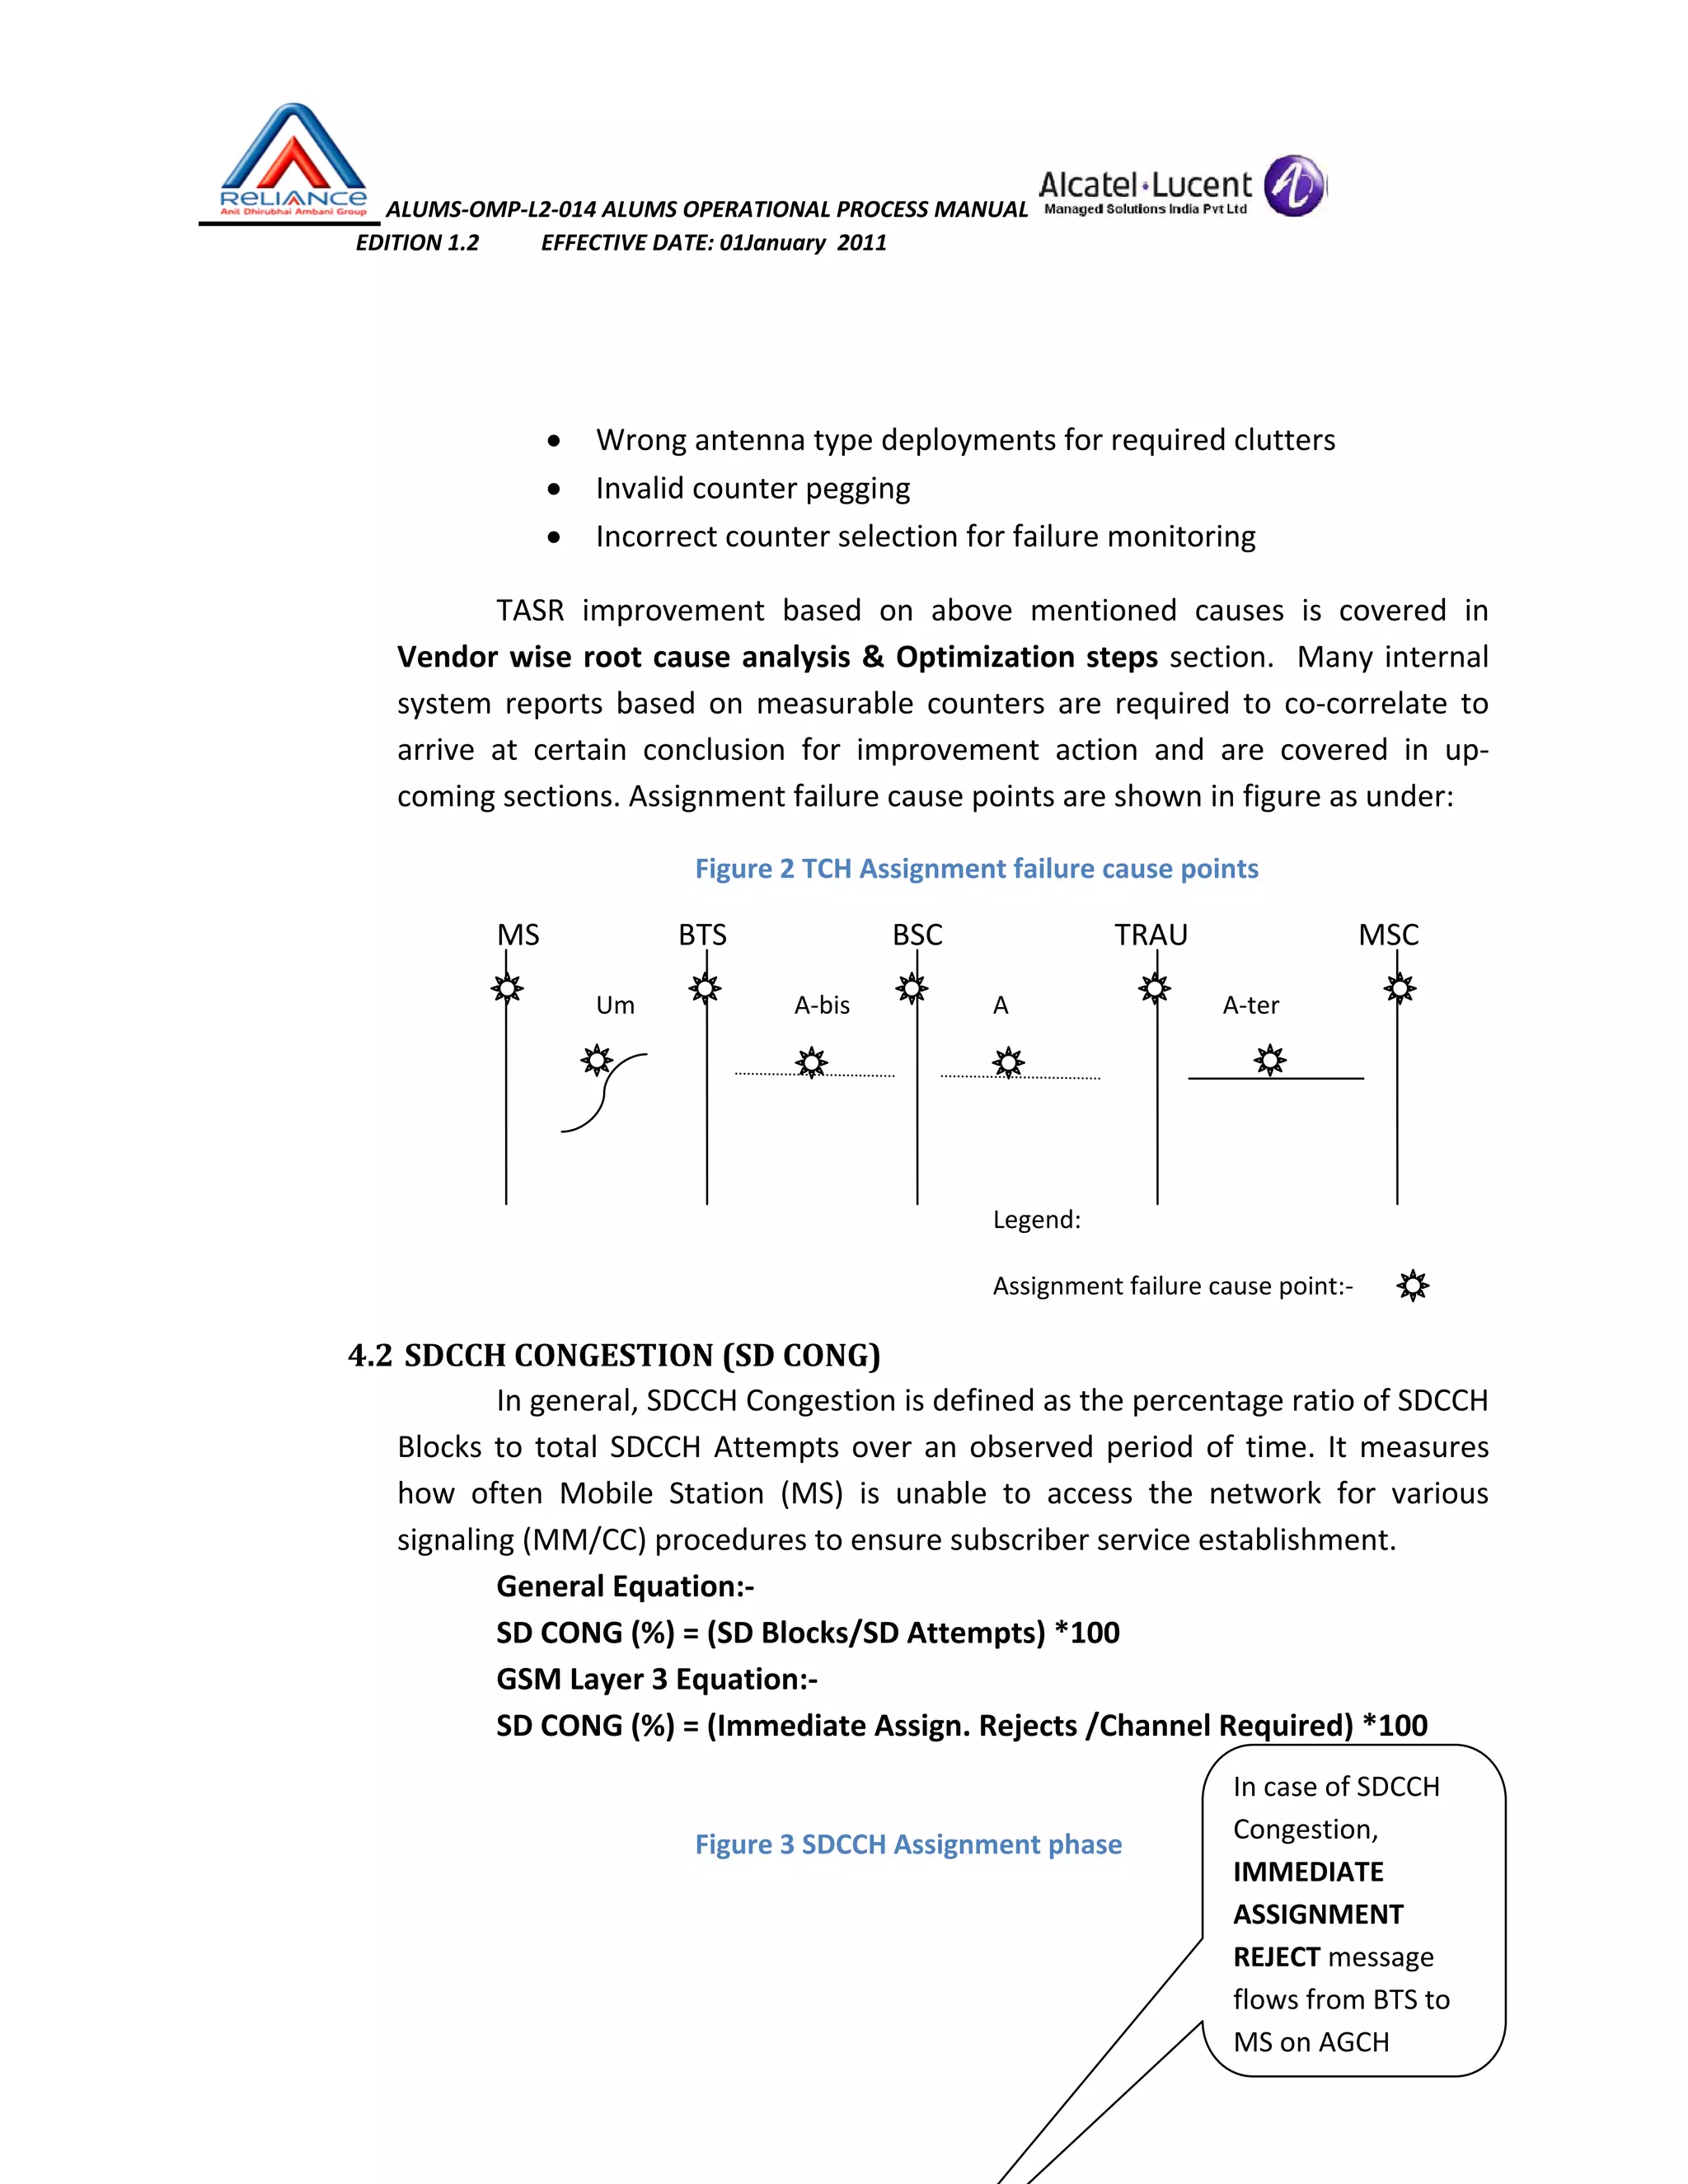
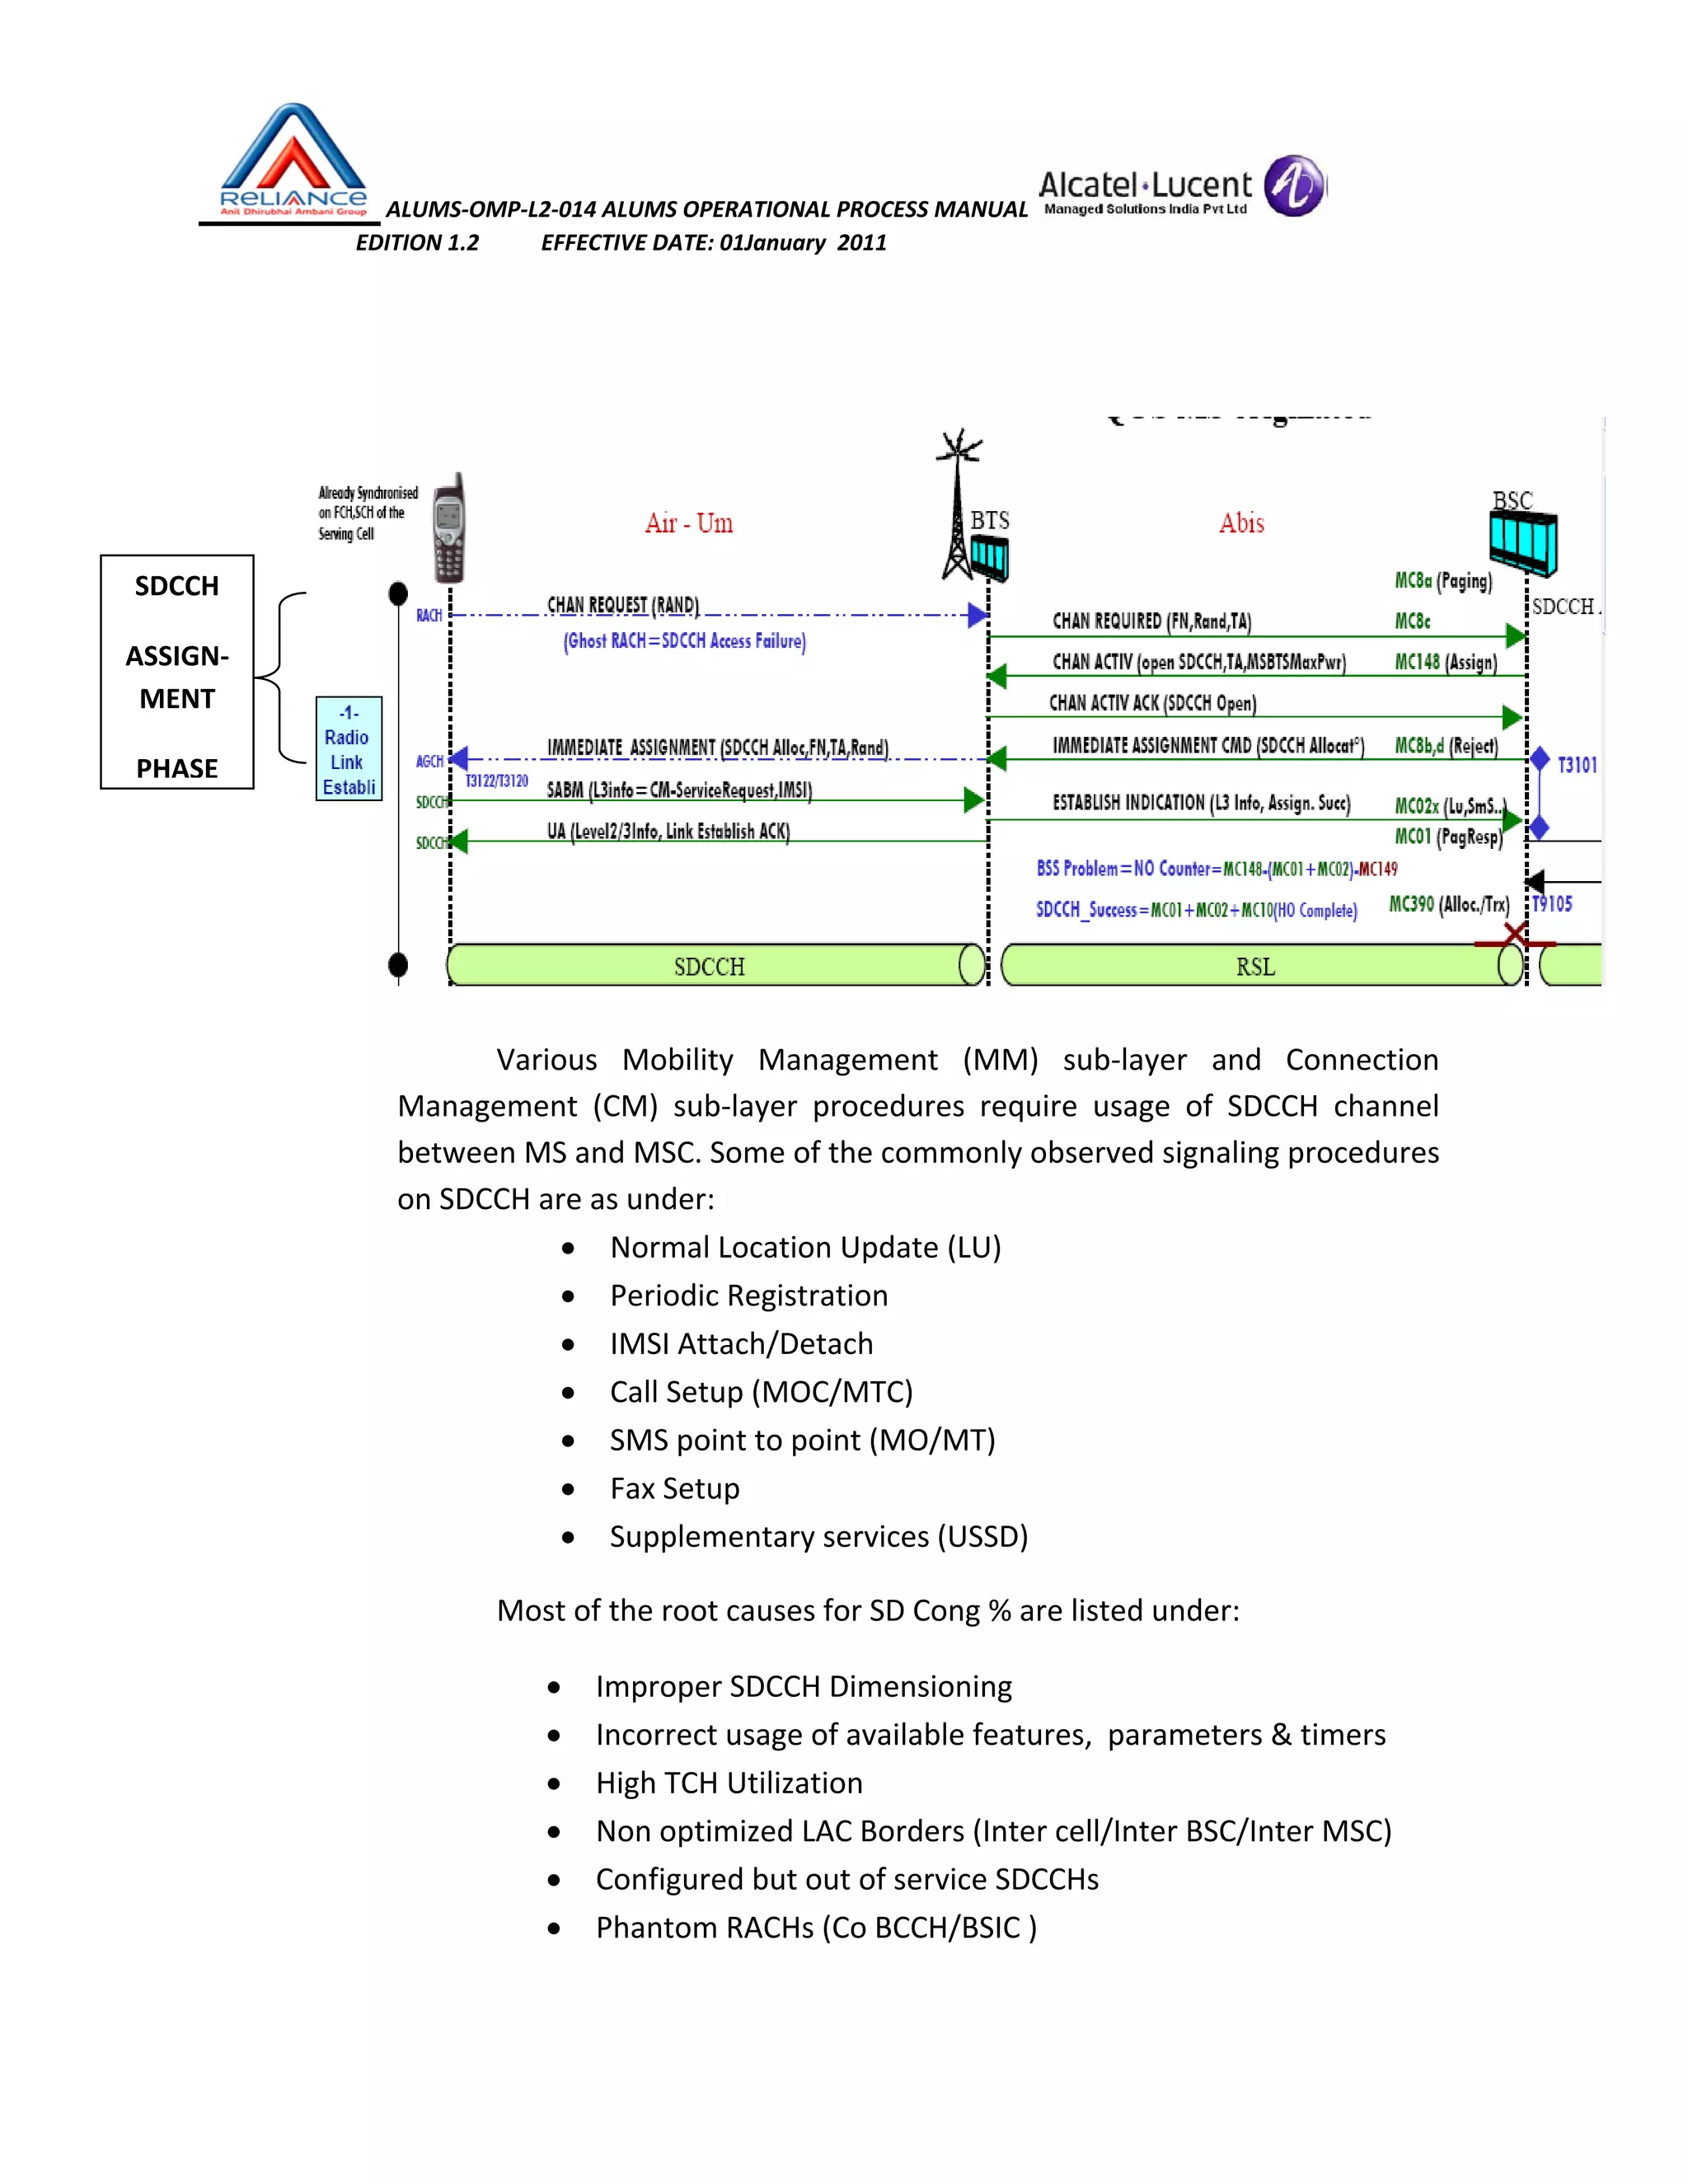
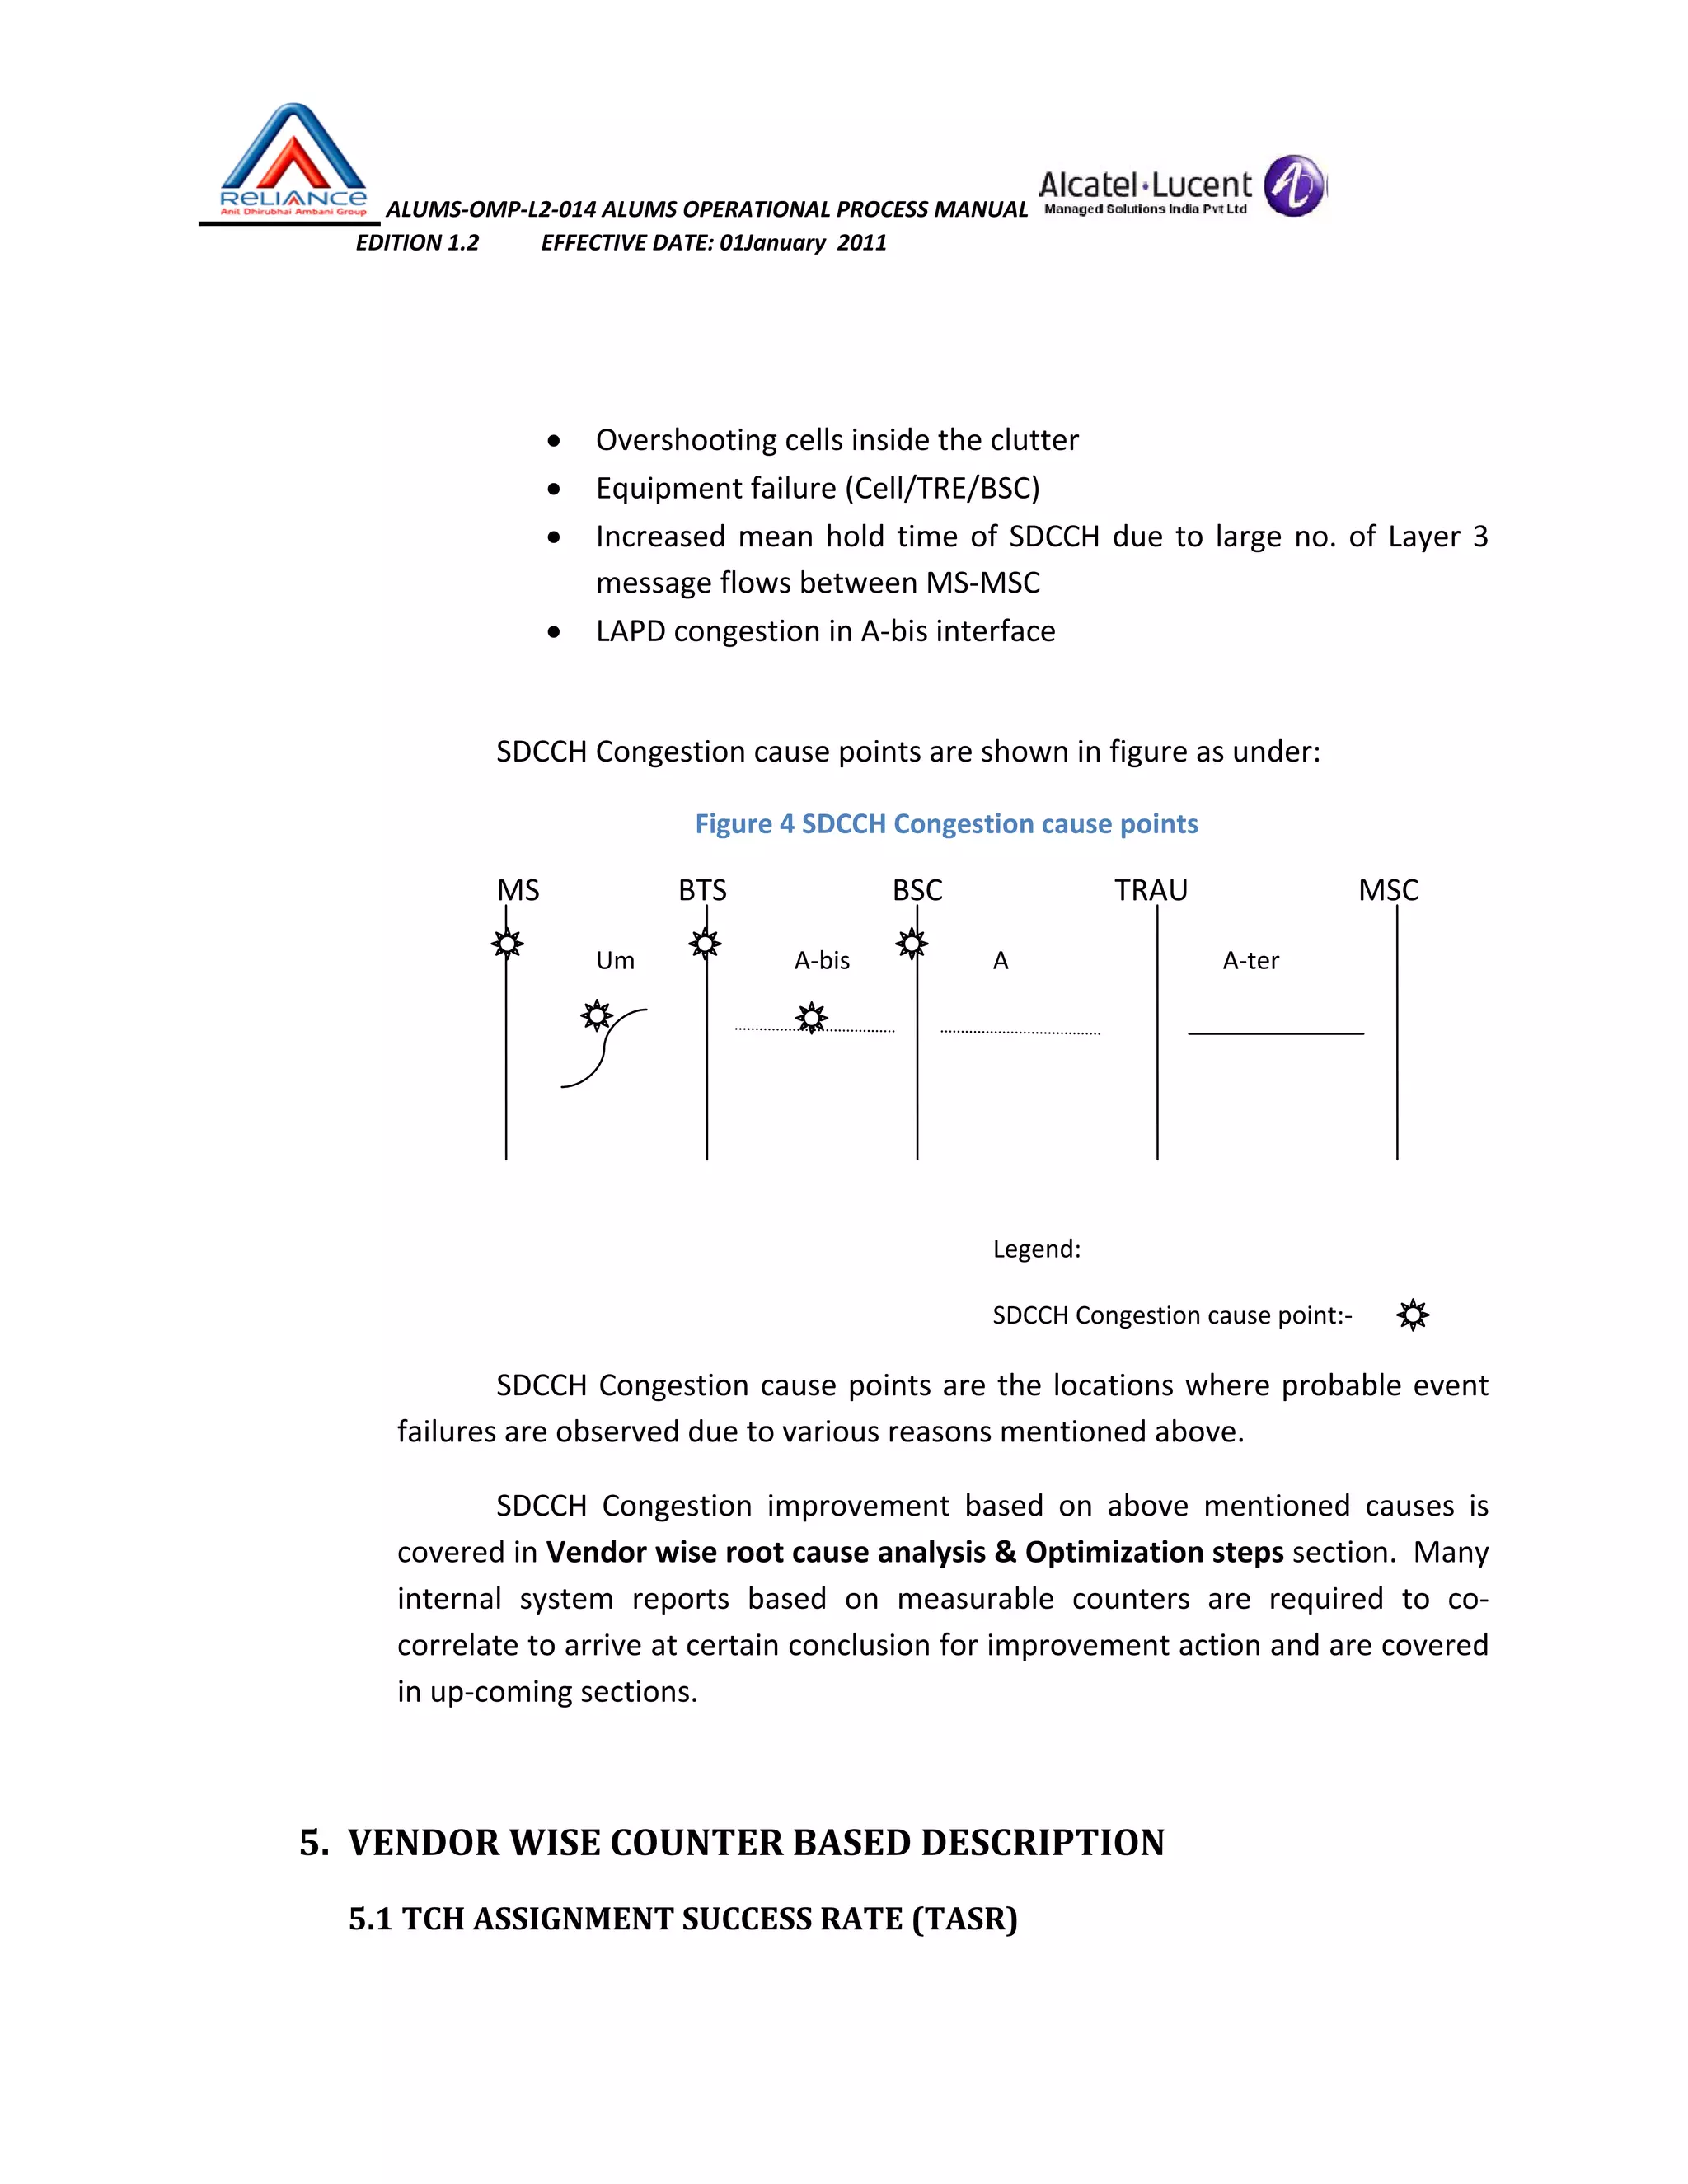
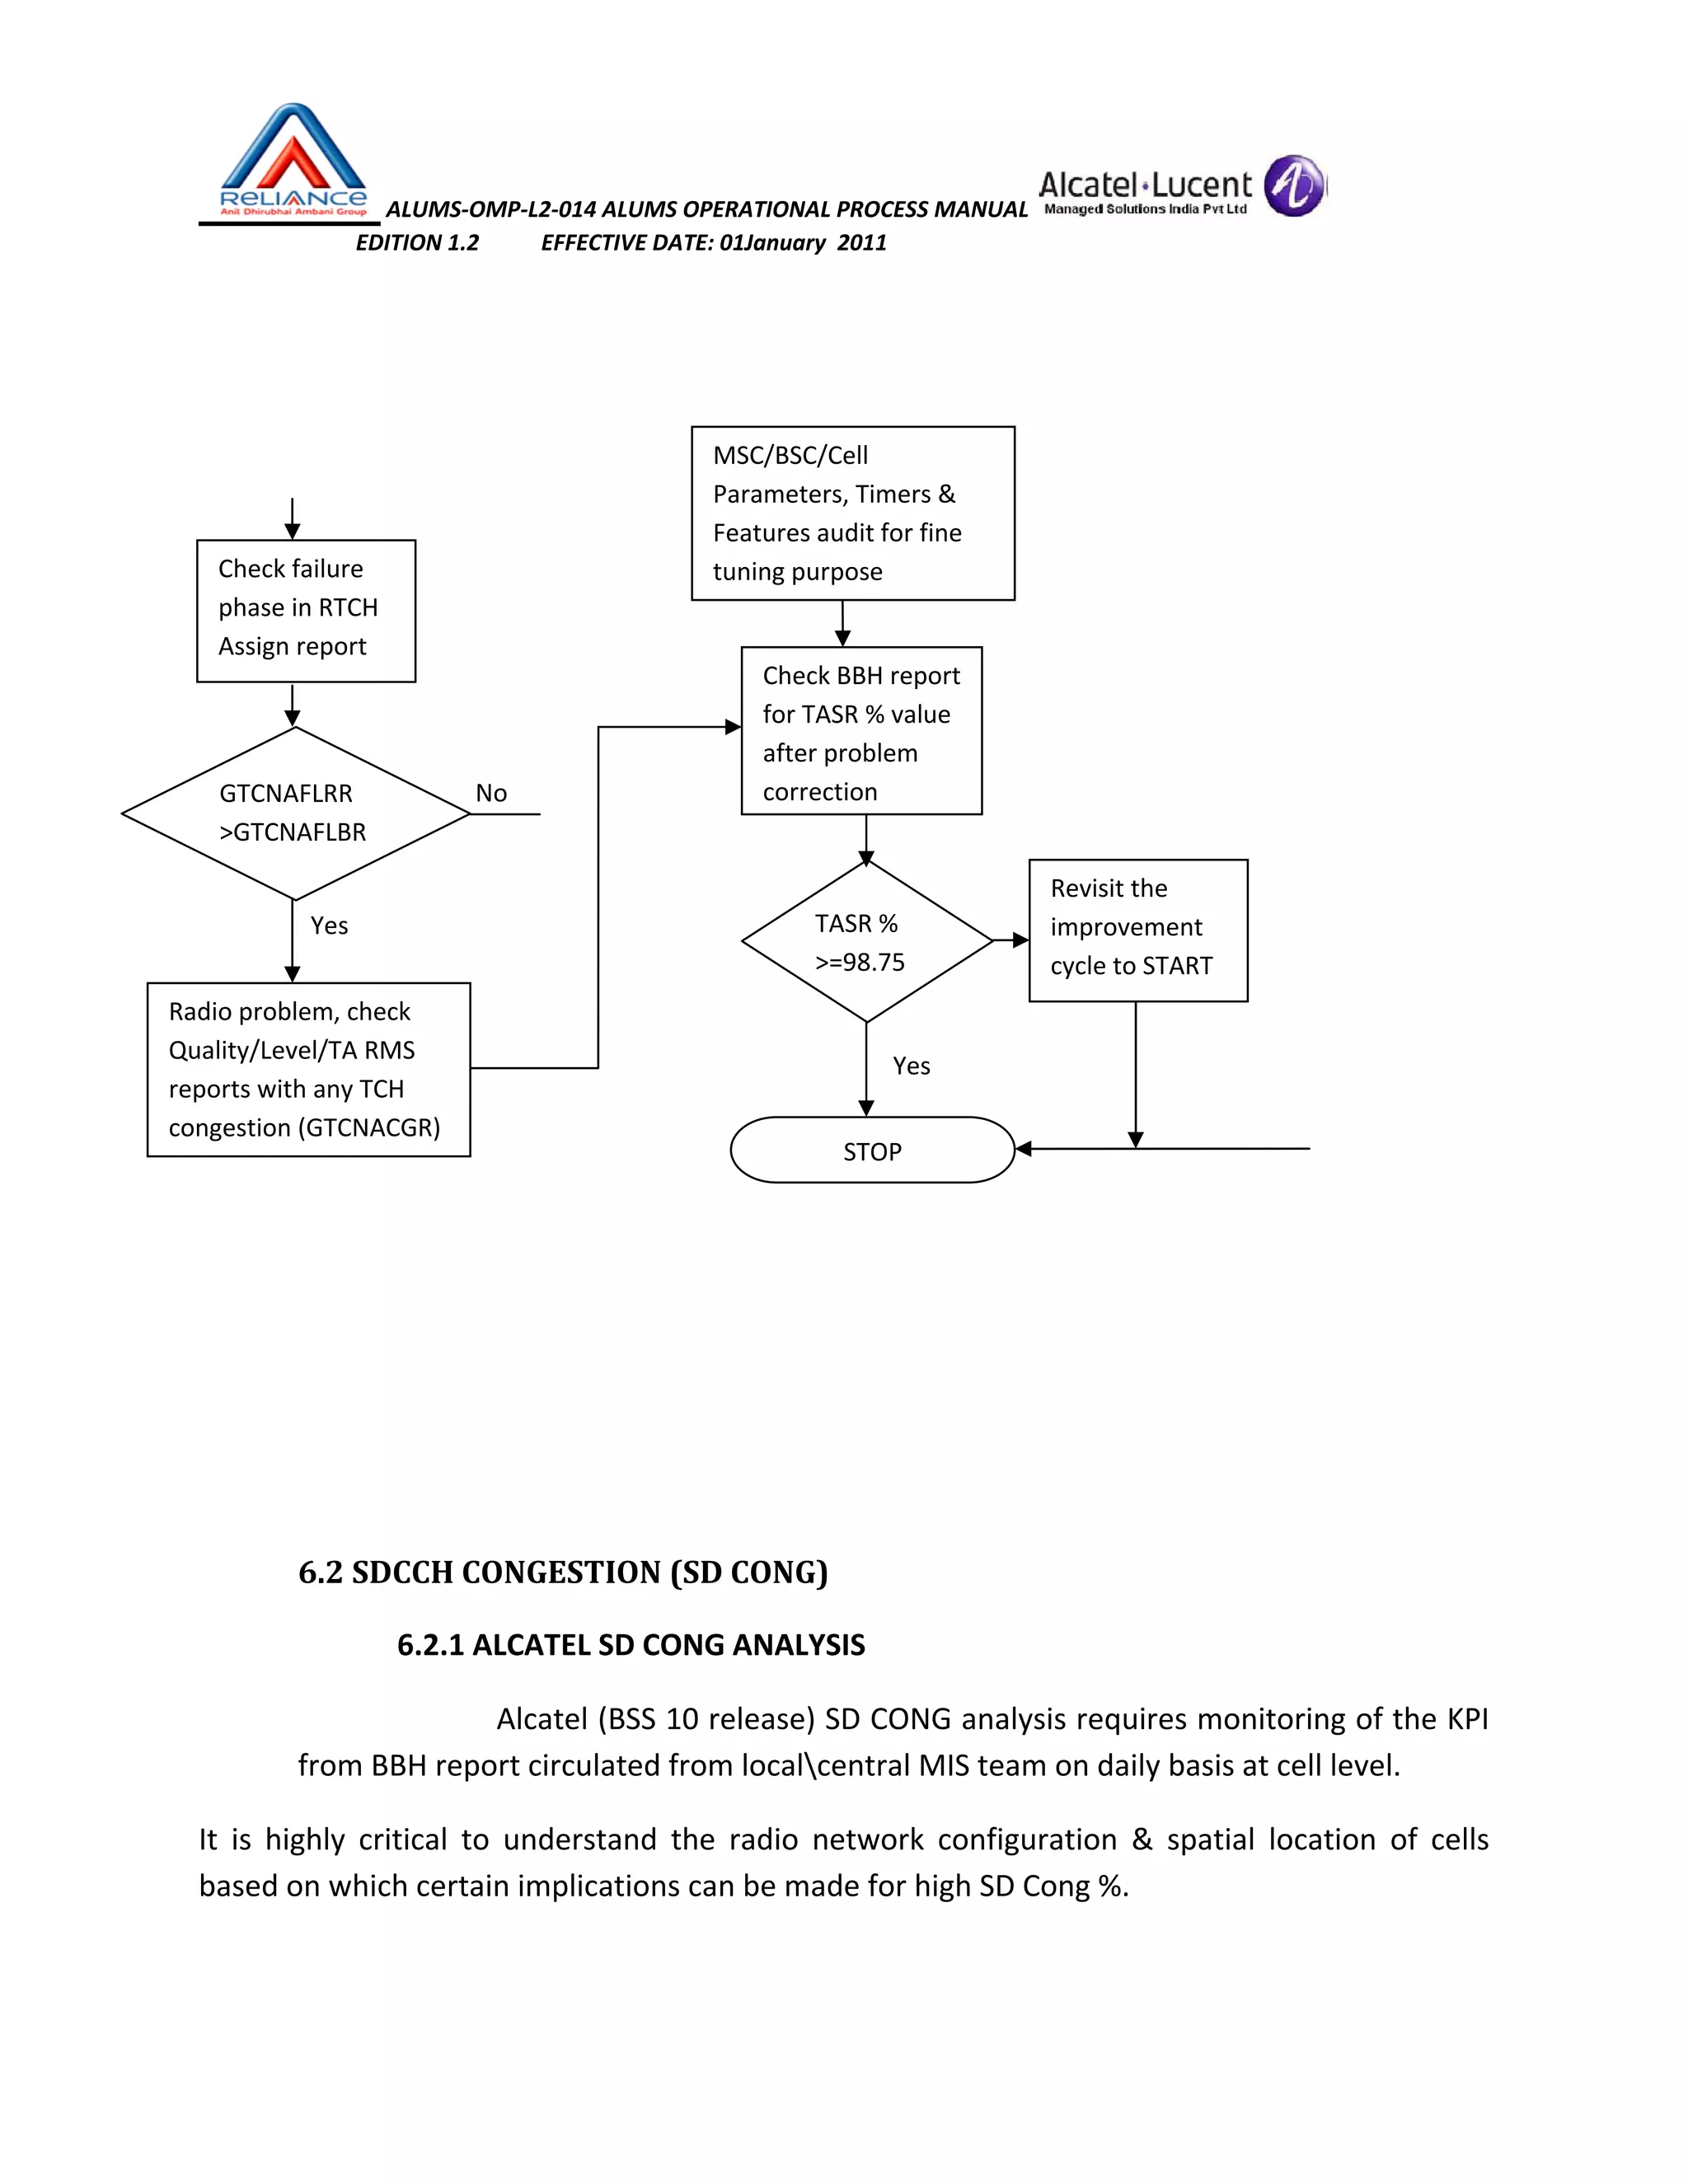
5.2 SDCCH CONGESTION (SD CONG)
5.2.1 ALCATEL SD CONG DESCRIPTION
Alcatel BSS system (B10) evaluates the SD CONG based on certain
measurable counters from NPO with below relation:
SD CONG (%) = [MC04] / [MC04 + MC148]*100
Counter description & details can be found in Appendix section or on
click to respective counter in quicker way.](https://image.slidesharecdn.com/54586381-gsm-kpi-optimization-appendix3-150621114419-lva1-app6891/75/gsm-kpi-optimization-36-2048.jpg)
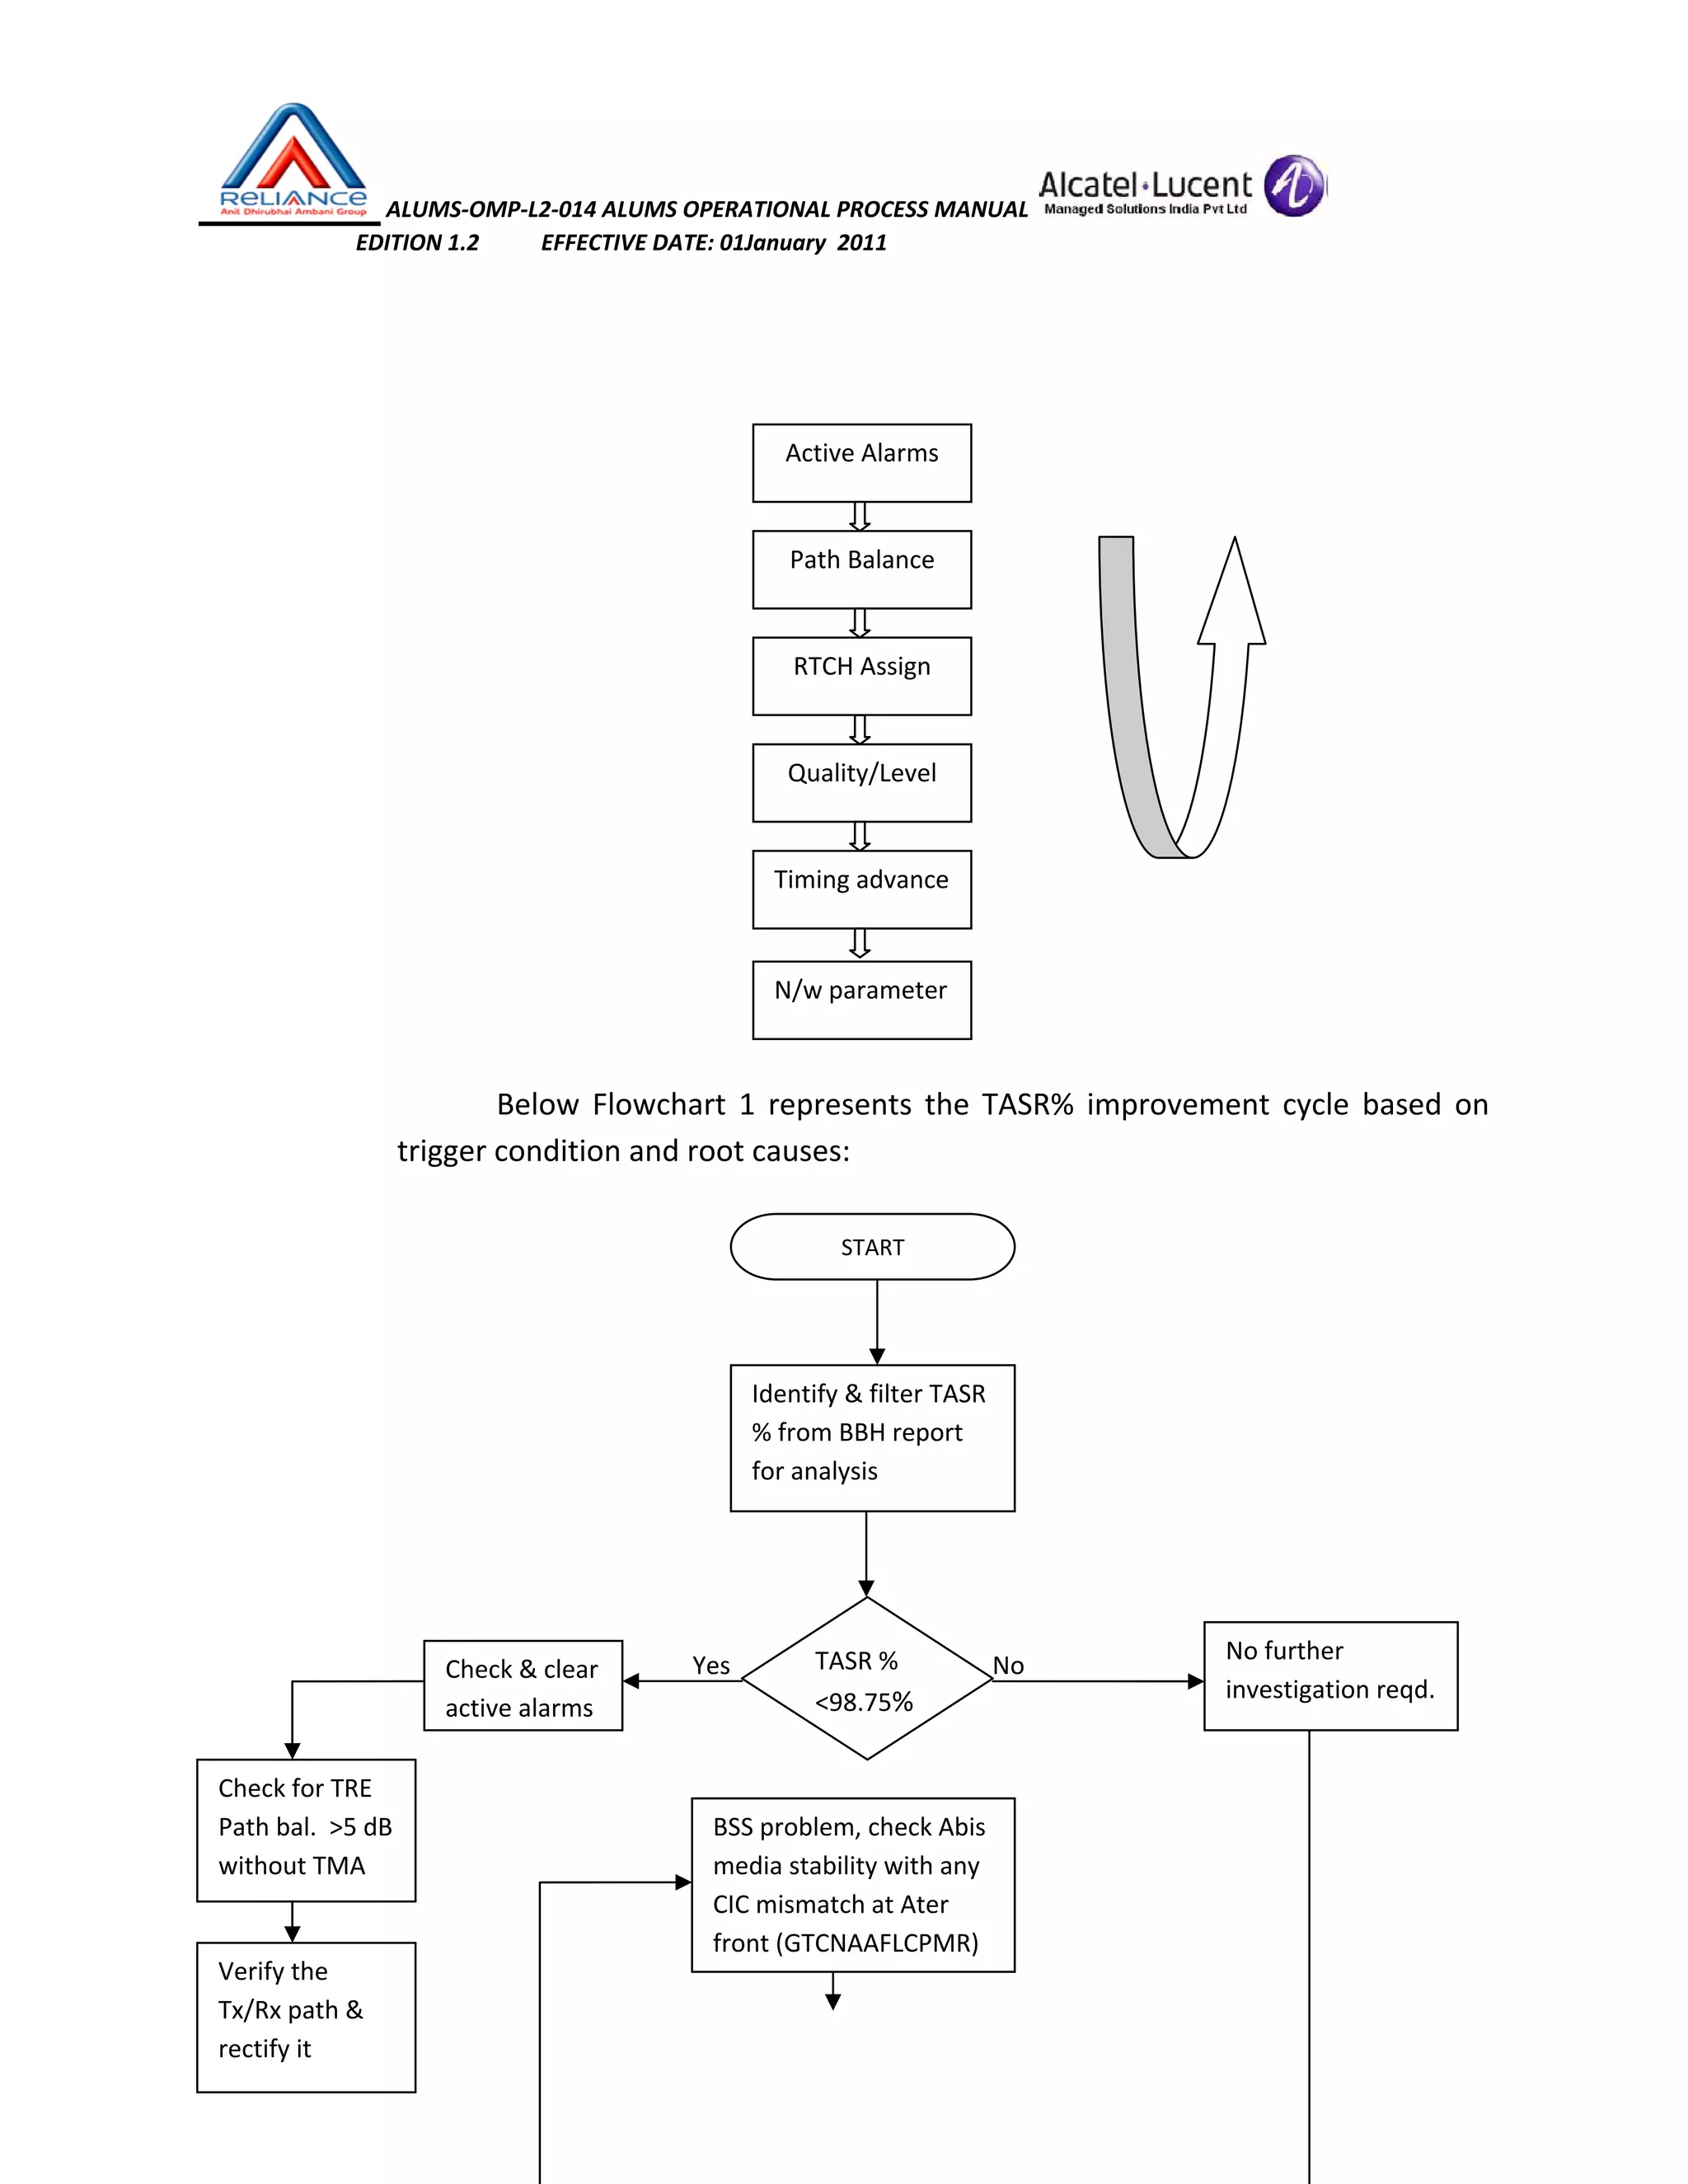
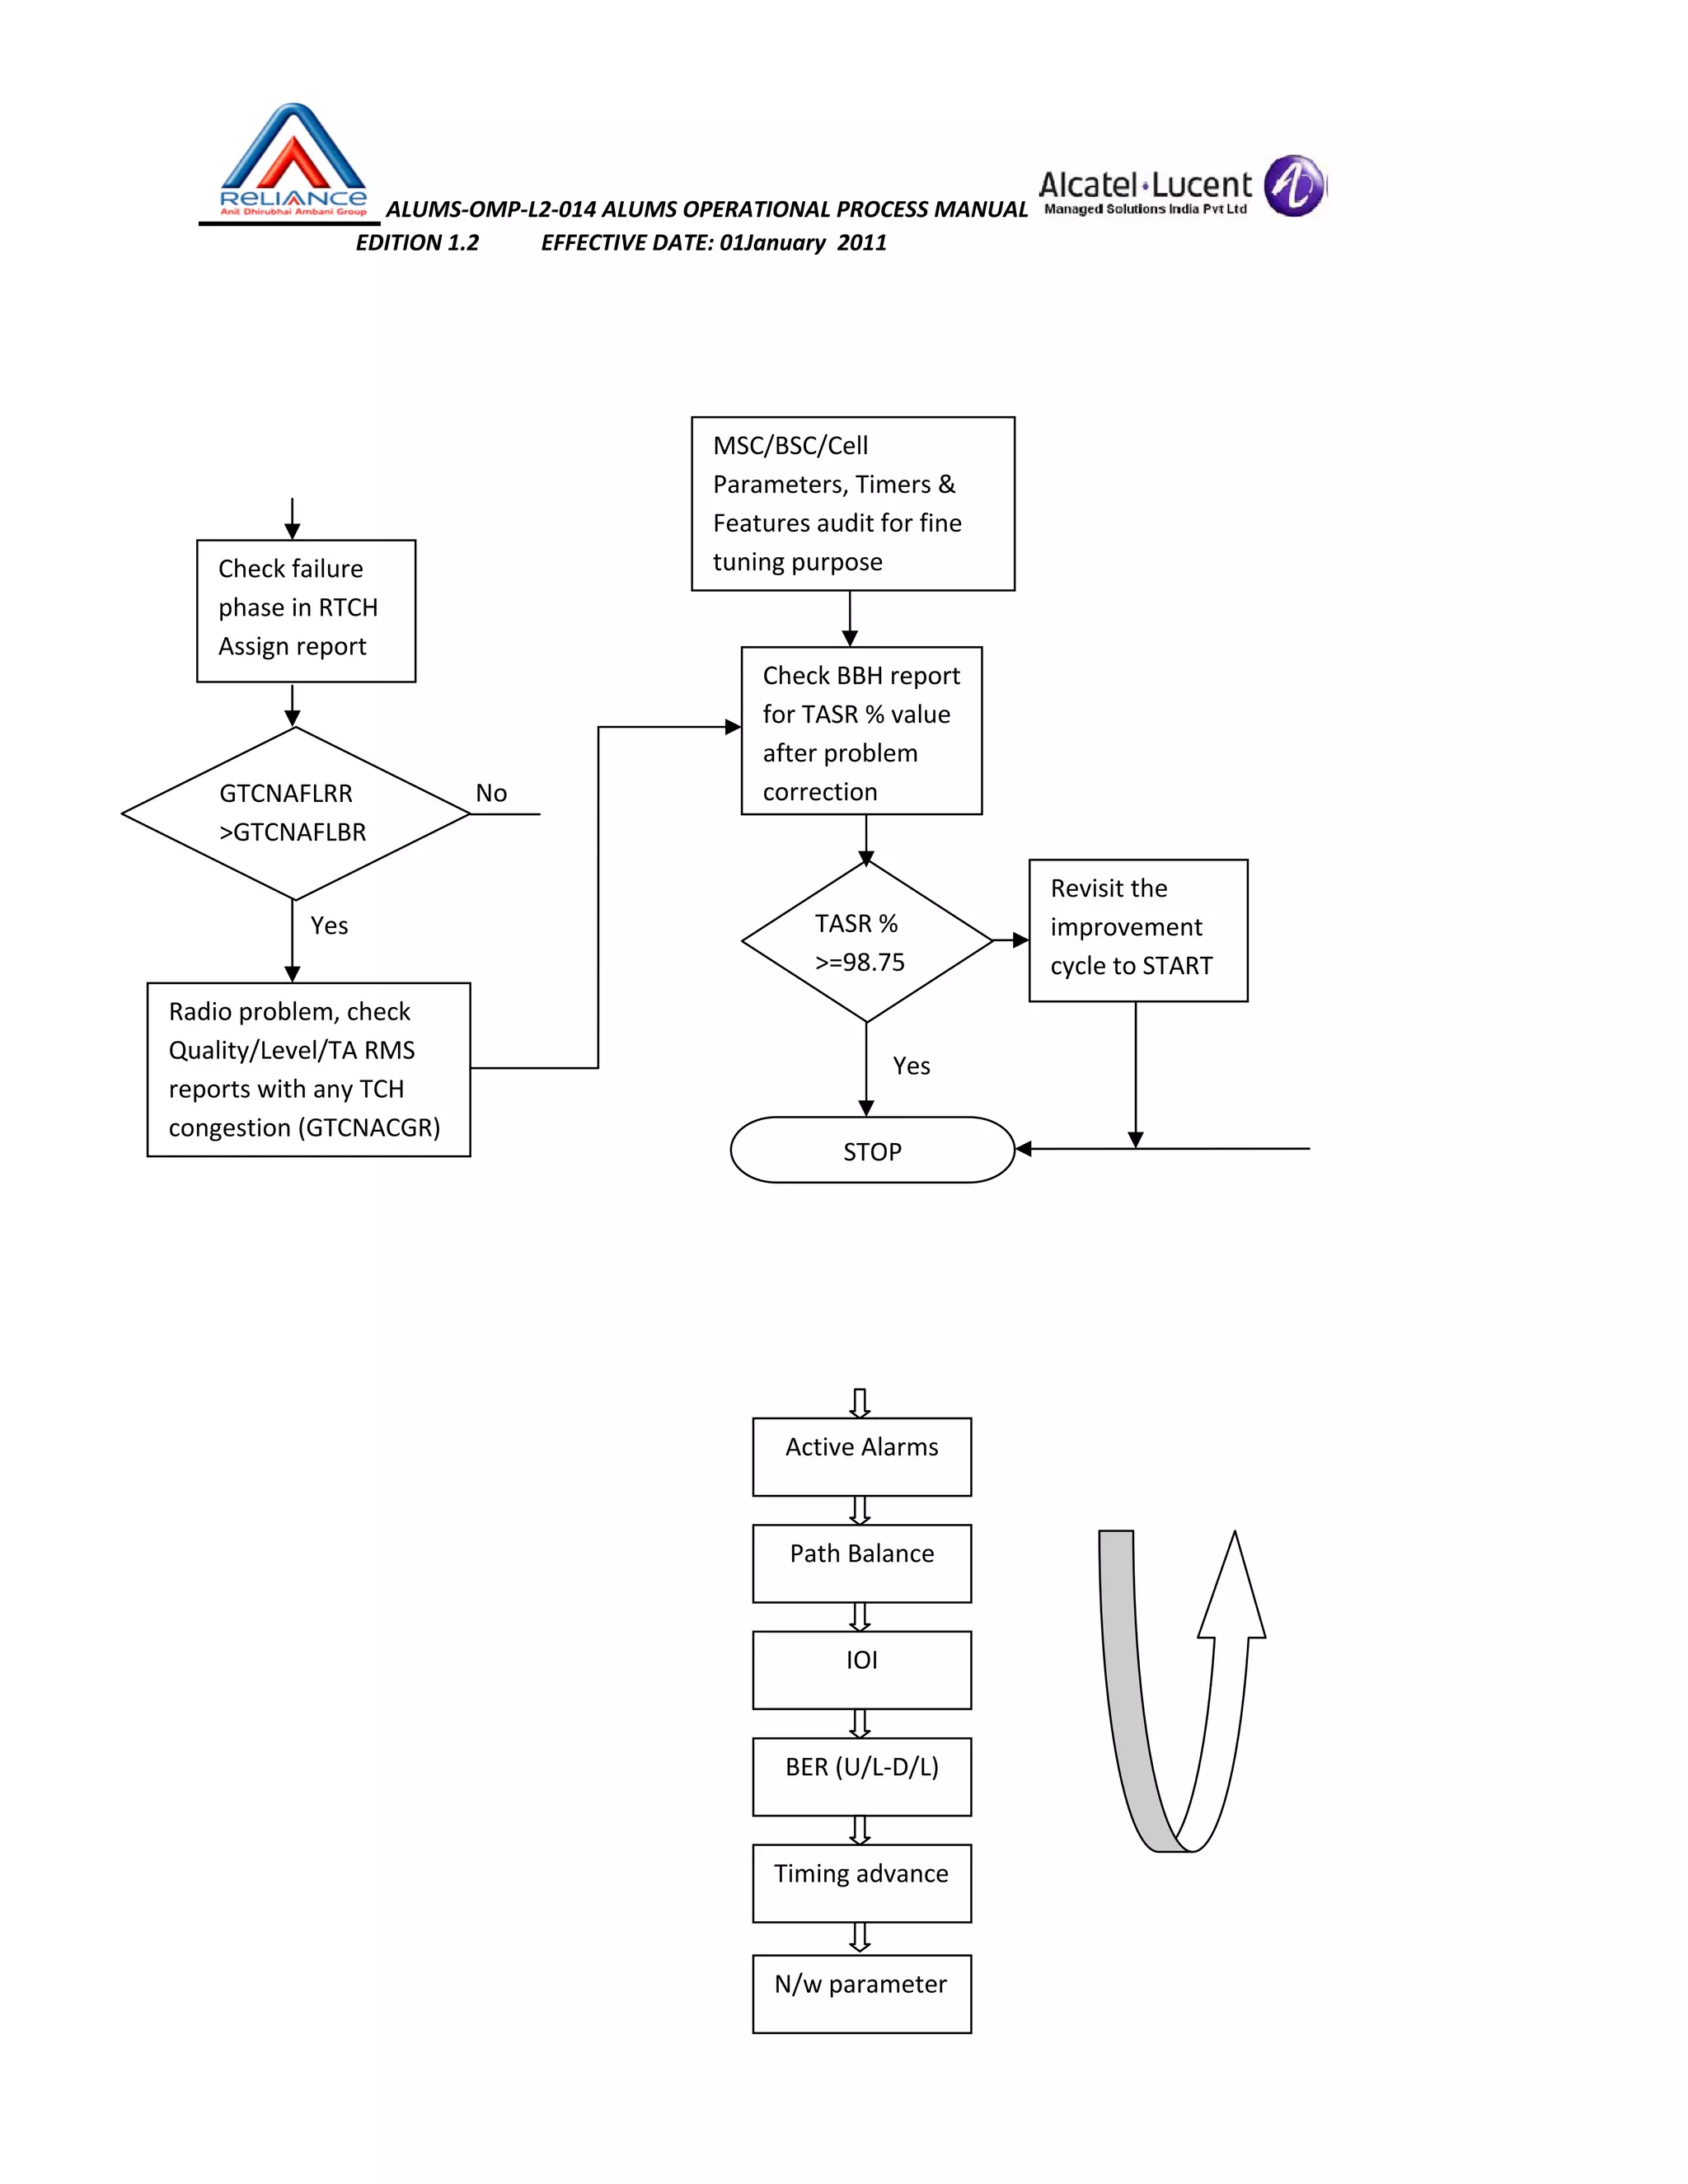
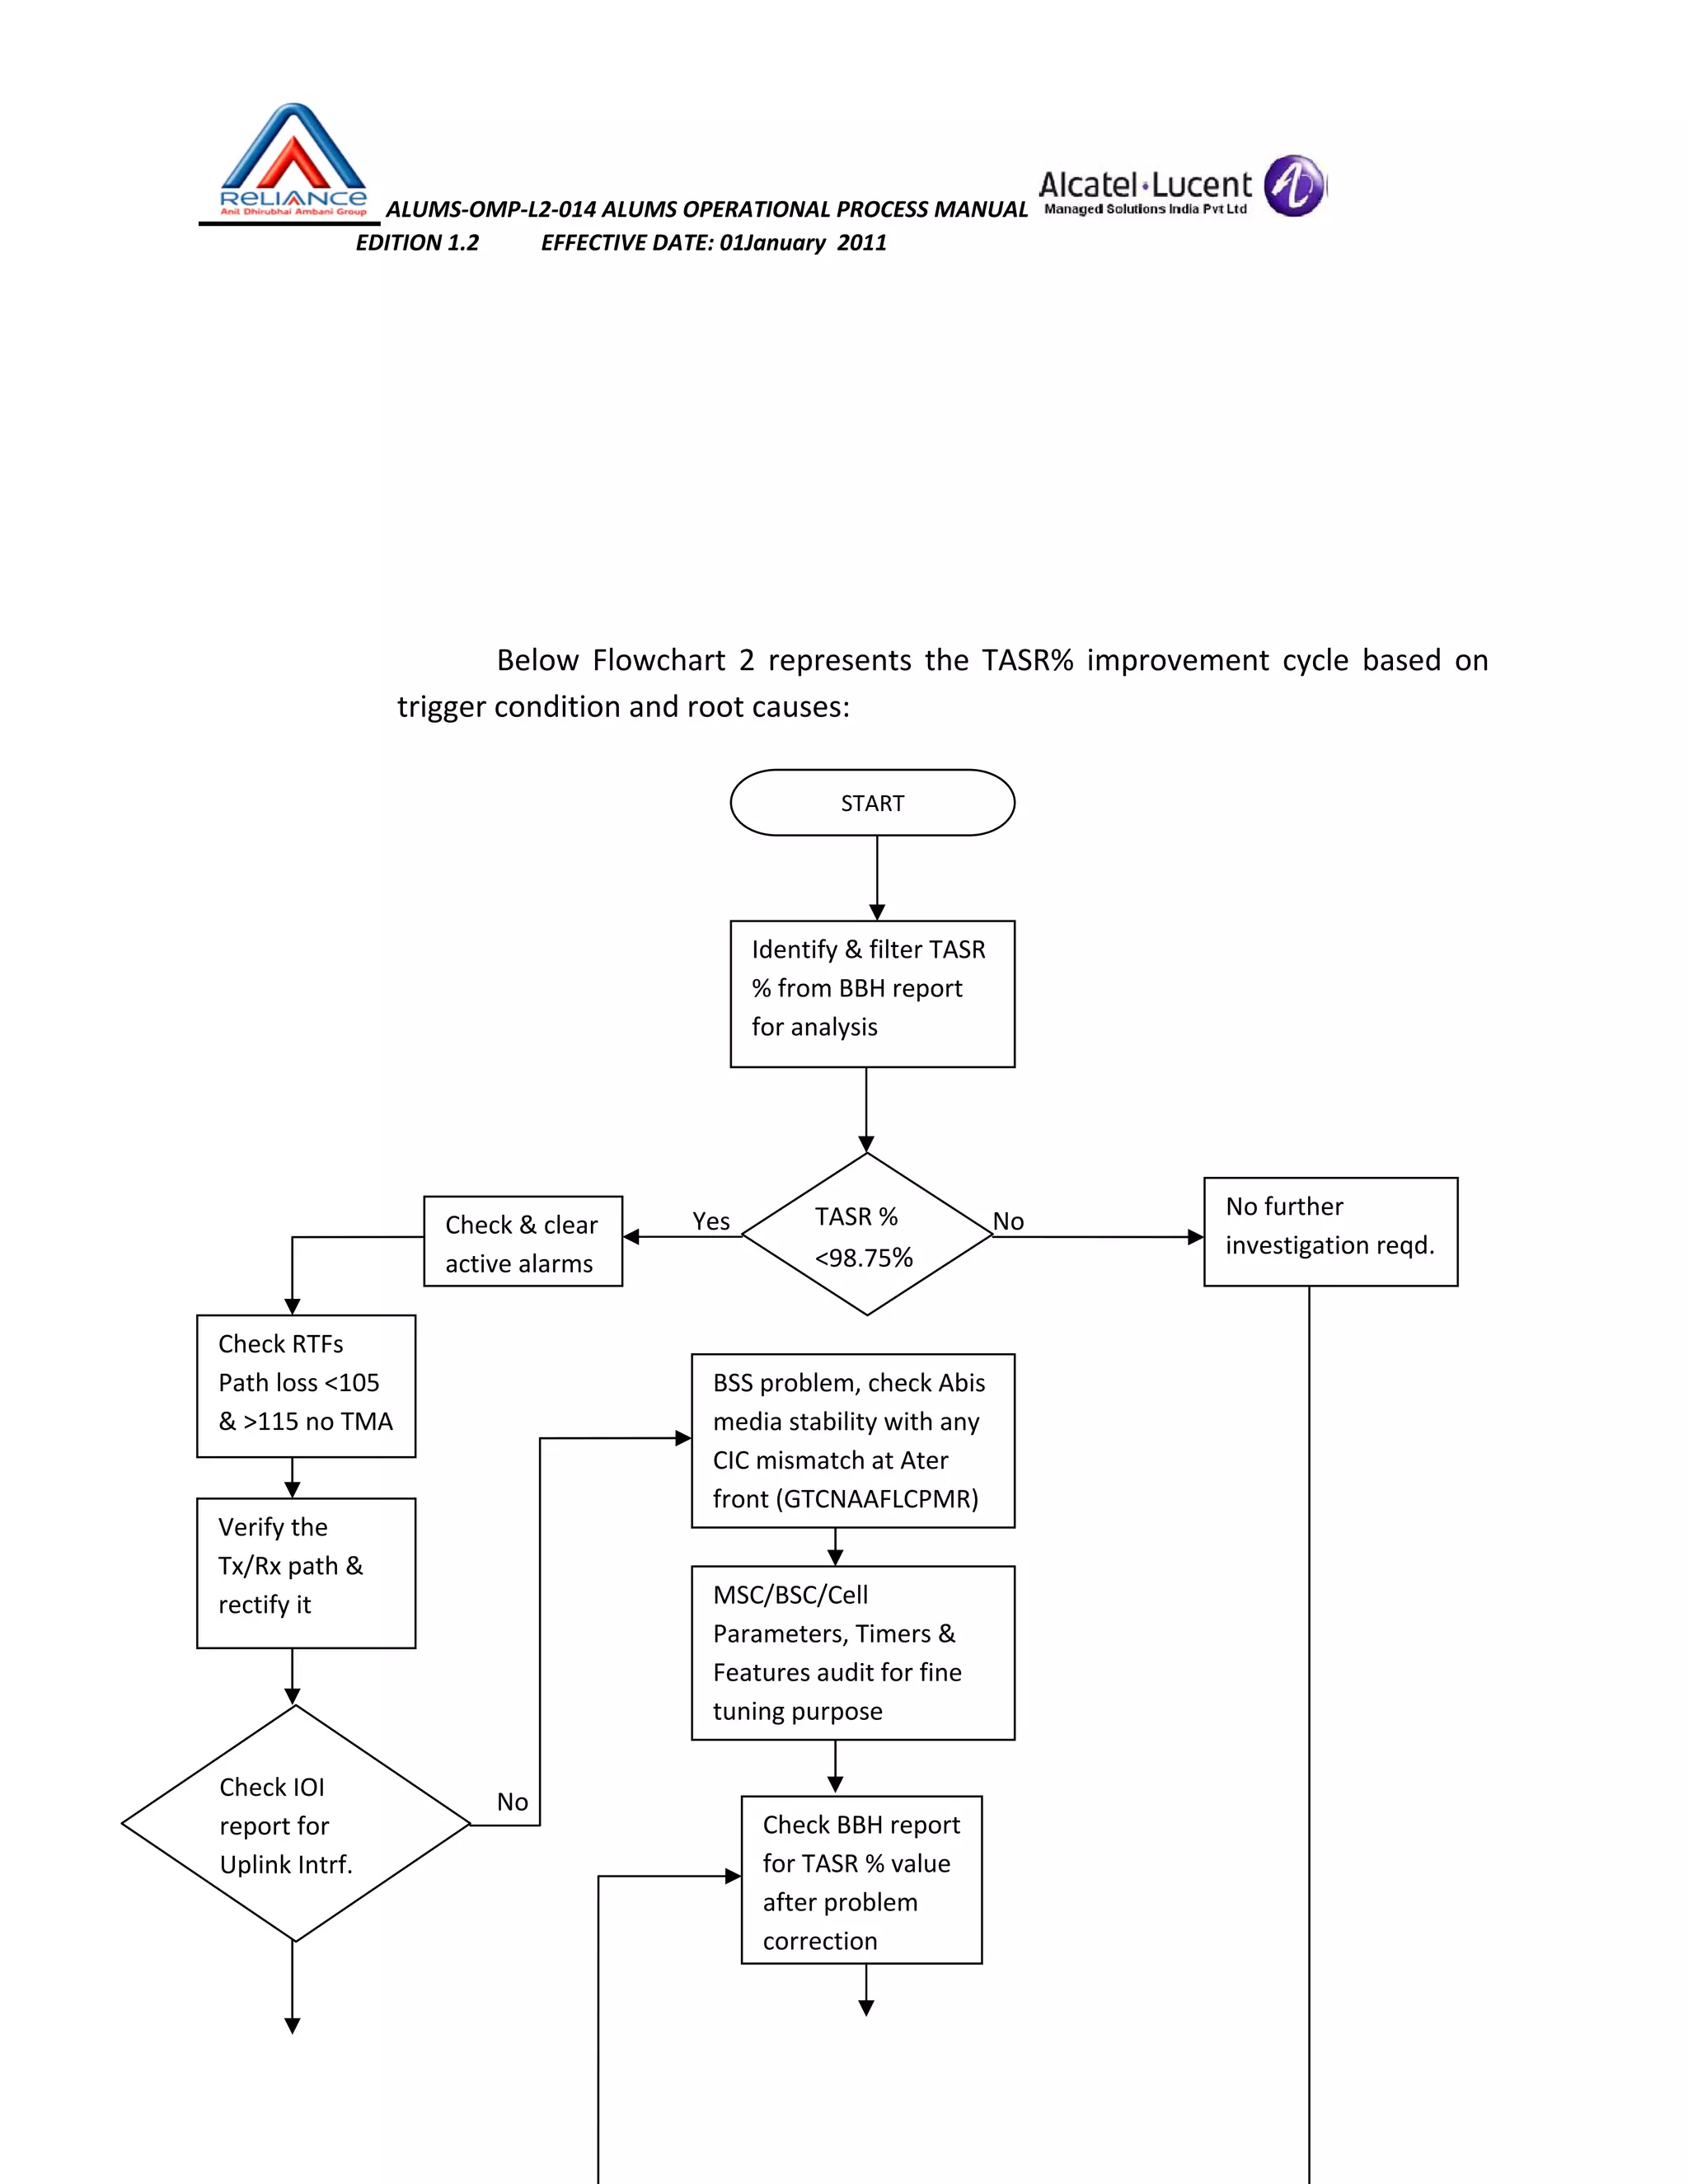
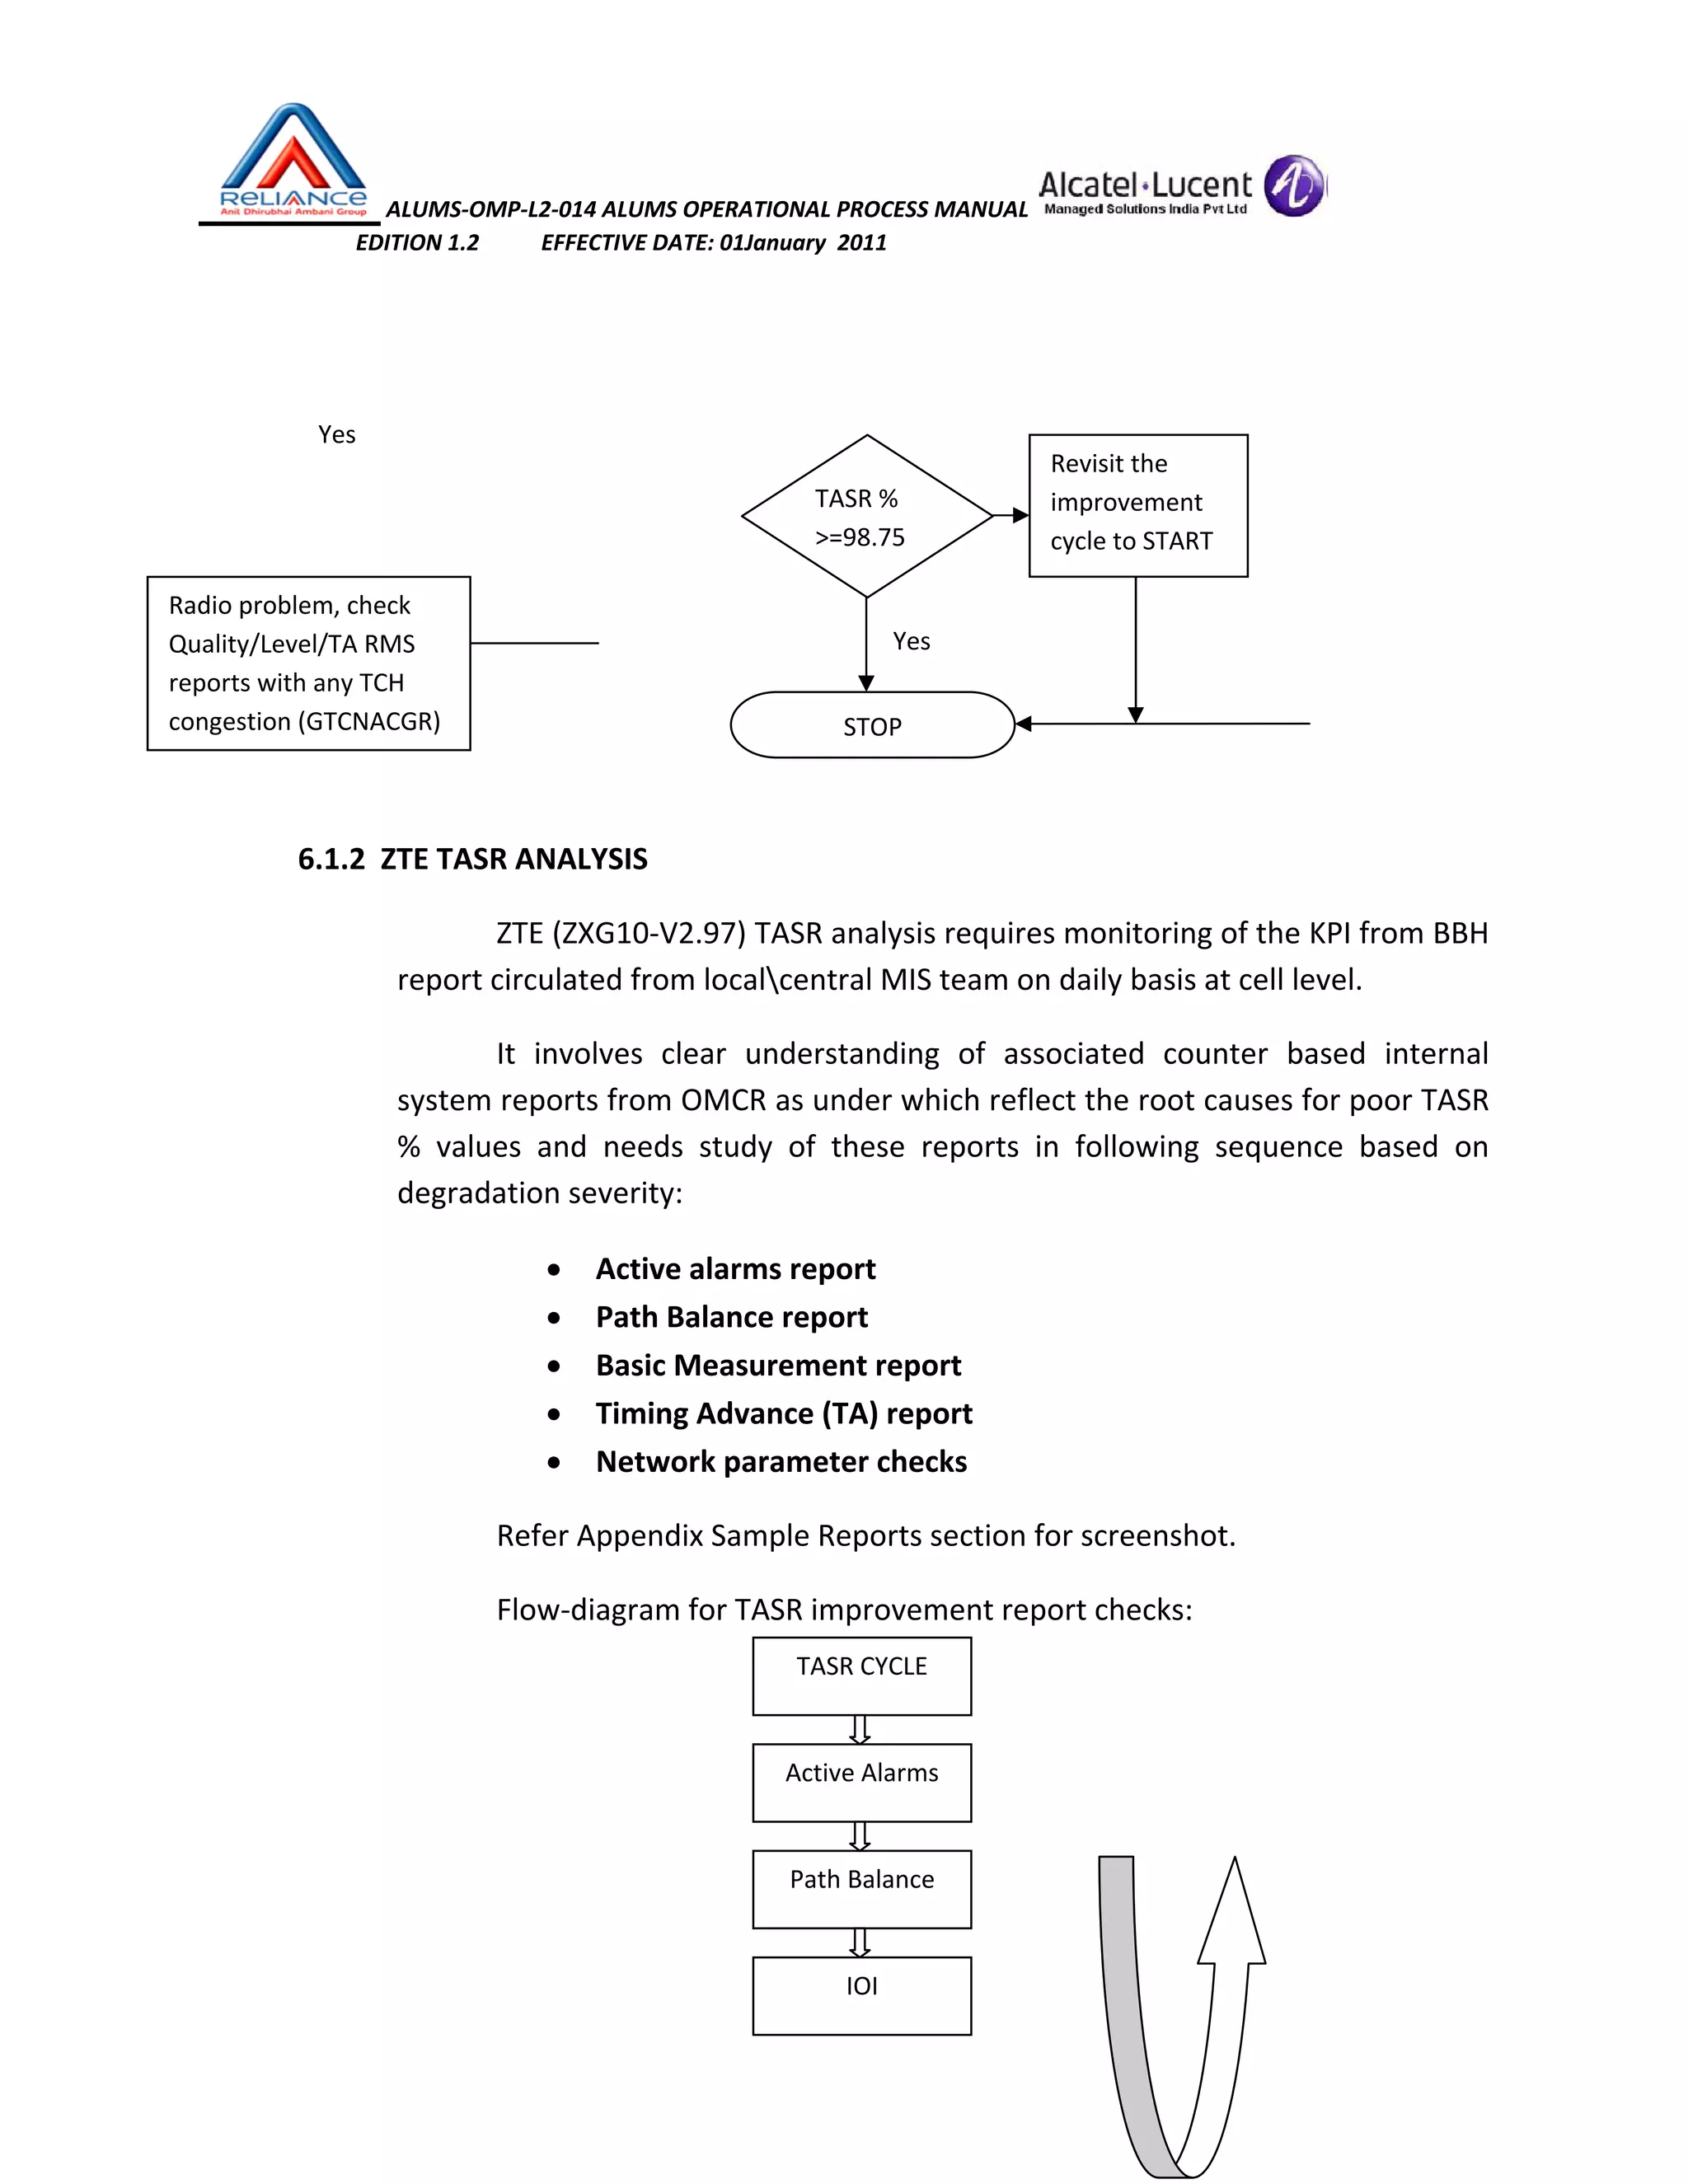

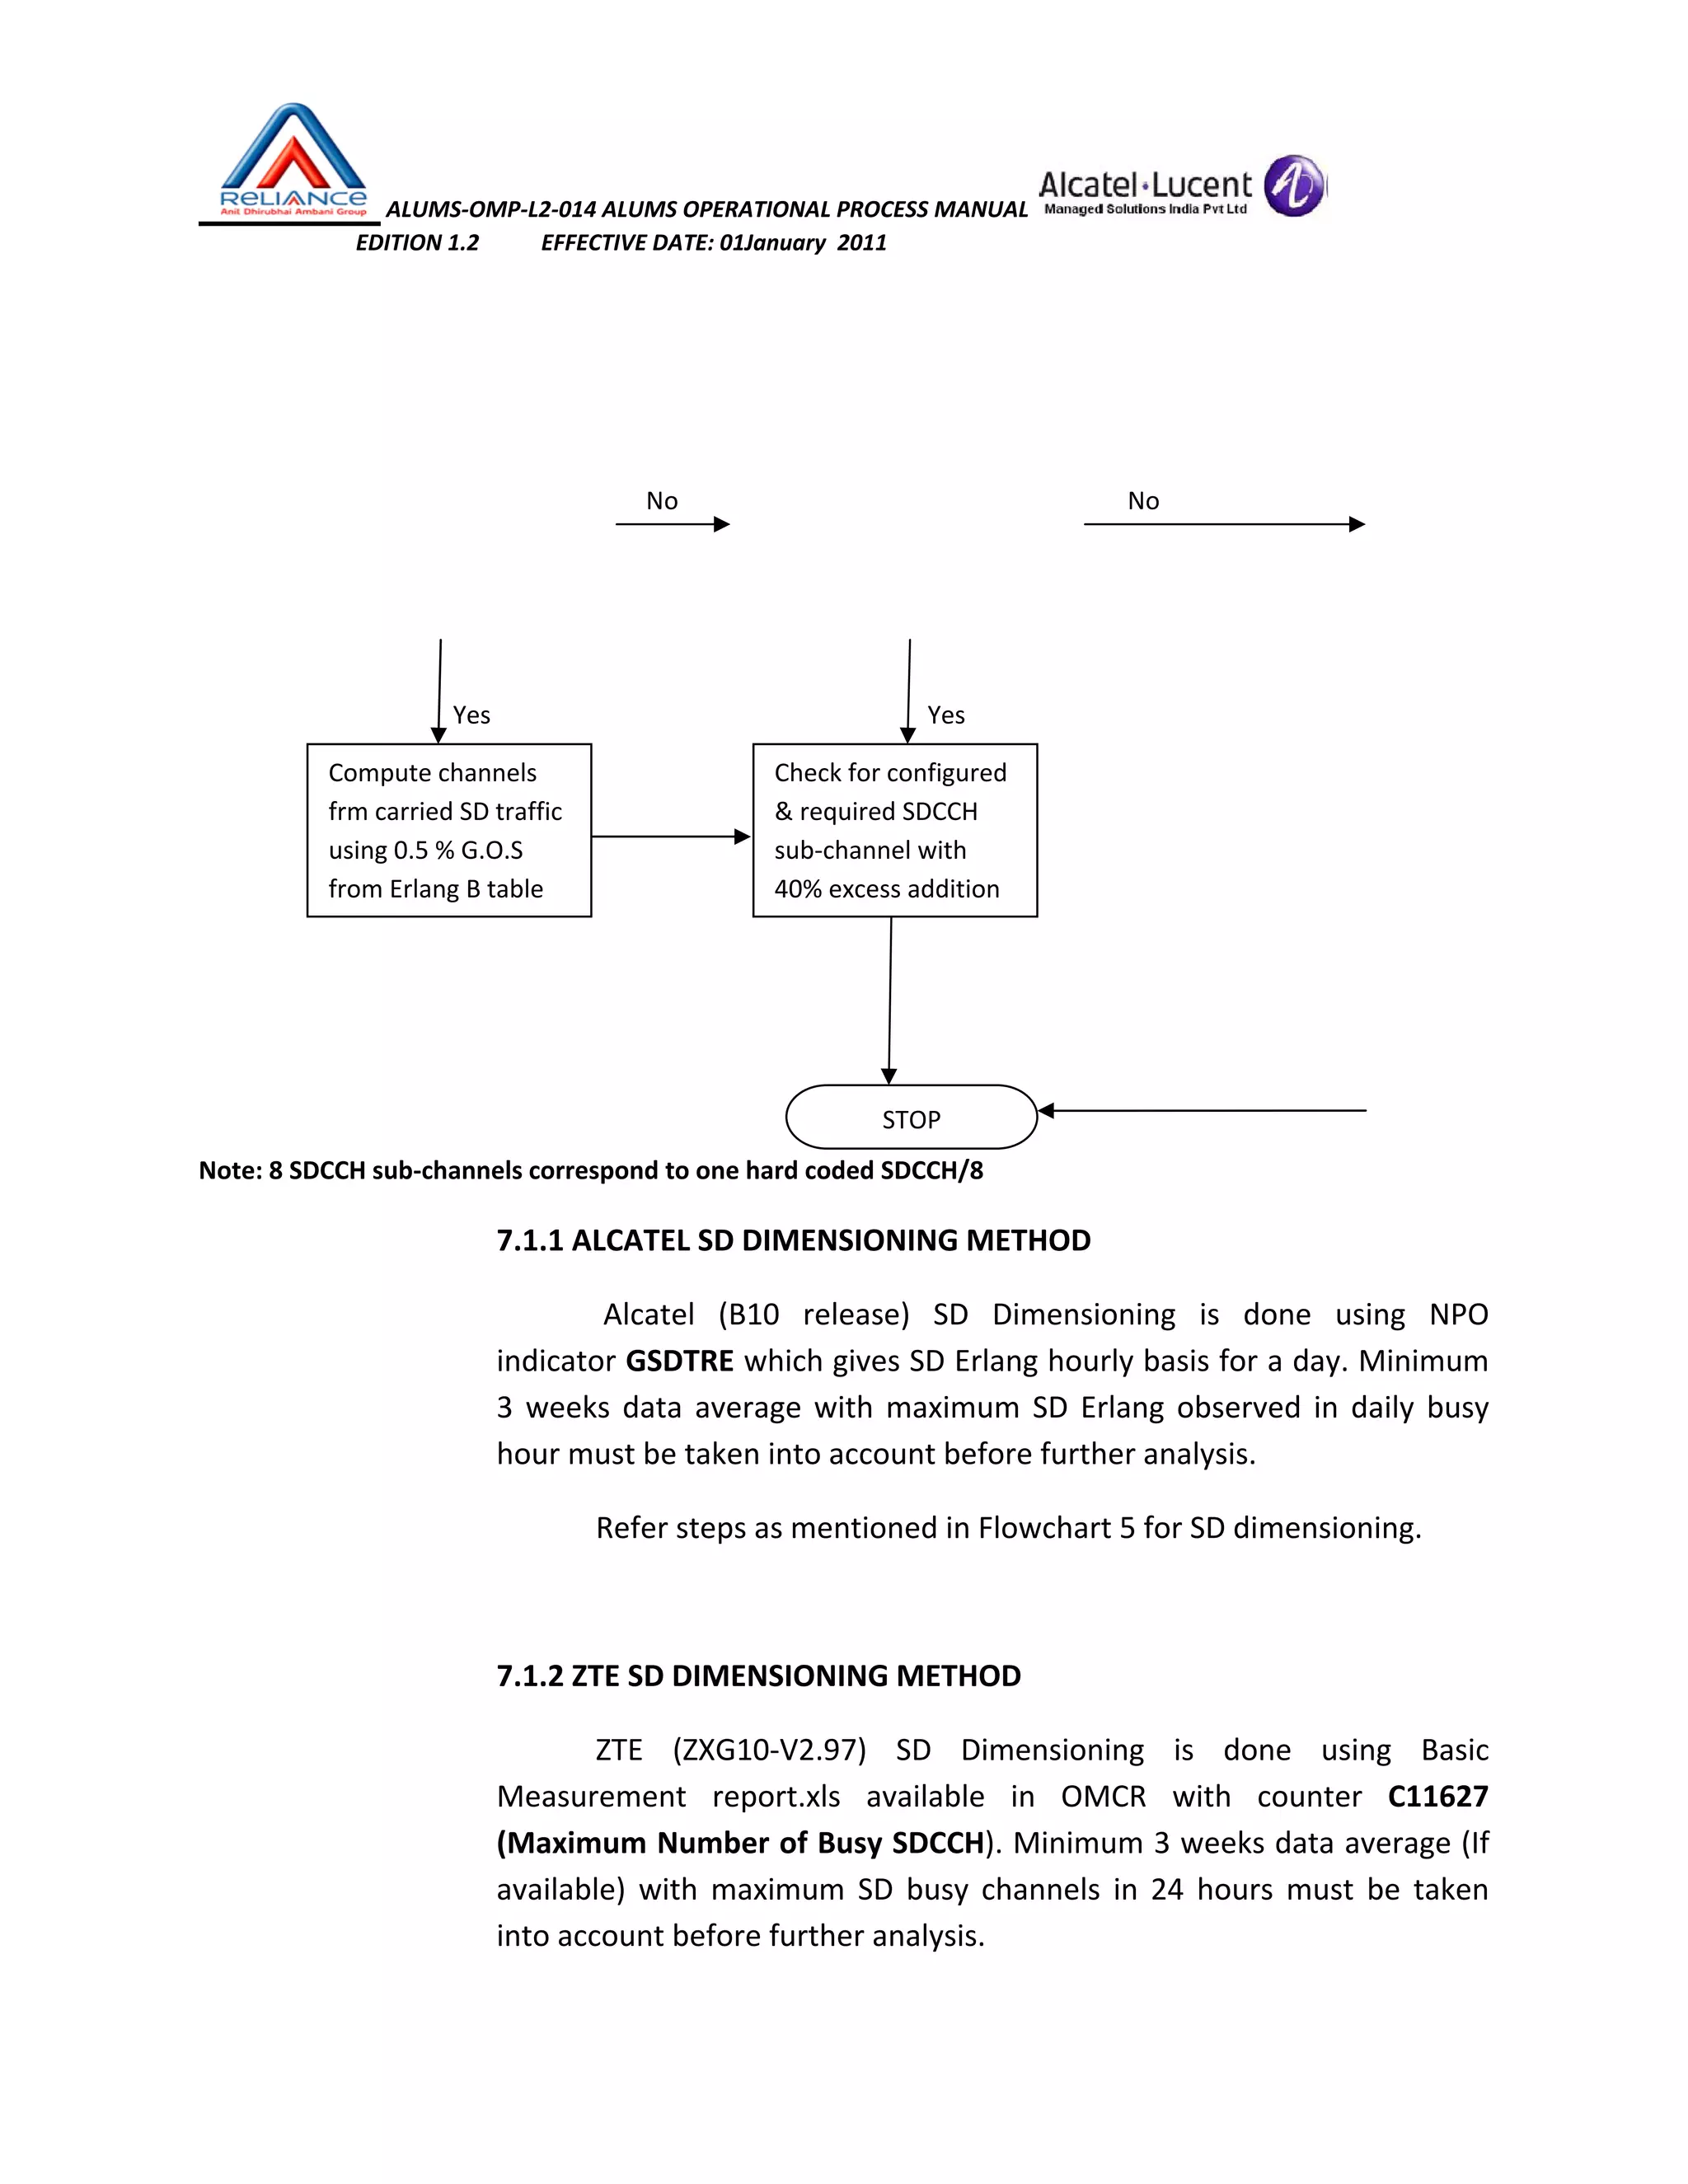


This document outlines processes for optimizing key performance indicators (KPIs) in a cellular network, including SDCCH assignment success rate, SDCCH drop rate, RACH success rate, TCH assignment success rate, Rx quality, handover success rate (HOSR), and TCH drop rate. For each KPI, it defines the measurement, identifies potential causes of poor performance, and provides steps to analyze detailed reports, check for issues like configuration errors or RF problems, and refine the network configuration to improve the KPI.
Overview of the ALUMS Operational Process Manual and key performance indicator (KPI) optimization process.
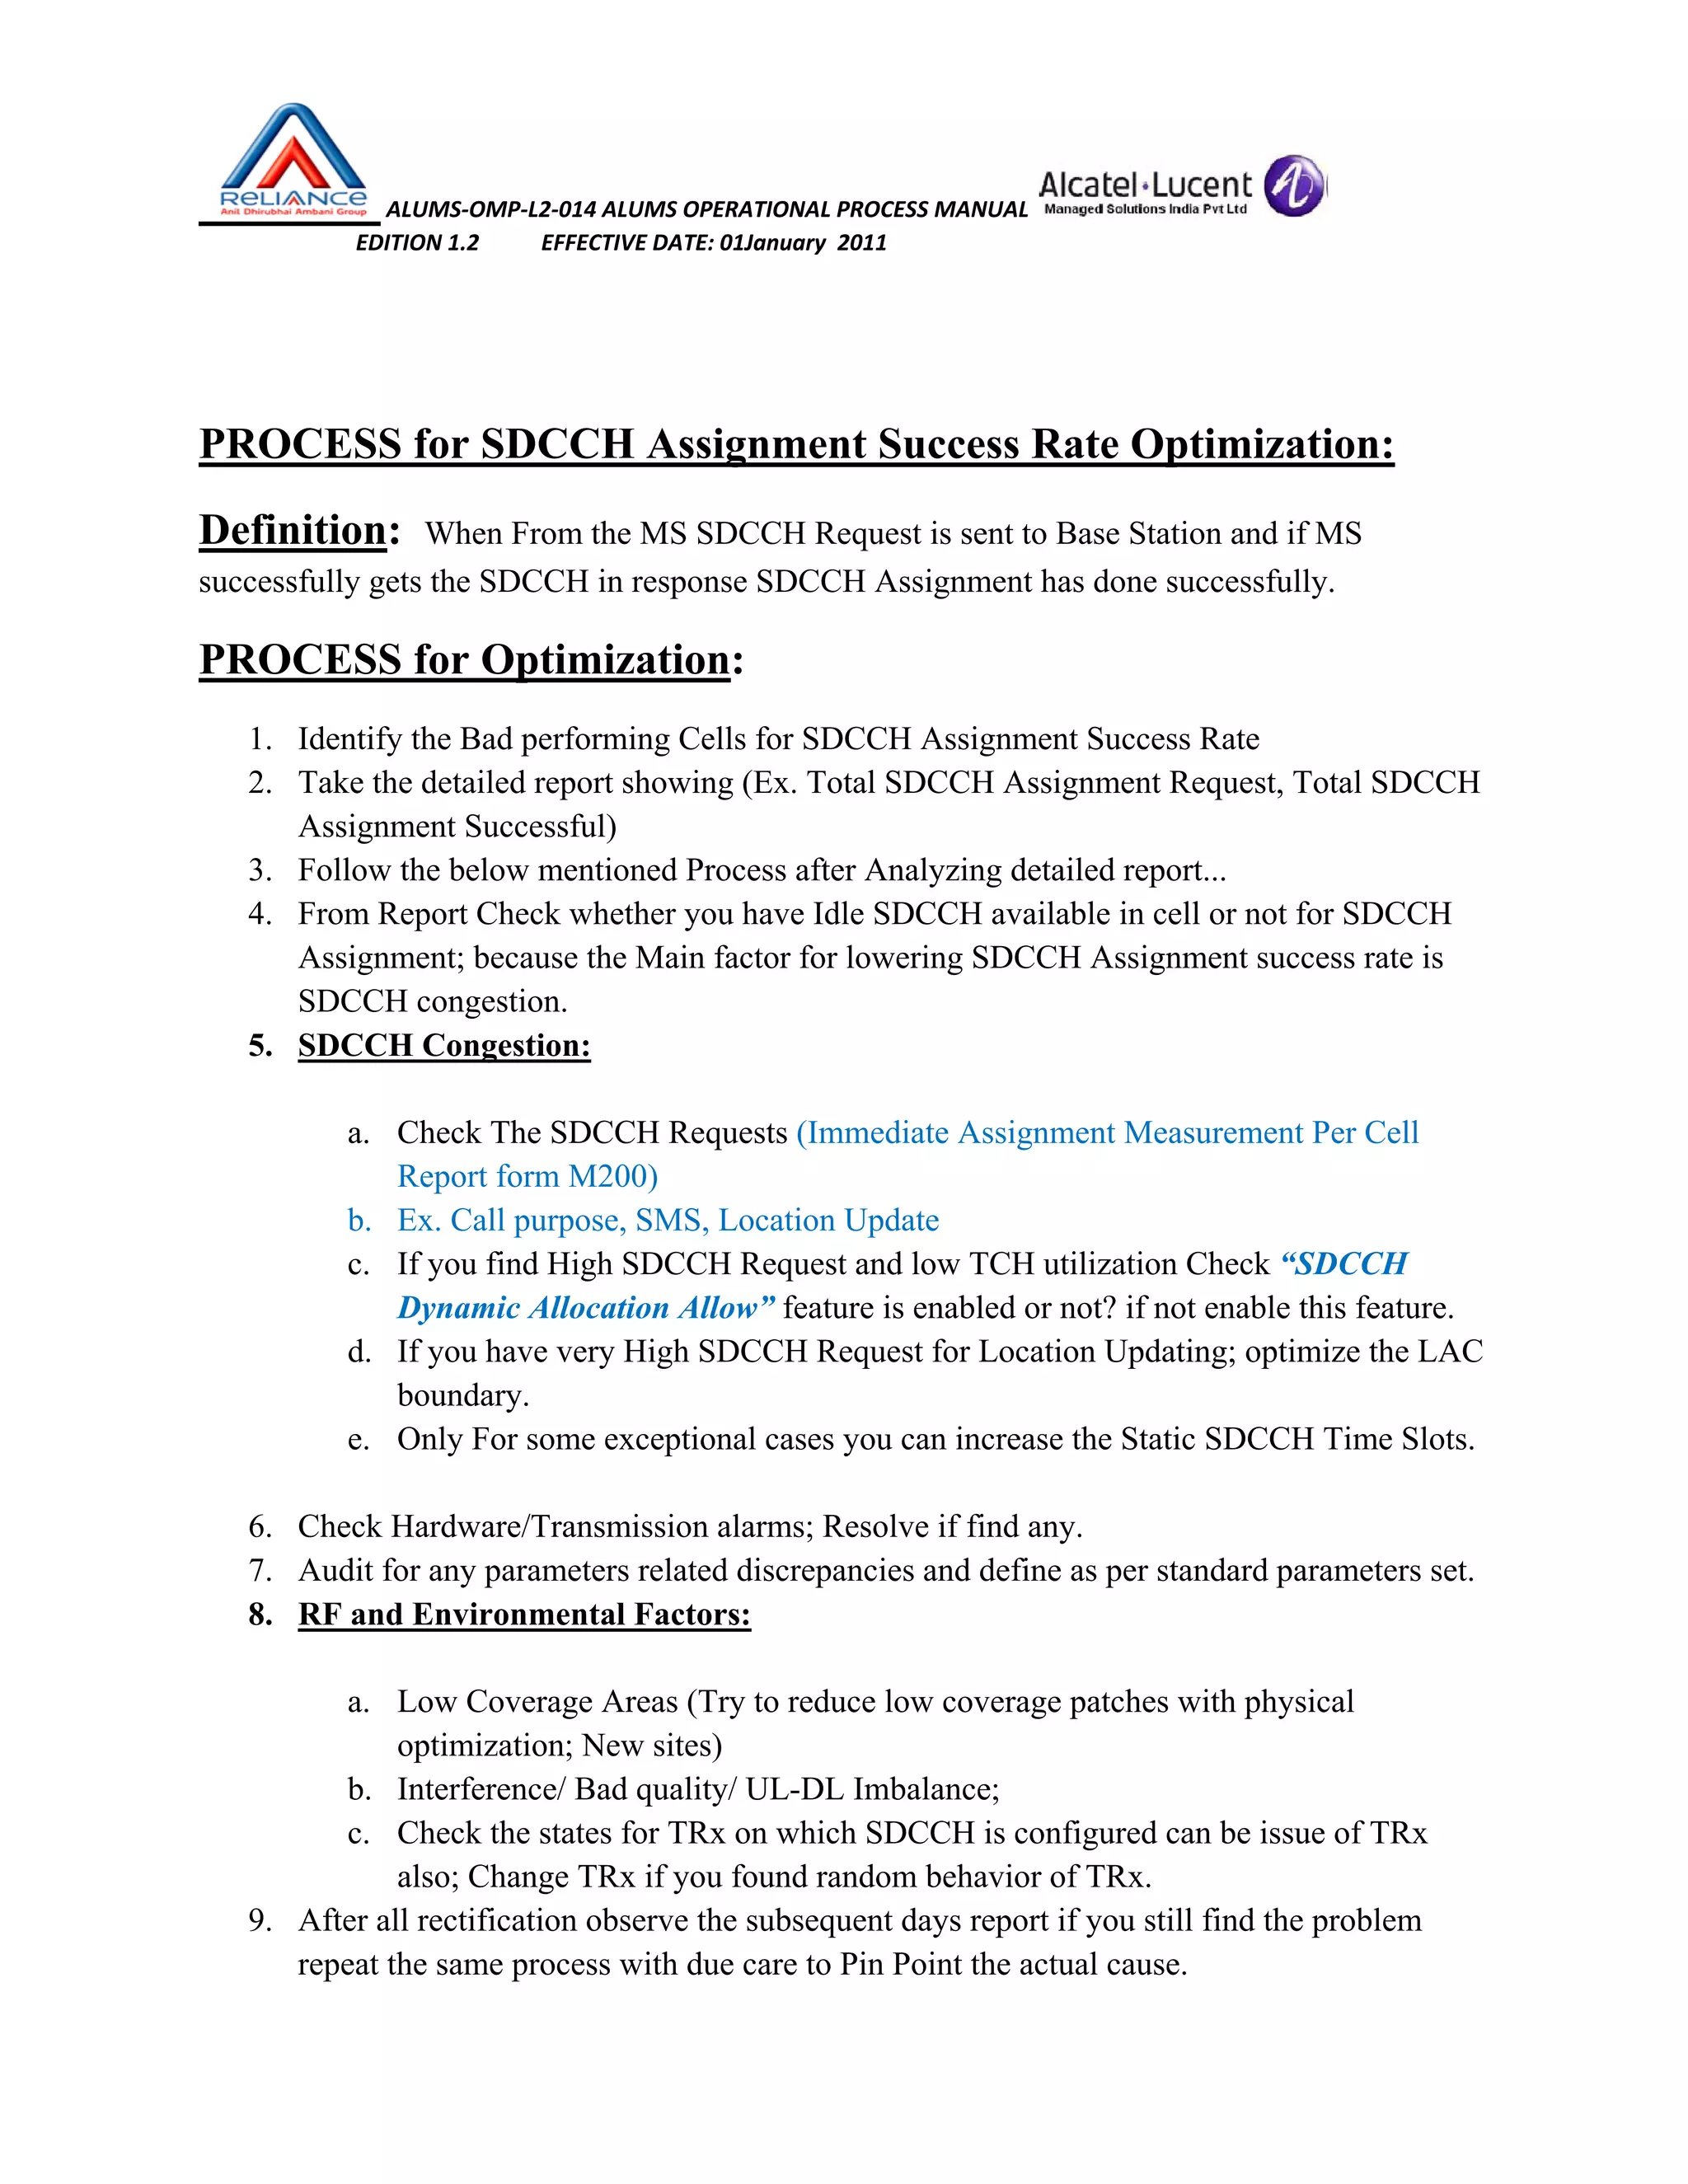
Process and strategies to optimize SDCCH Assignment Success Rate by analyzing cell performance and addressing congestion and configuration issues.
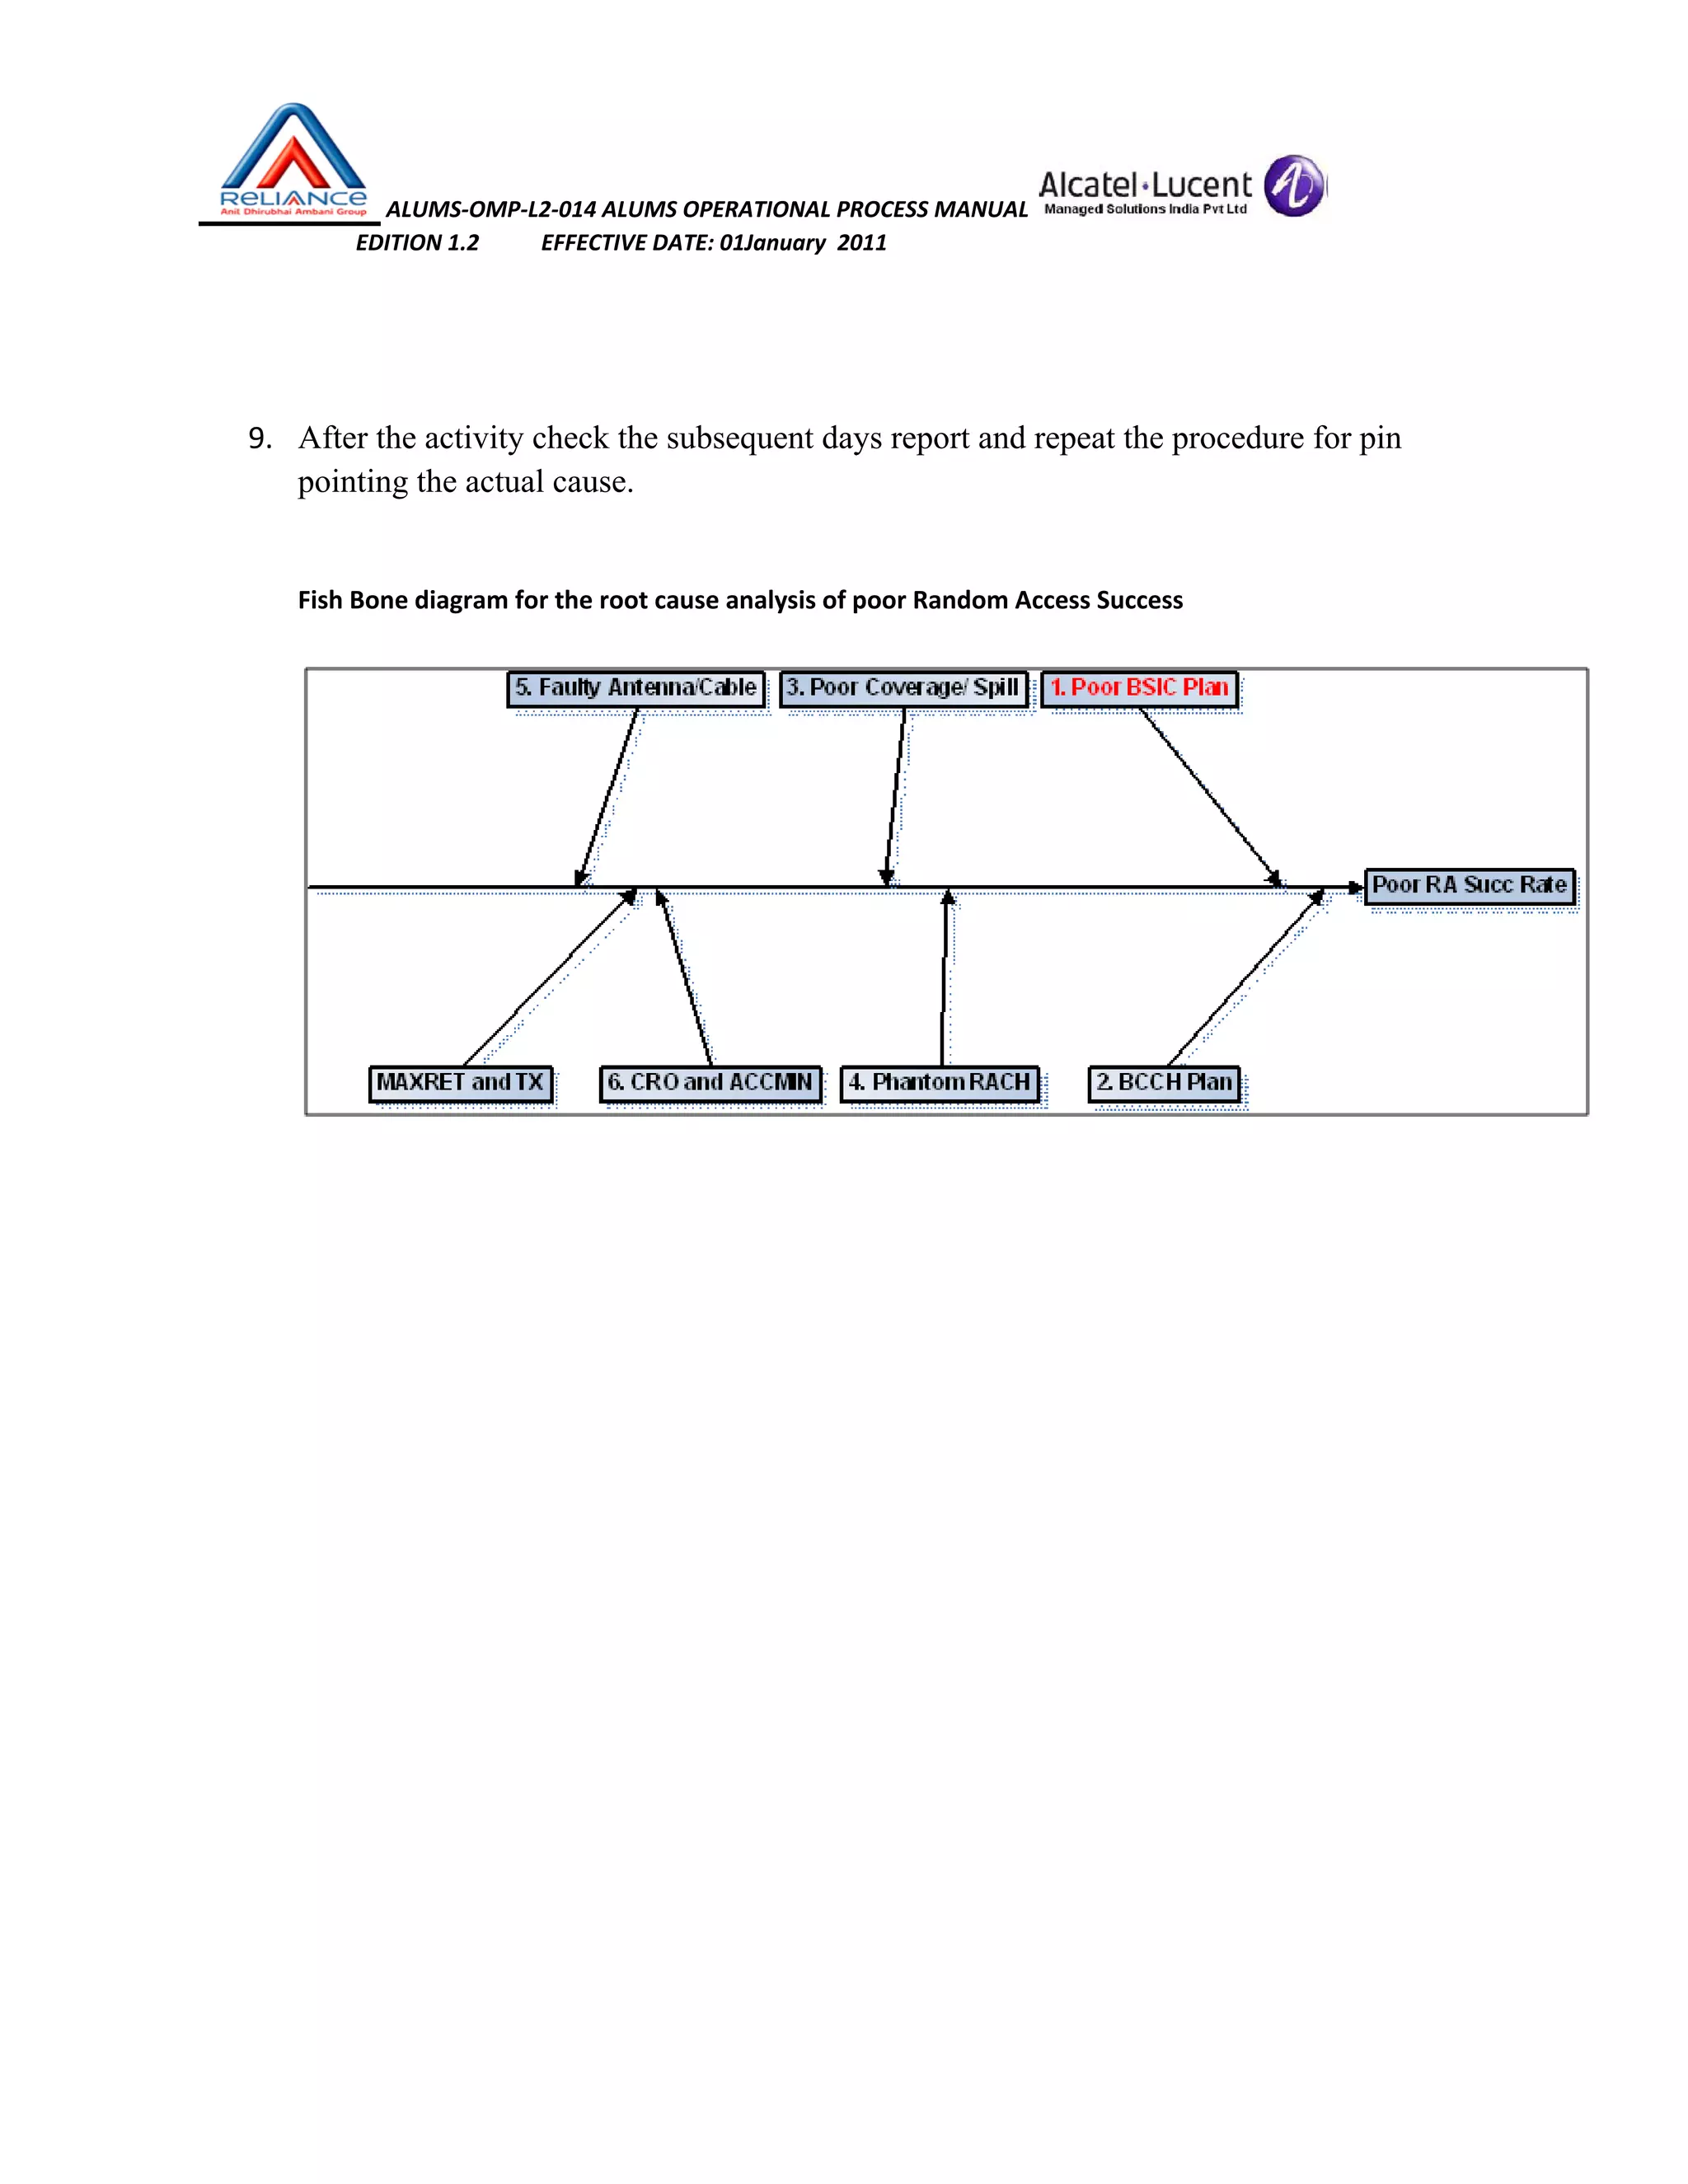
Optimization strategies for Random Access Channel (RACH) success rate focusing on configuration, interference, and hardware issues.
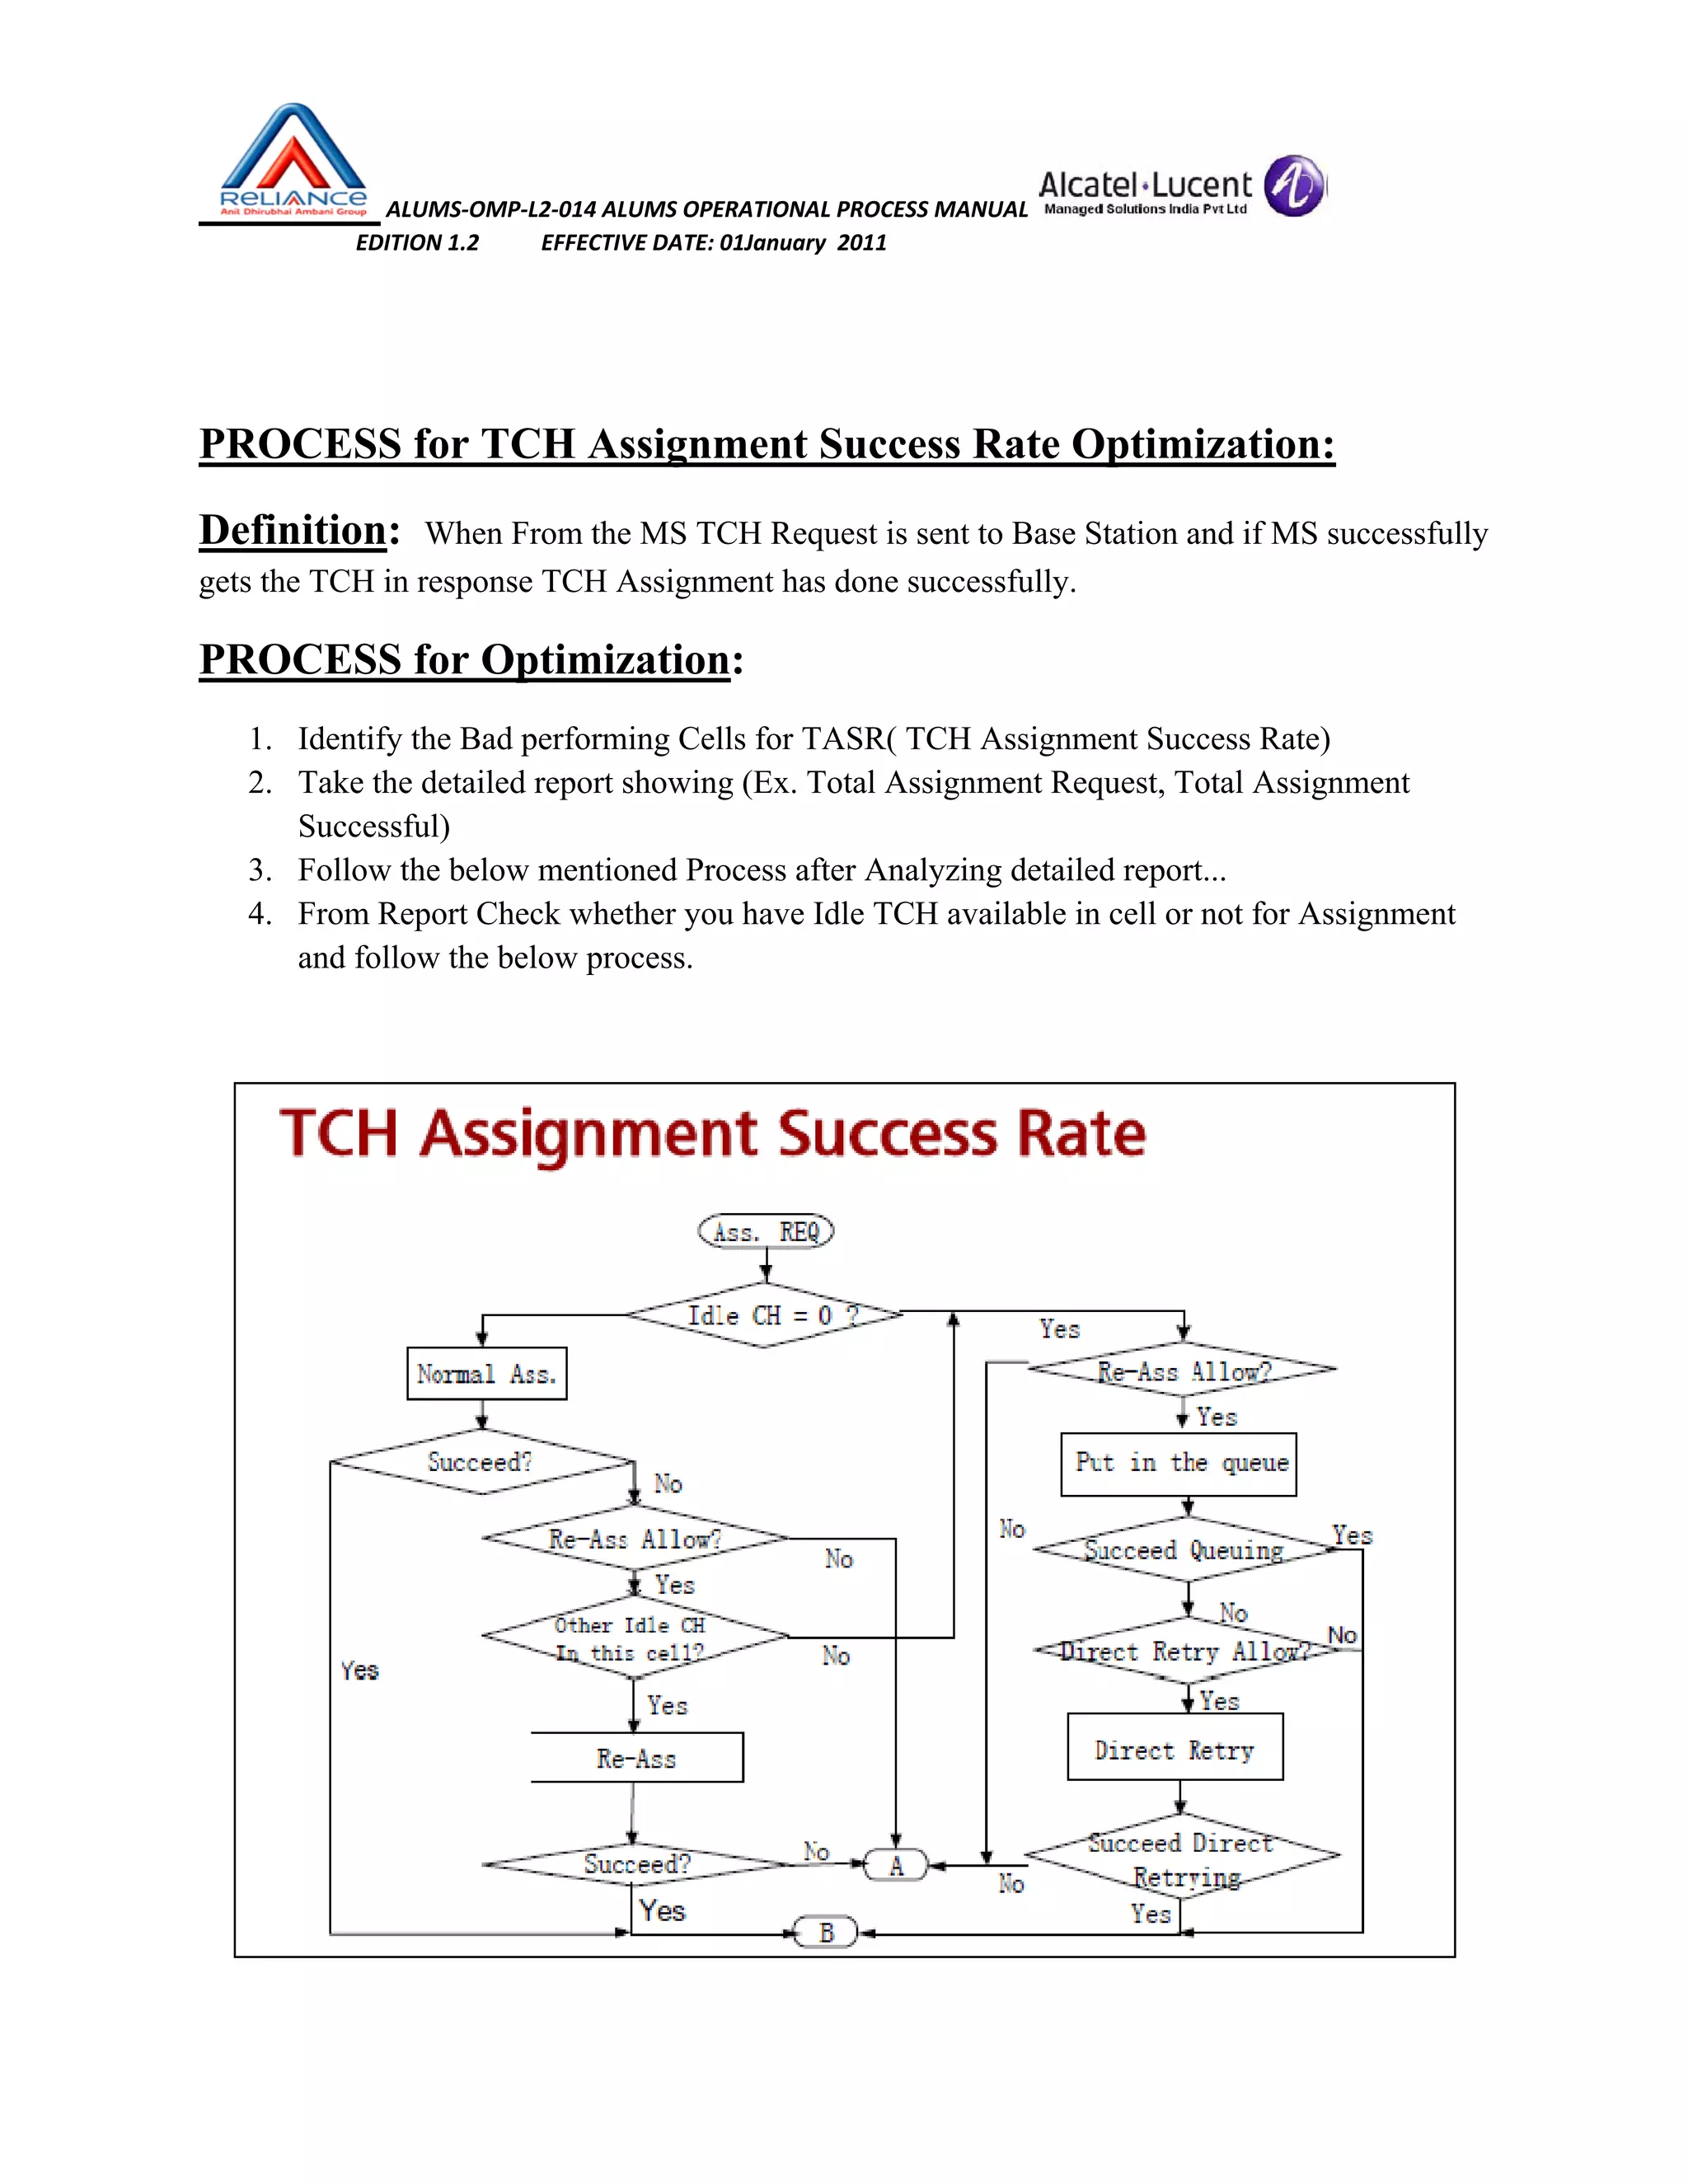
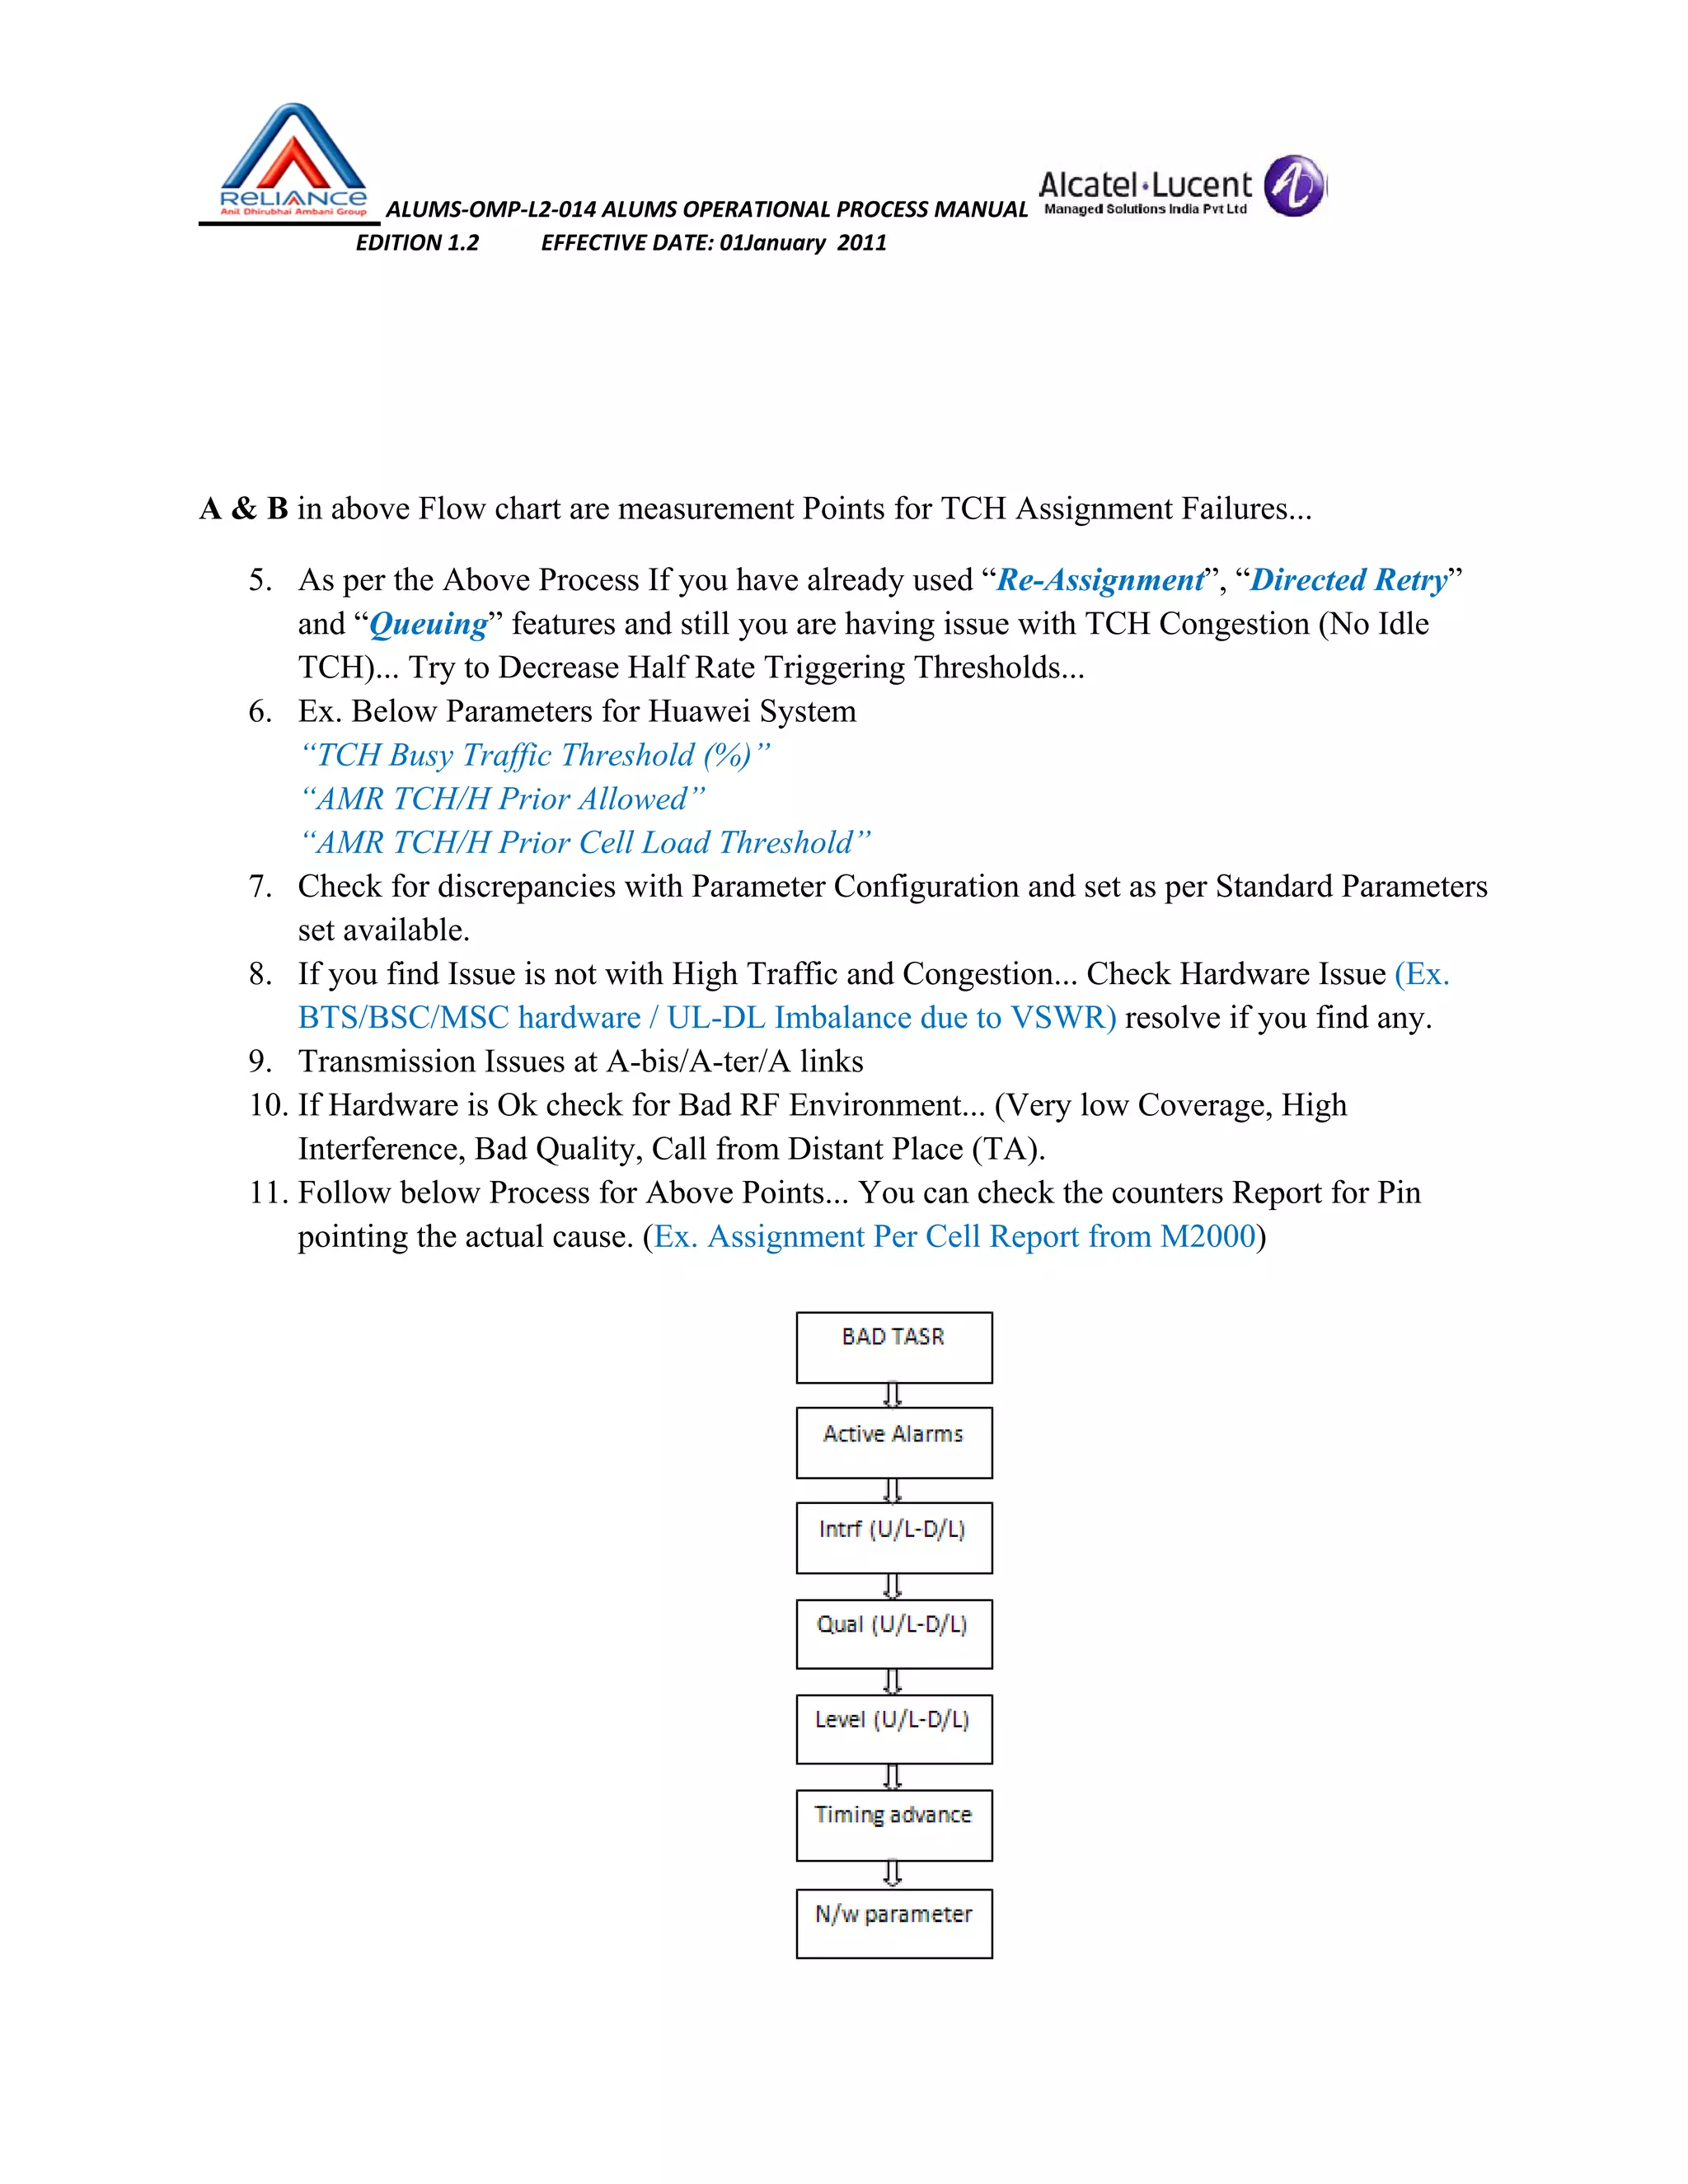
Process for optimizing TCH Assignment Success Rate by checking available resources, configuration, and potential causes of congestion.
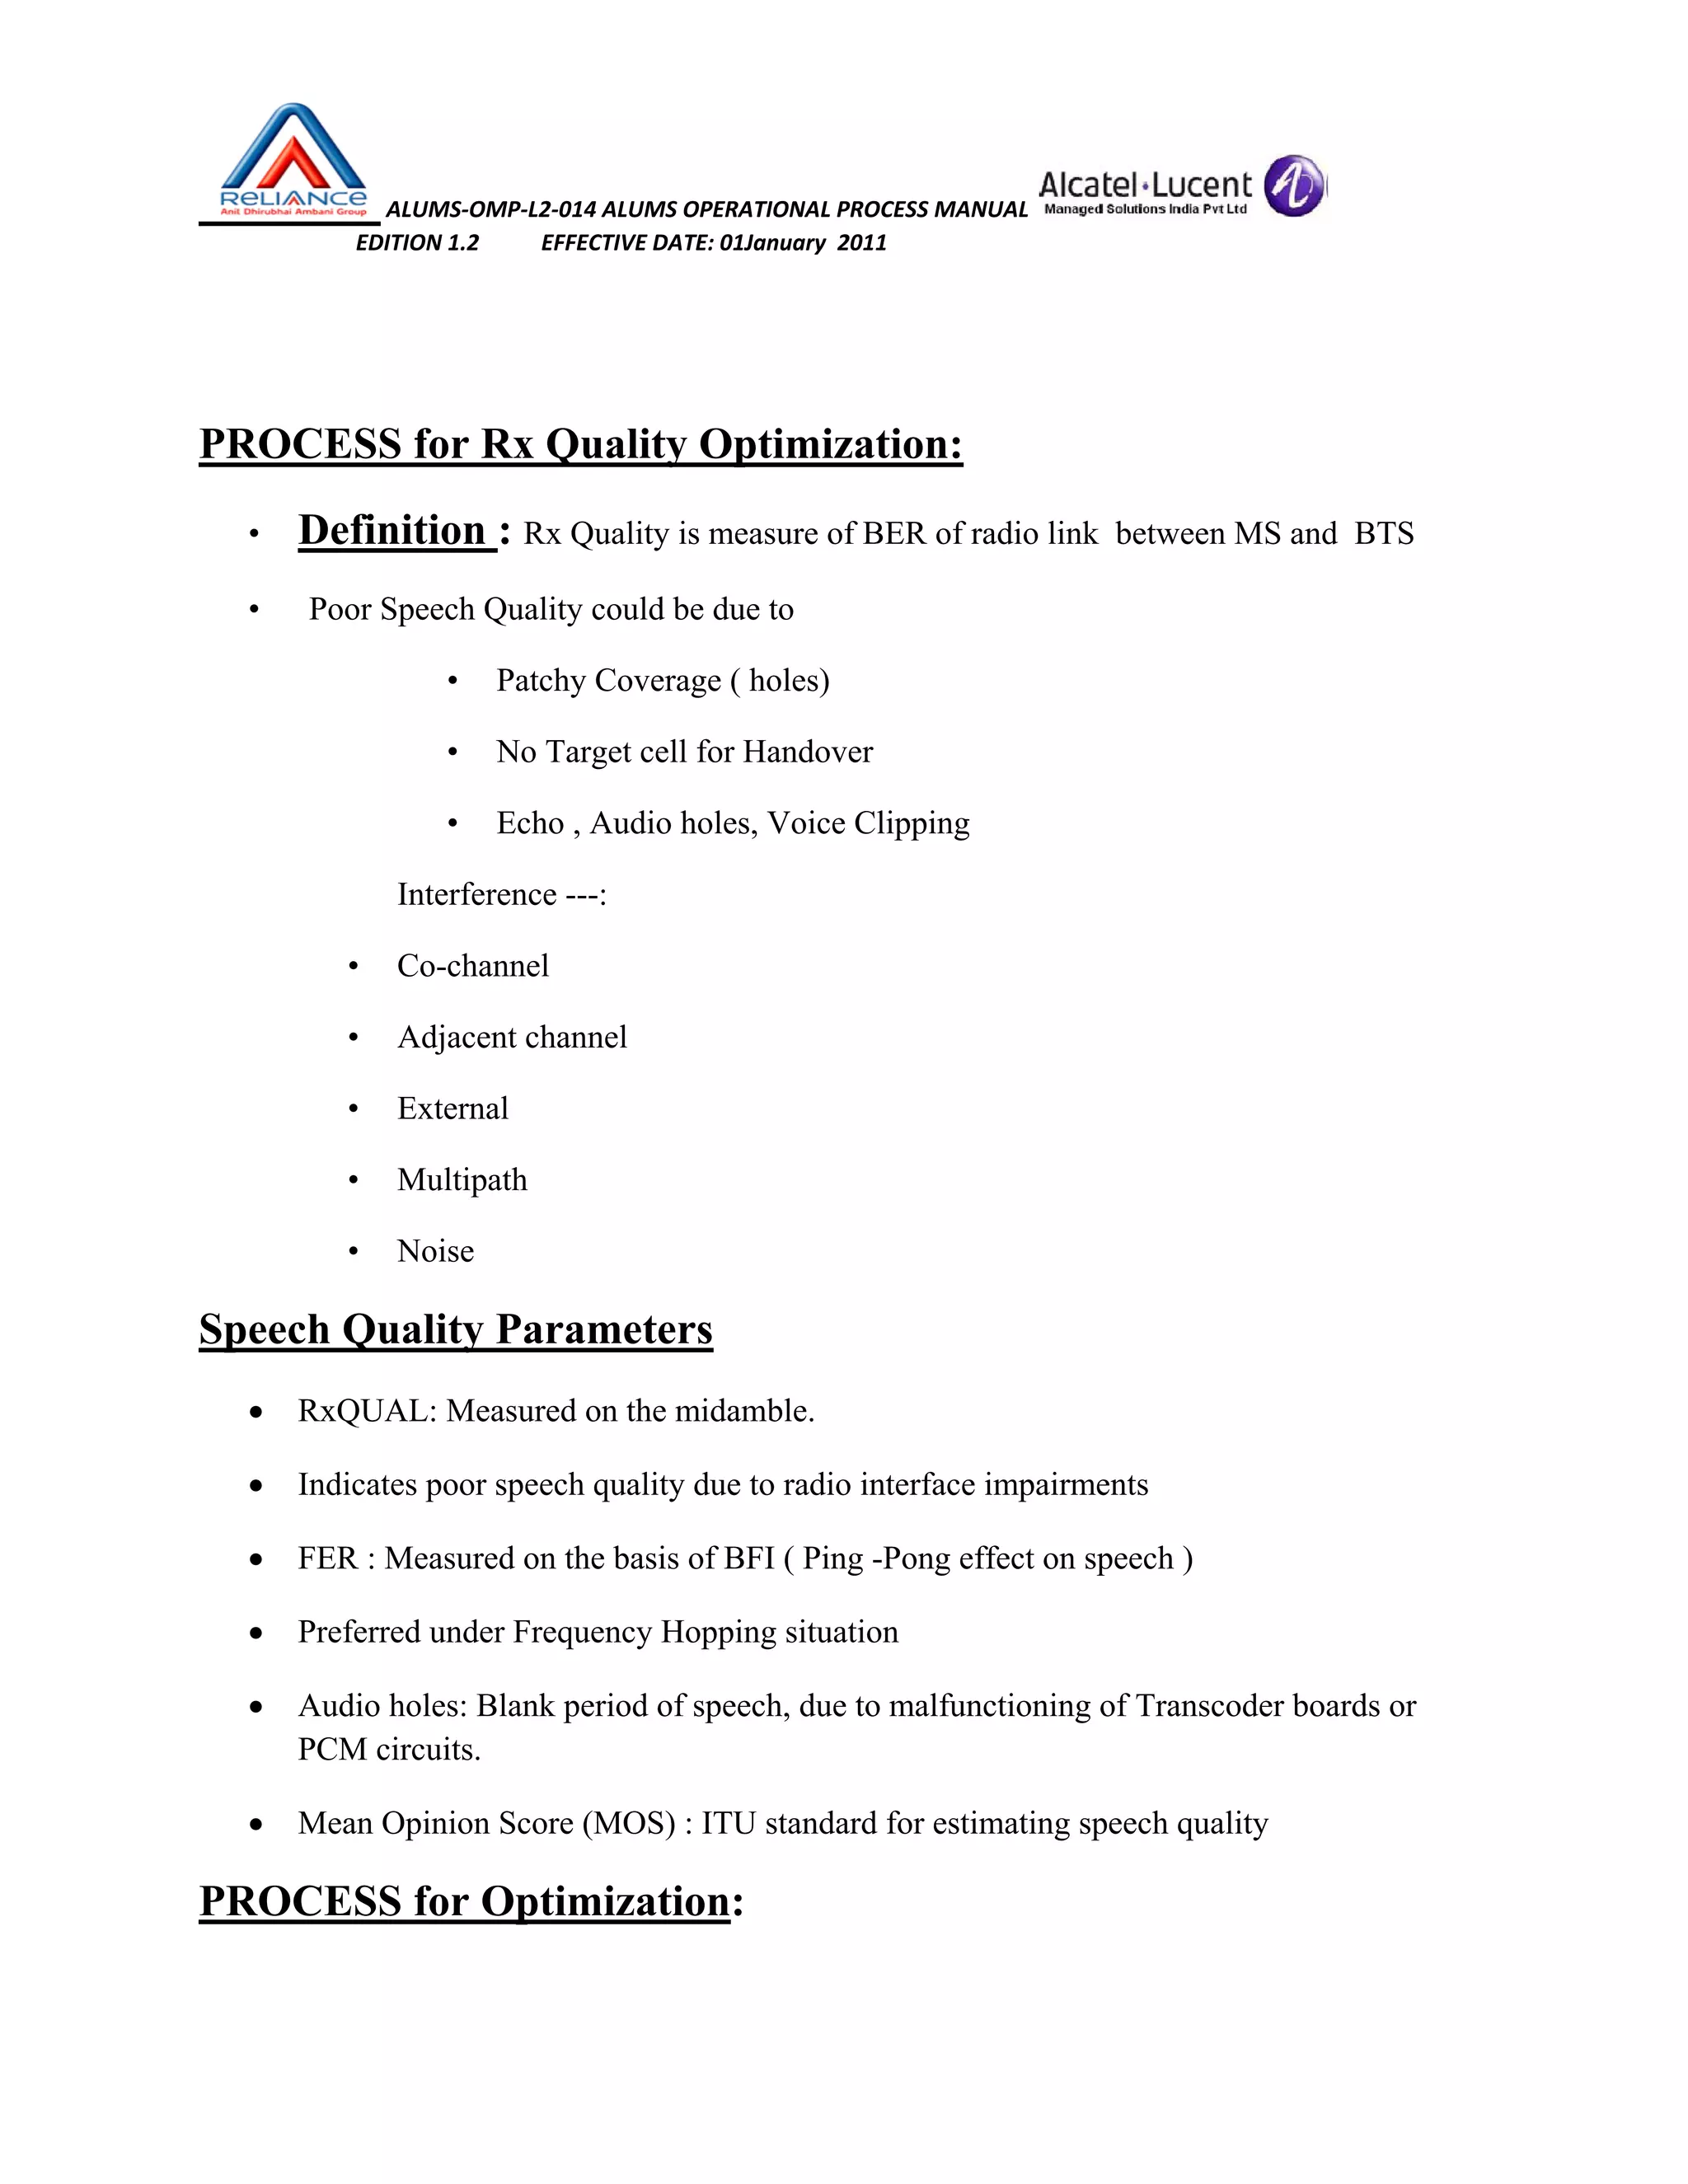
Focus on optimizing reception quality (Rx Quality) through physical optimizations and parameter adjustments.
Strategies for handover success rate (HOSR) optimization, addressing signal strength, quality, and external interferences.
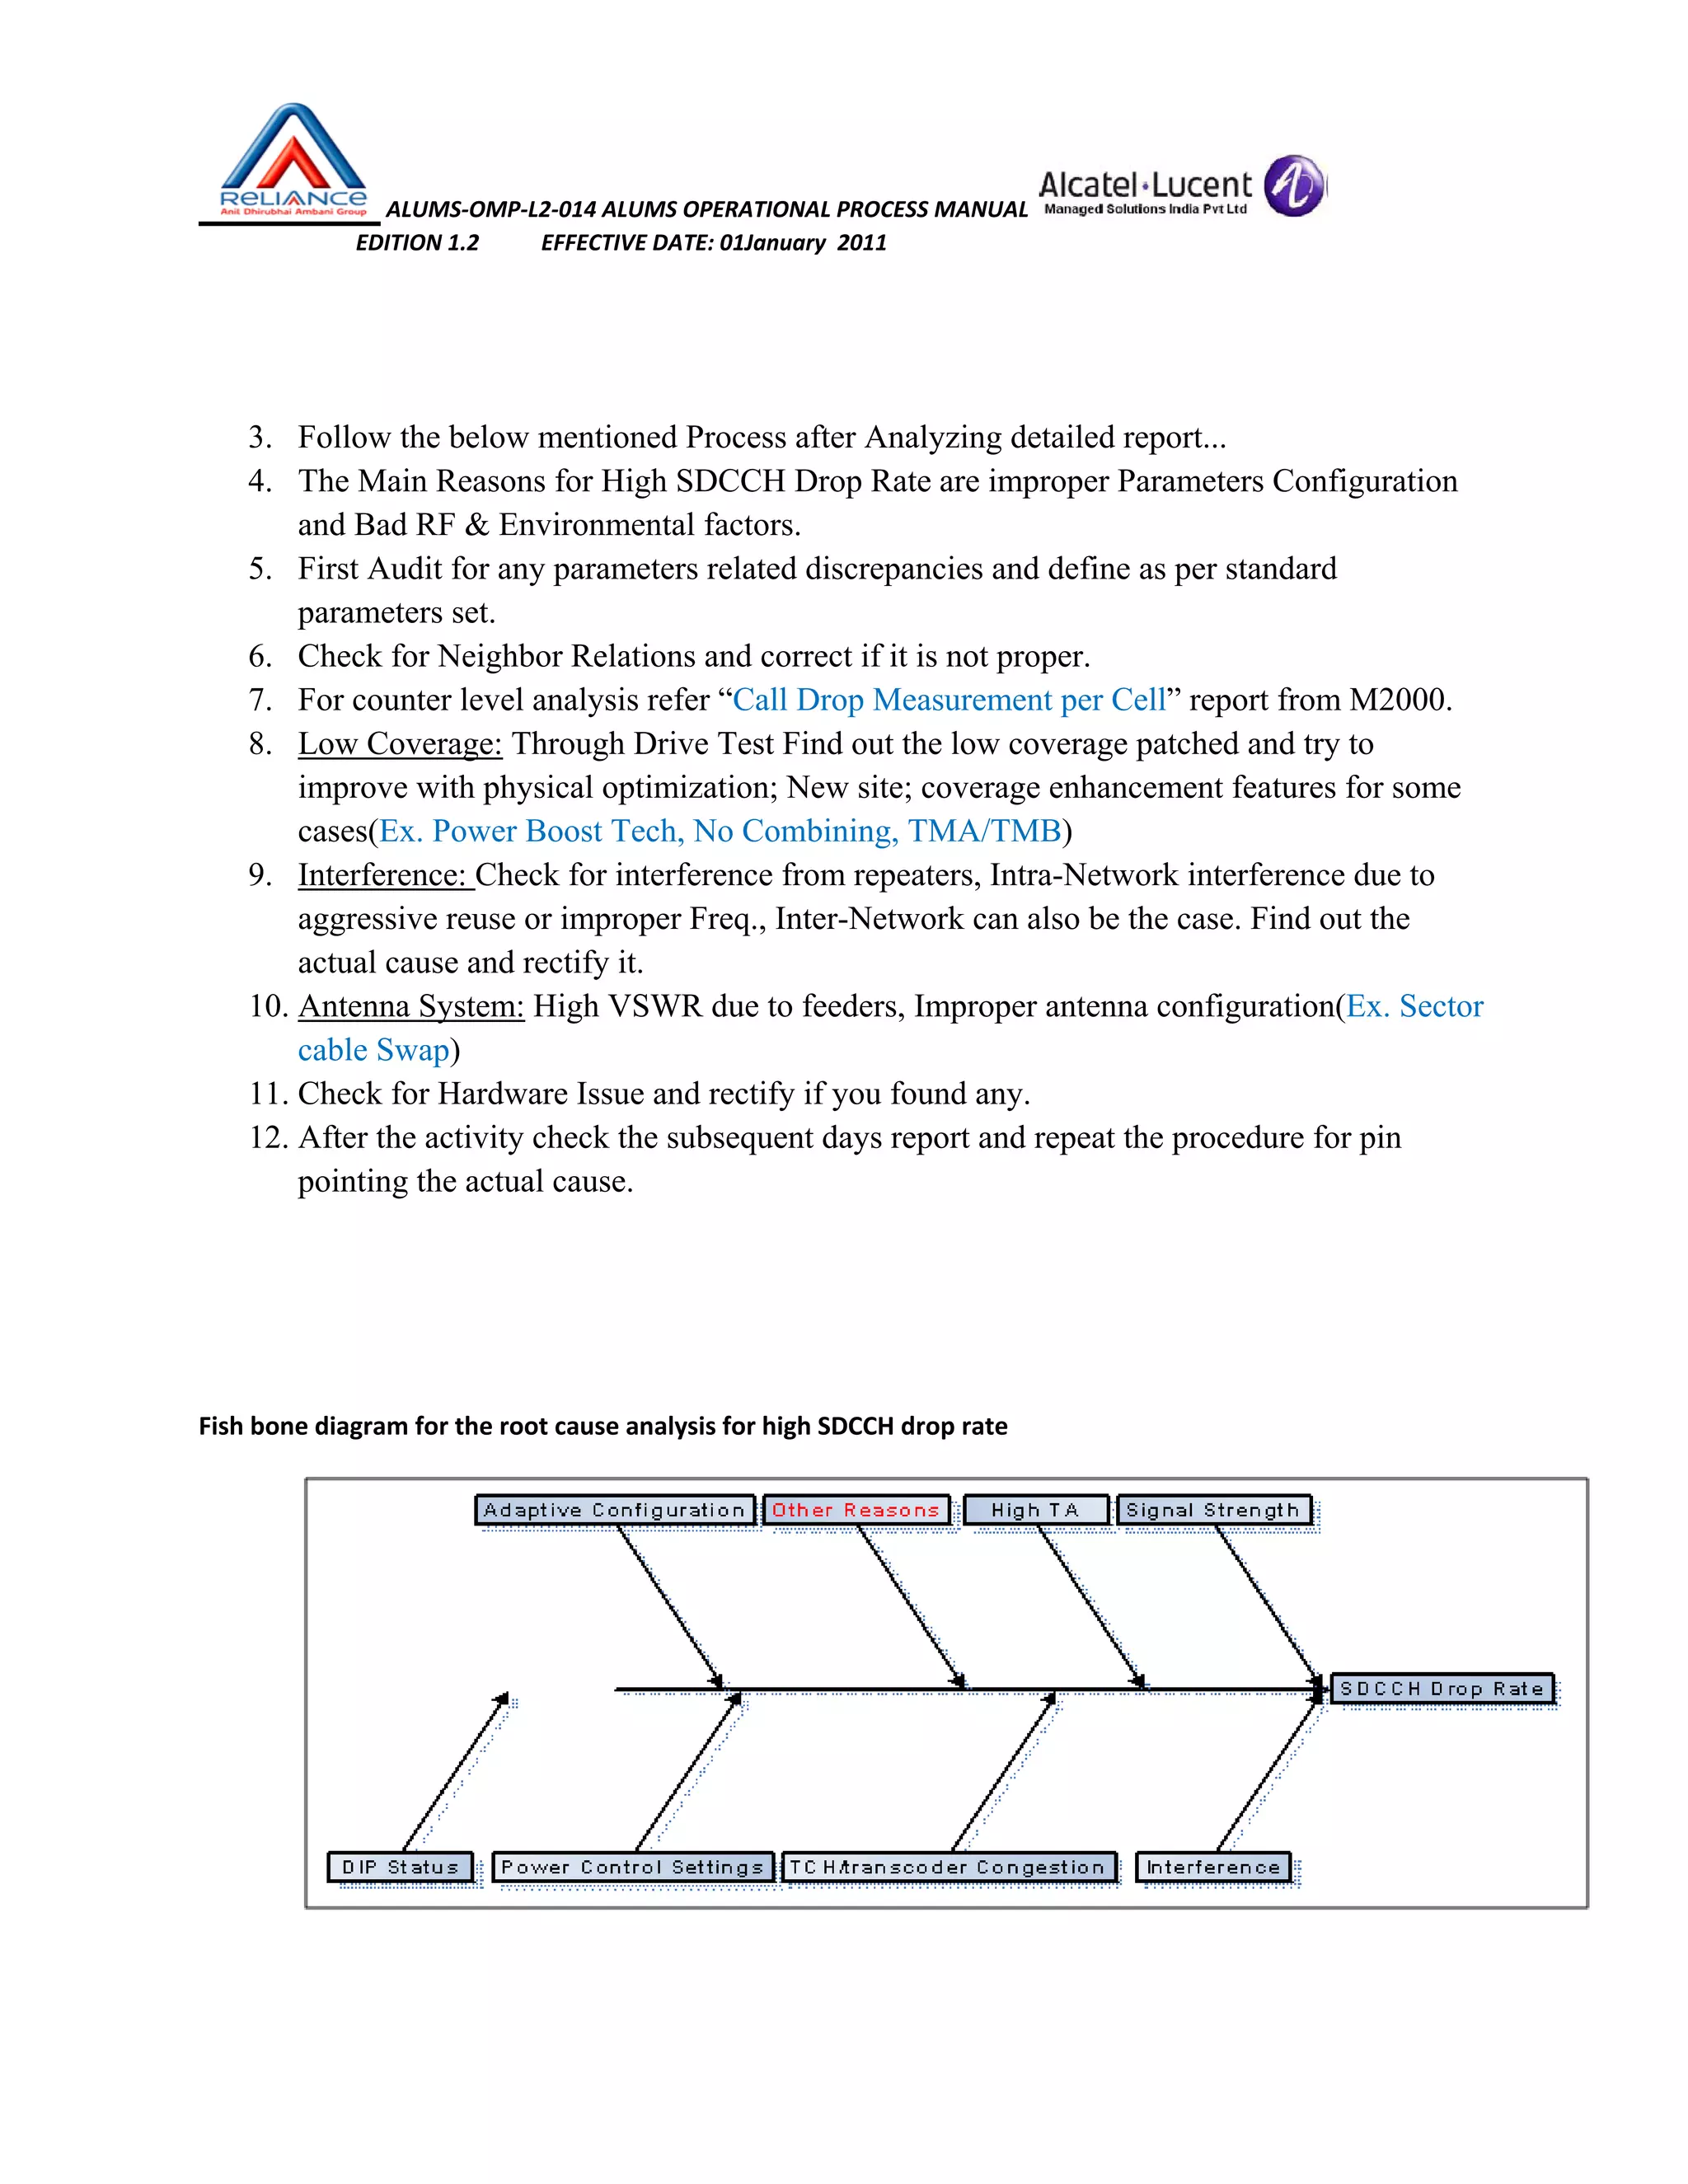
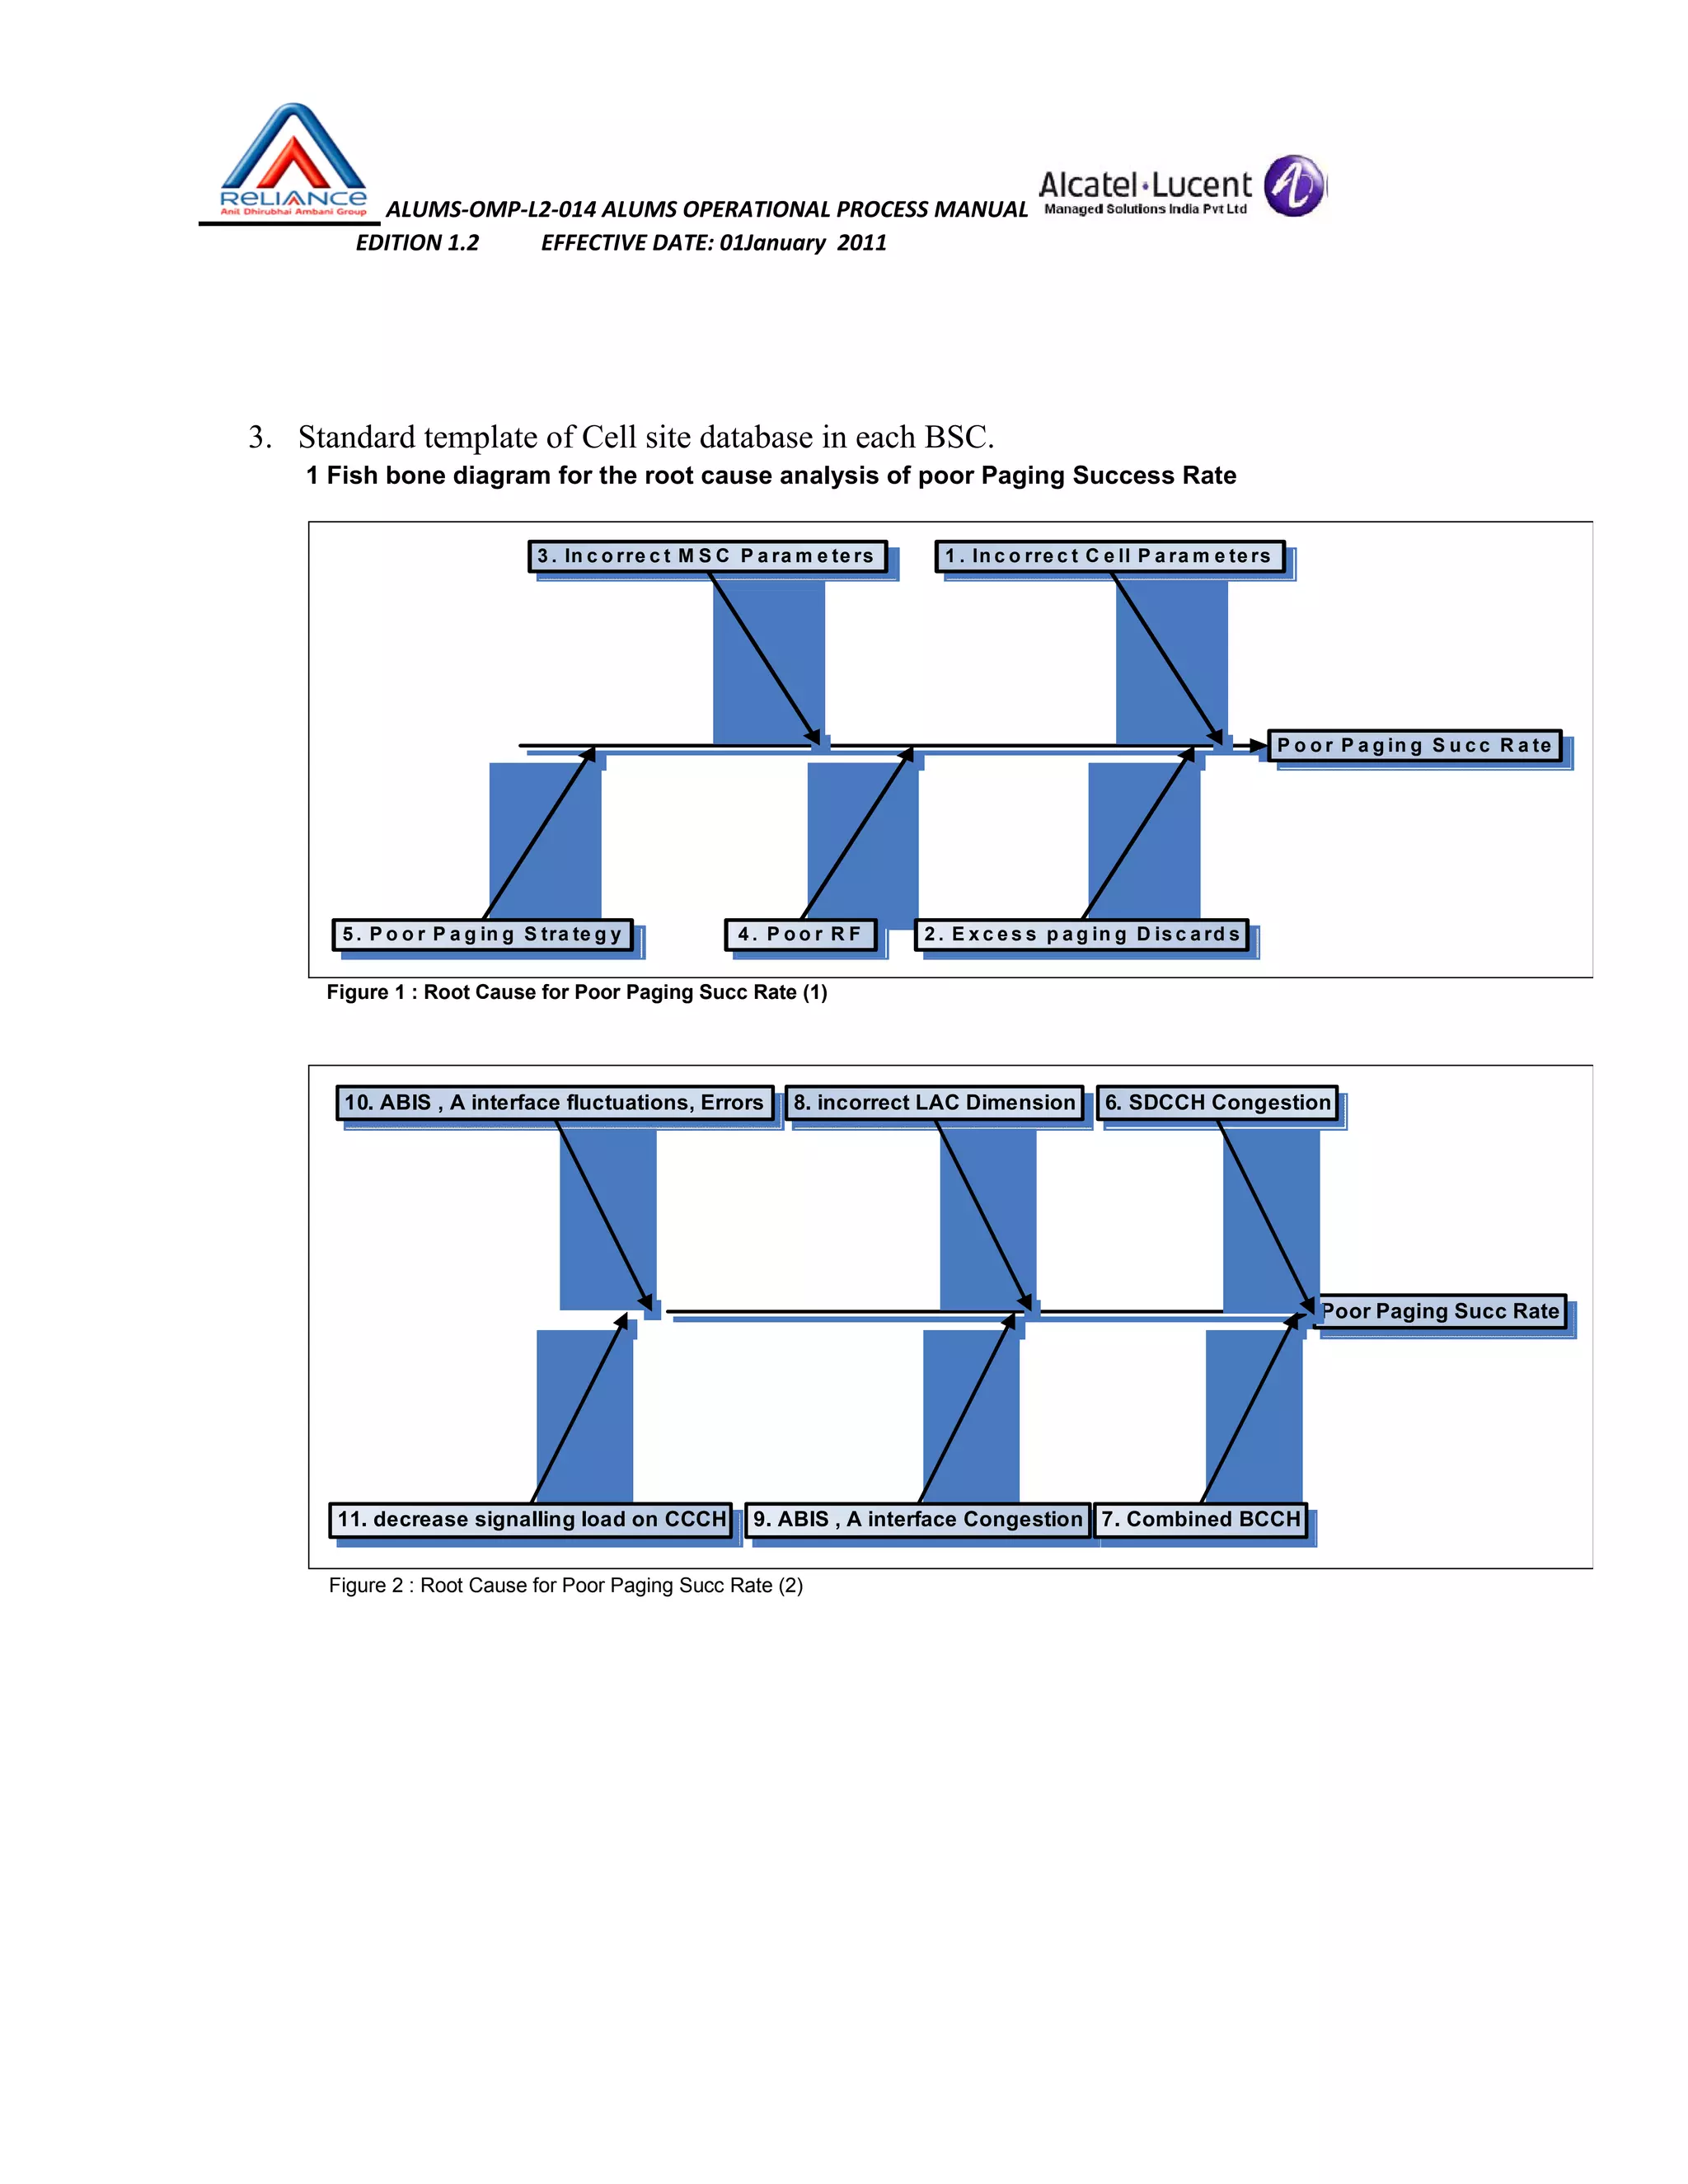
Process for TCH drop and SDCCH drop optimizations identifying causes of call drops and methods to reduce them.Details on optimizing the signaling success rate and paging success rate with focus on removal of errors and correct configuration.
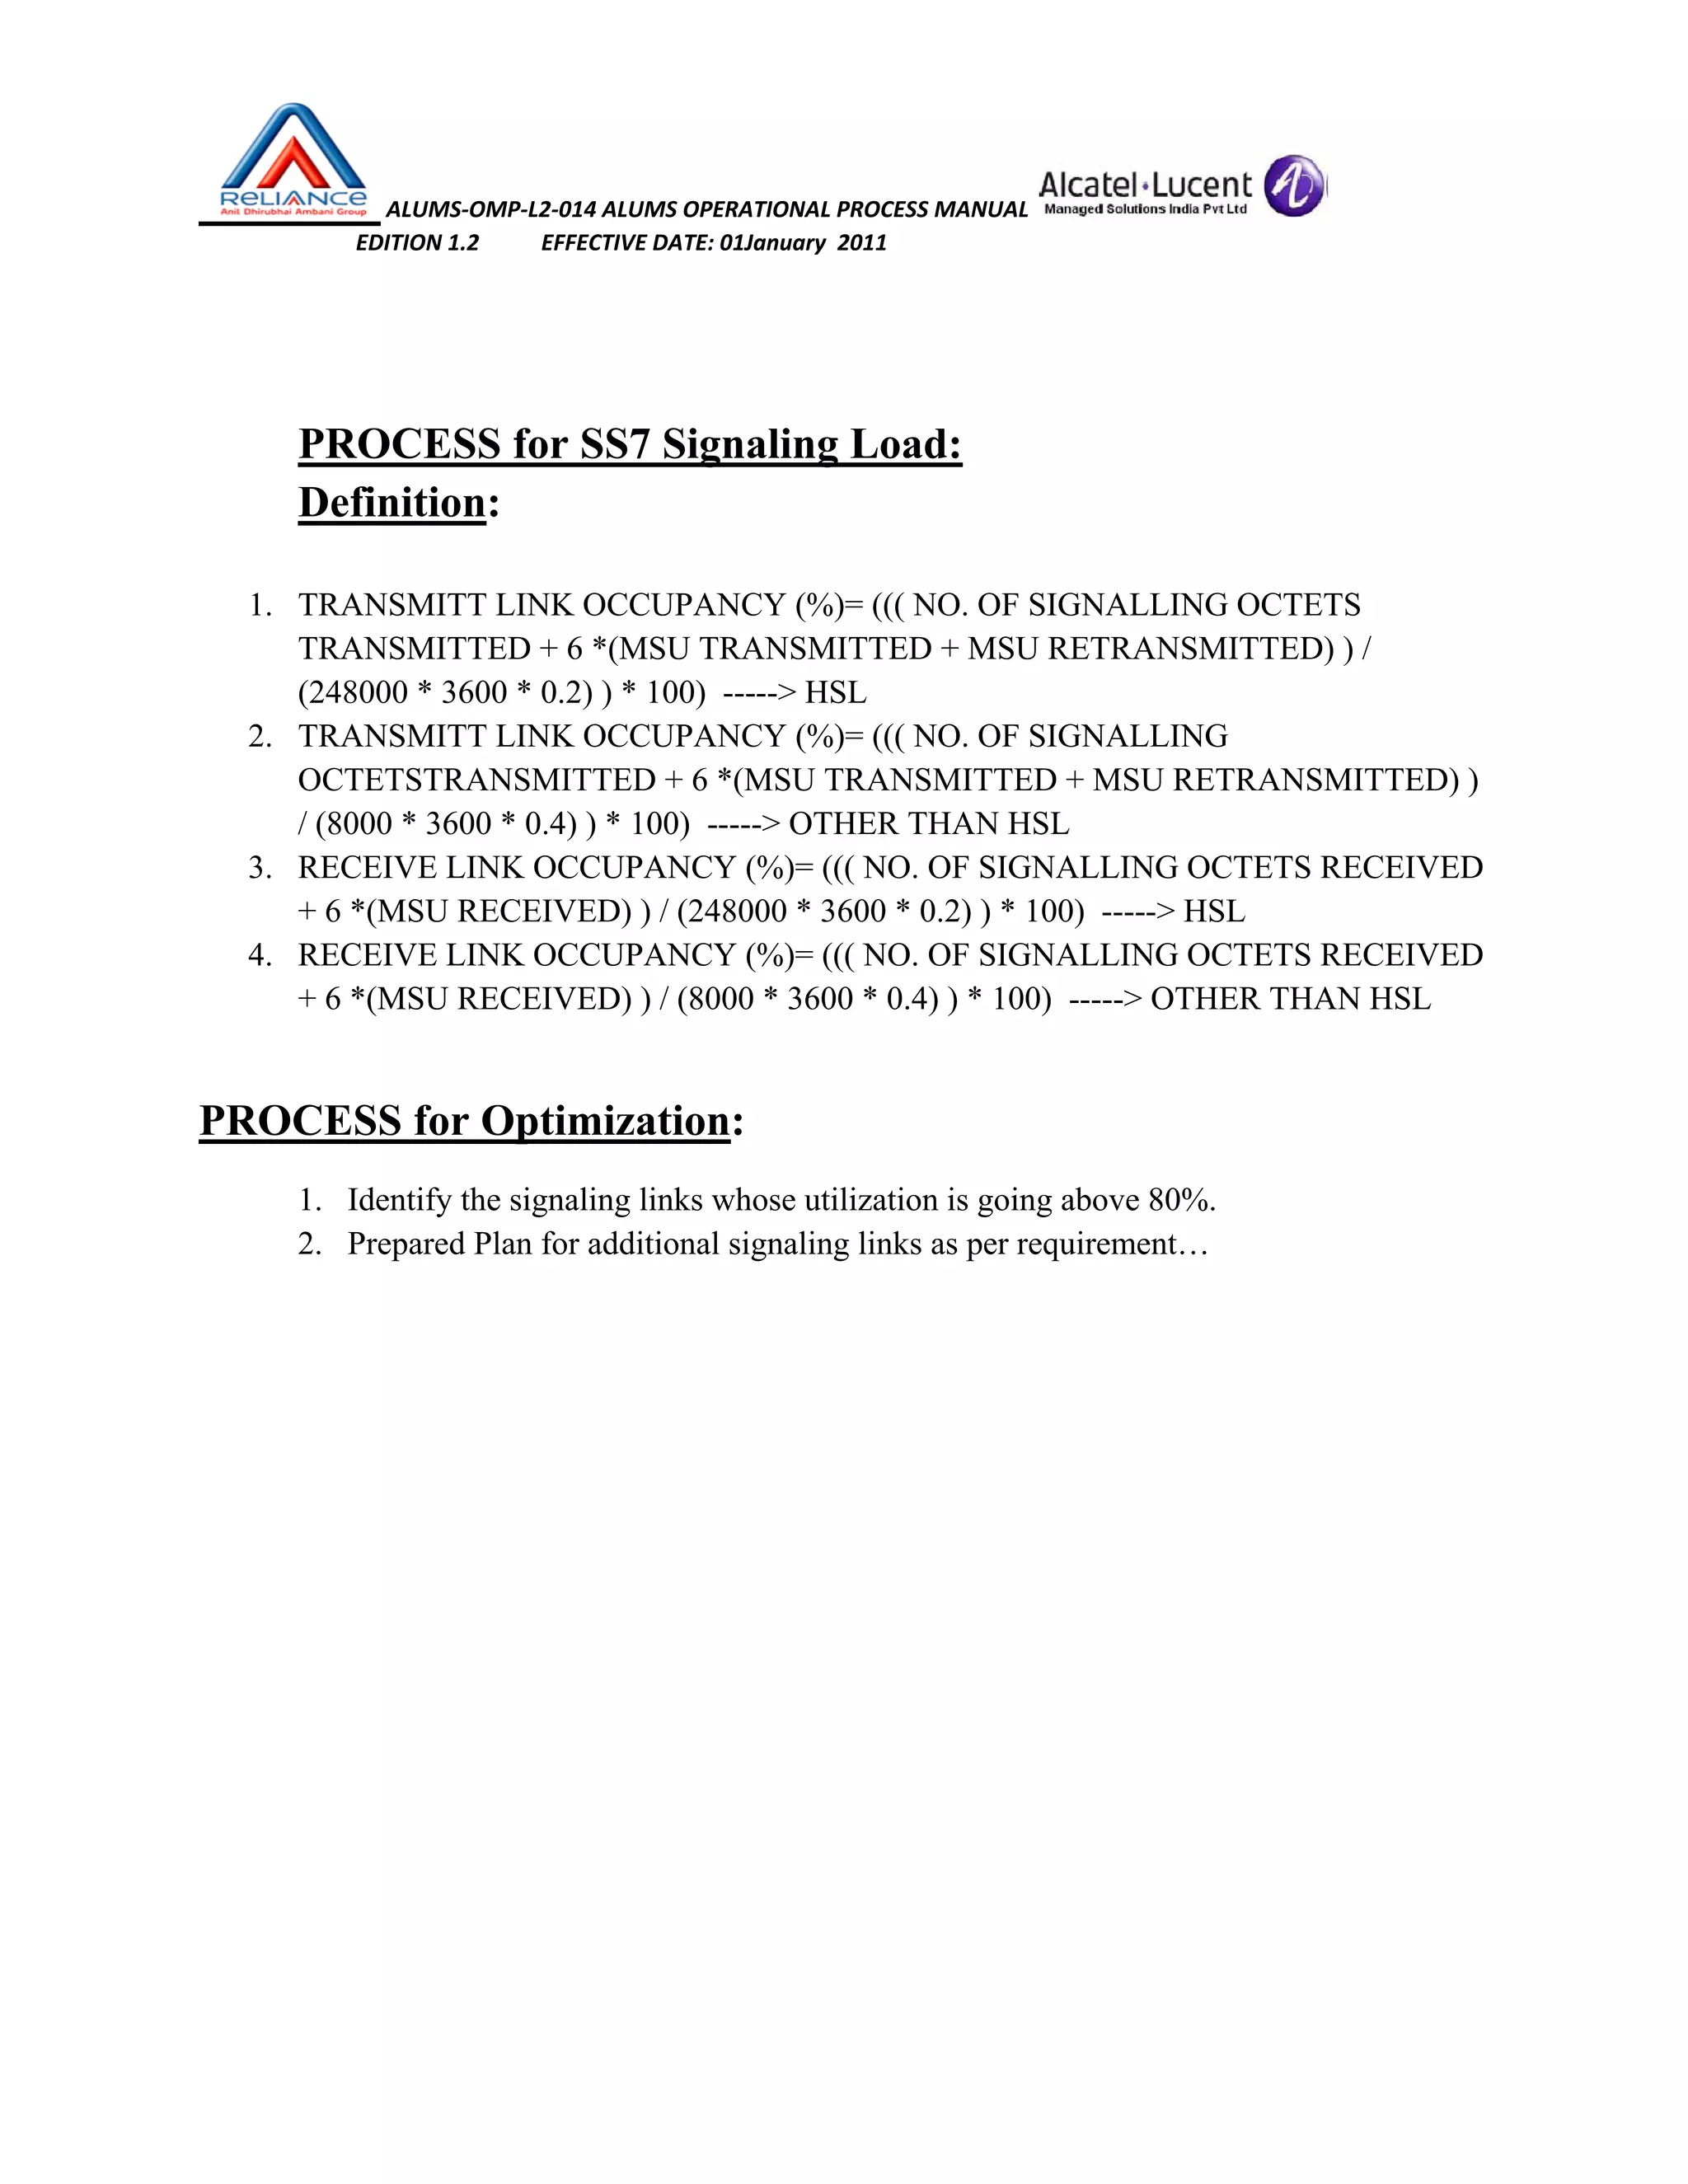
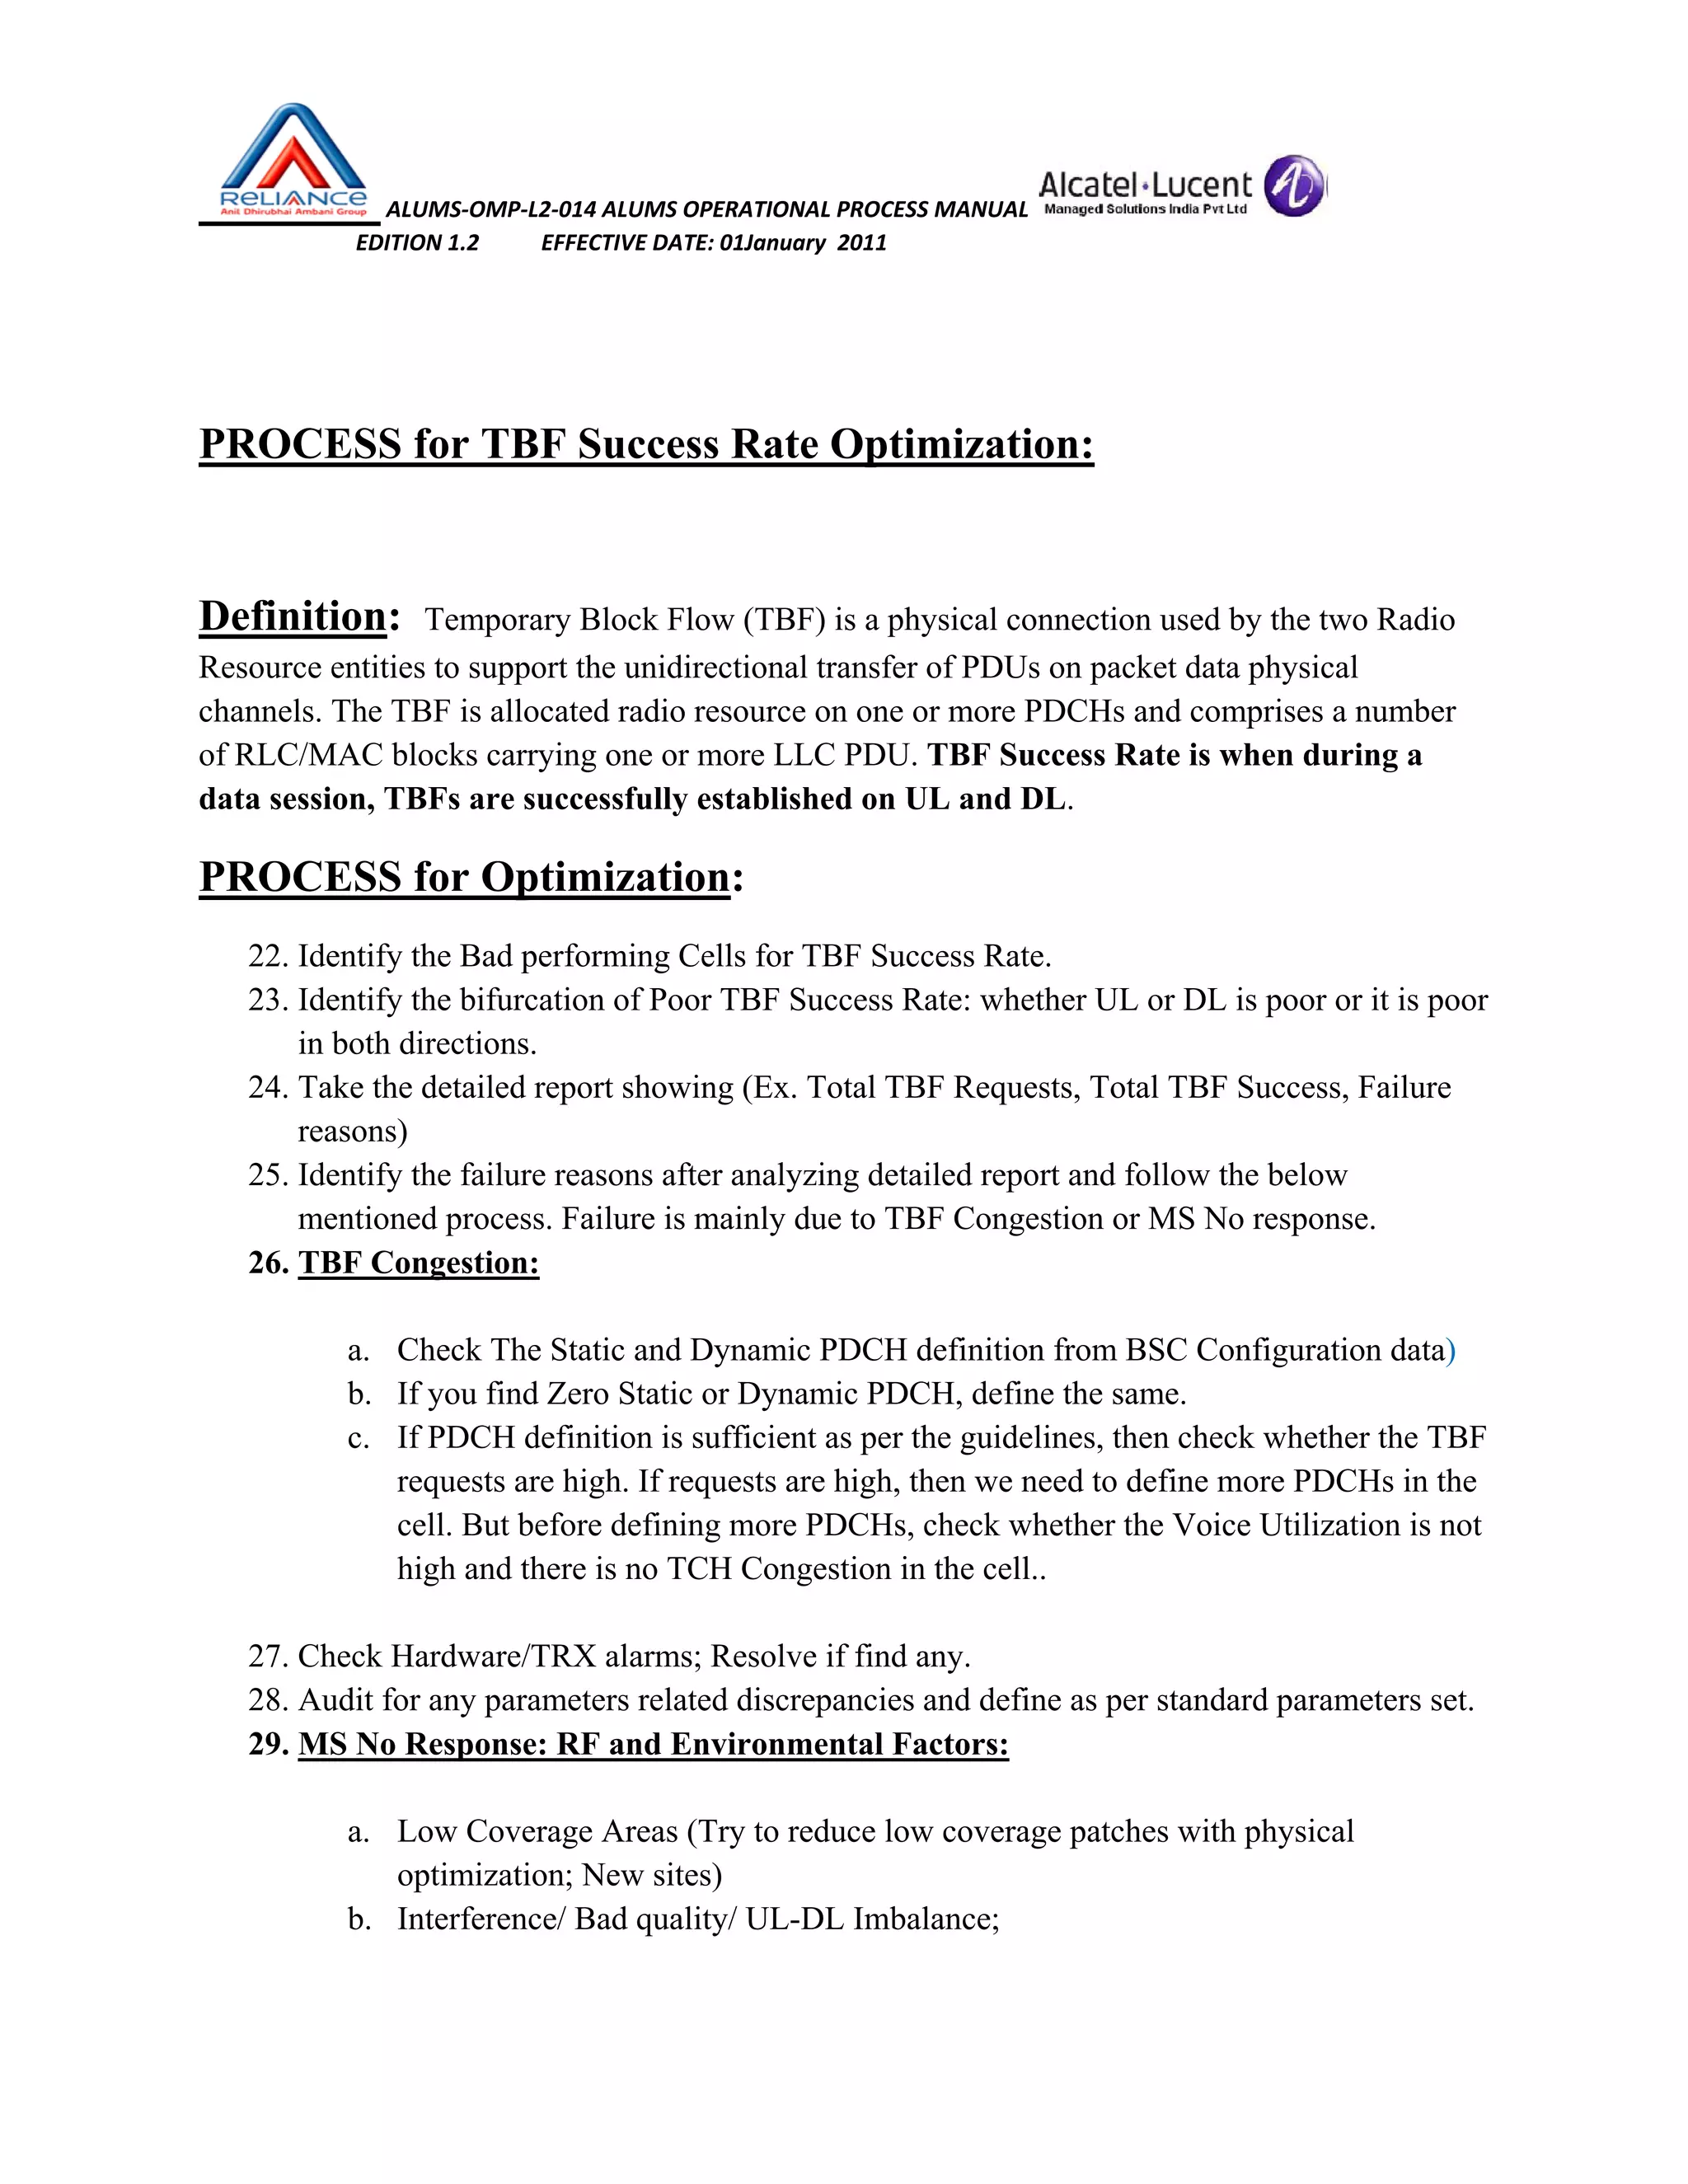
Optimization techniques for SS7 signaling load and Temporary Block Flow (TBF) success rate by managing data sessions.
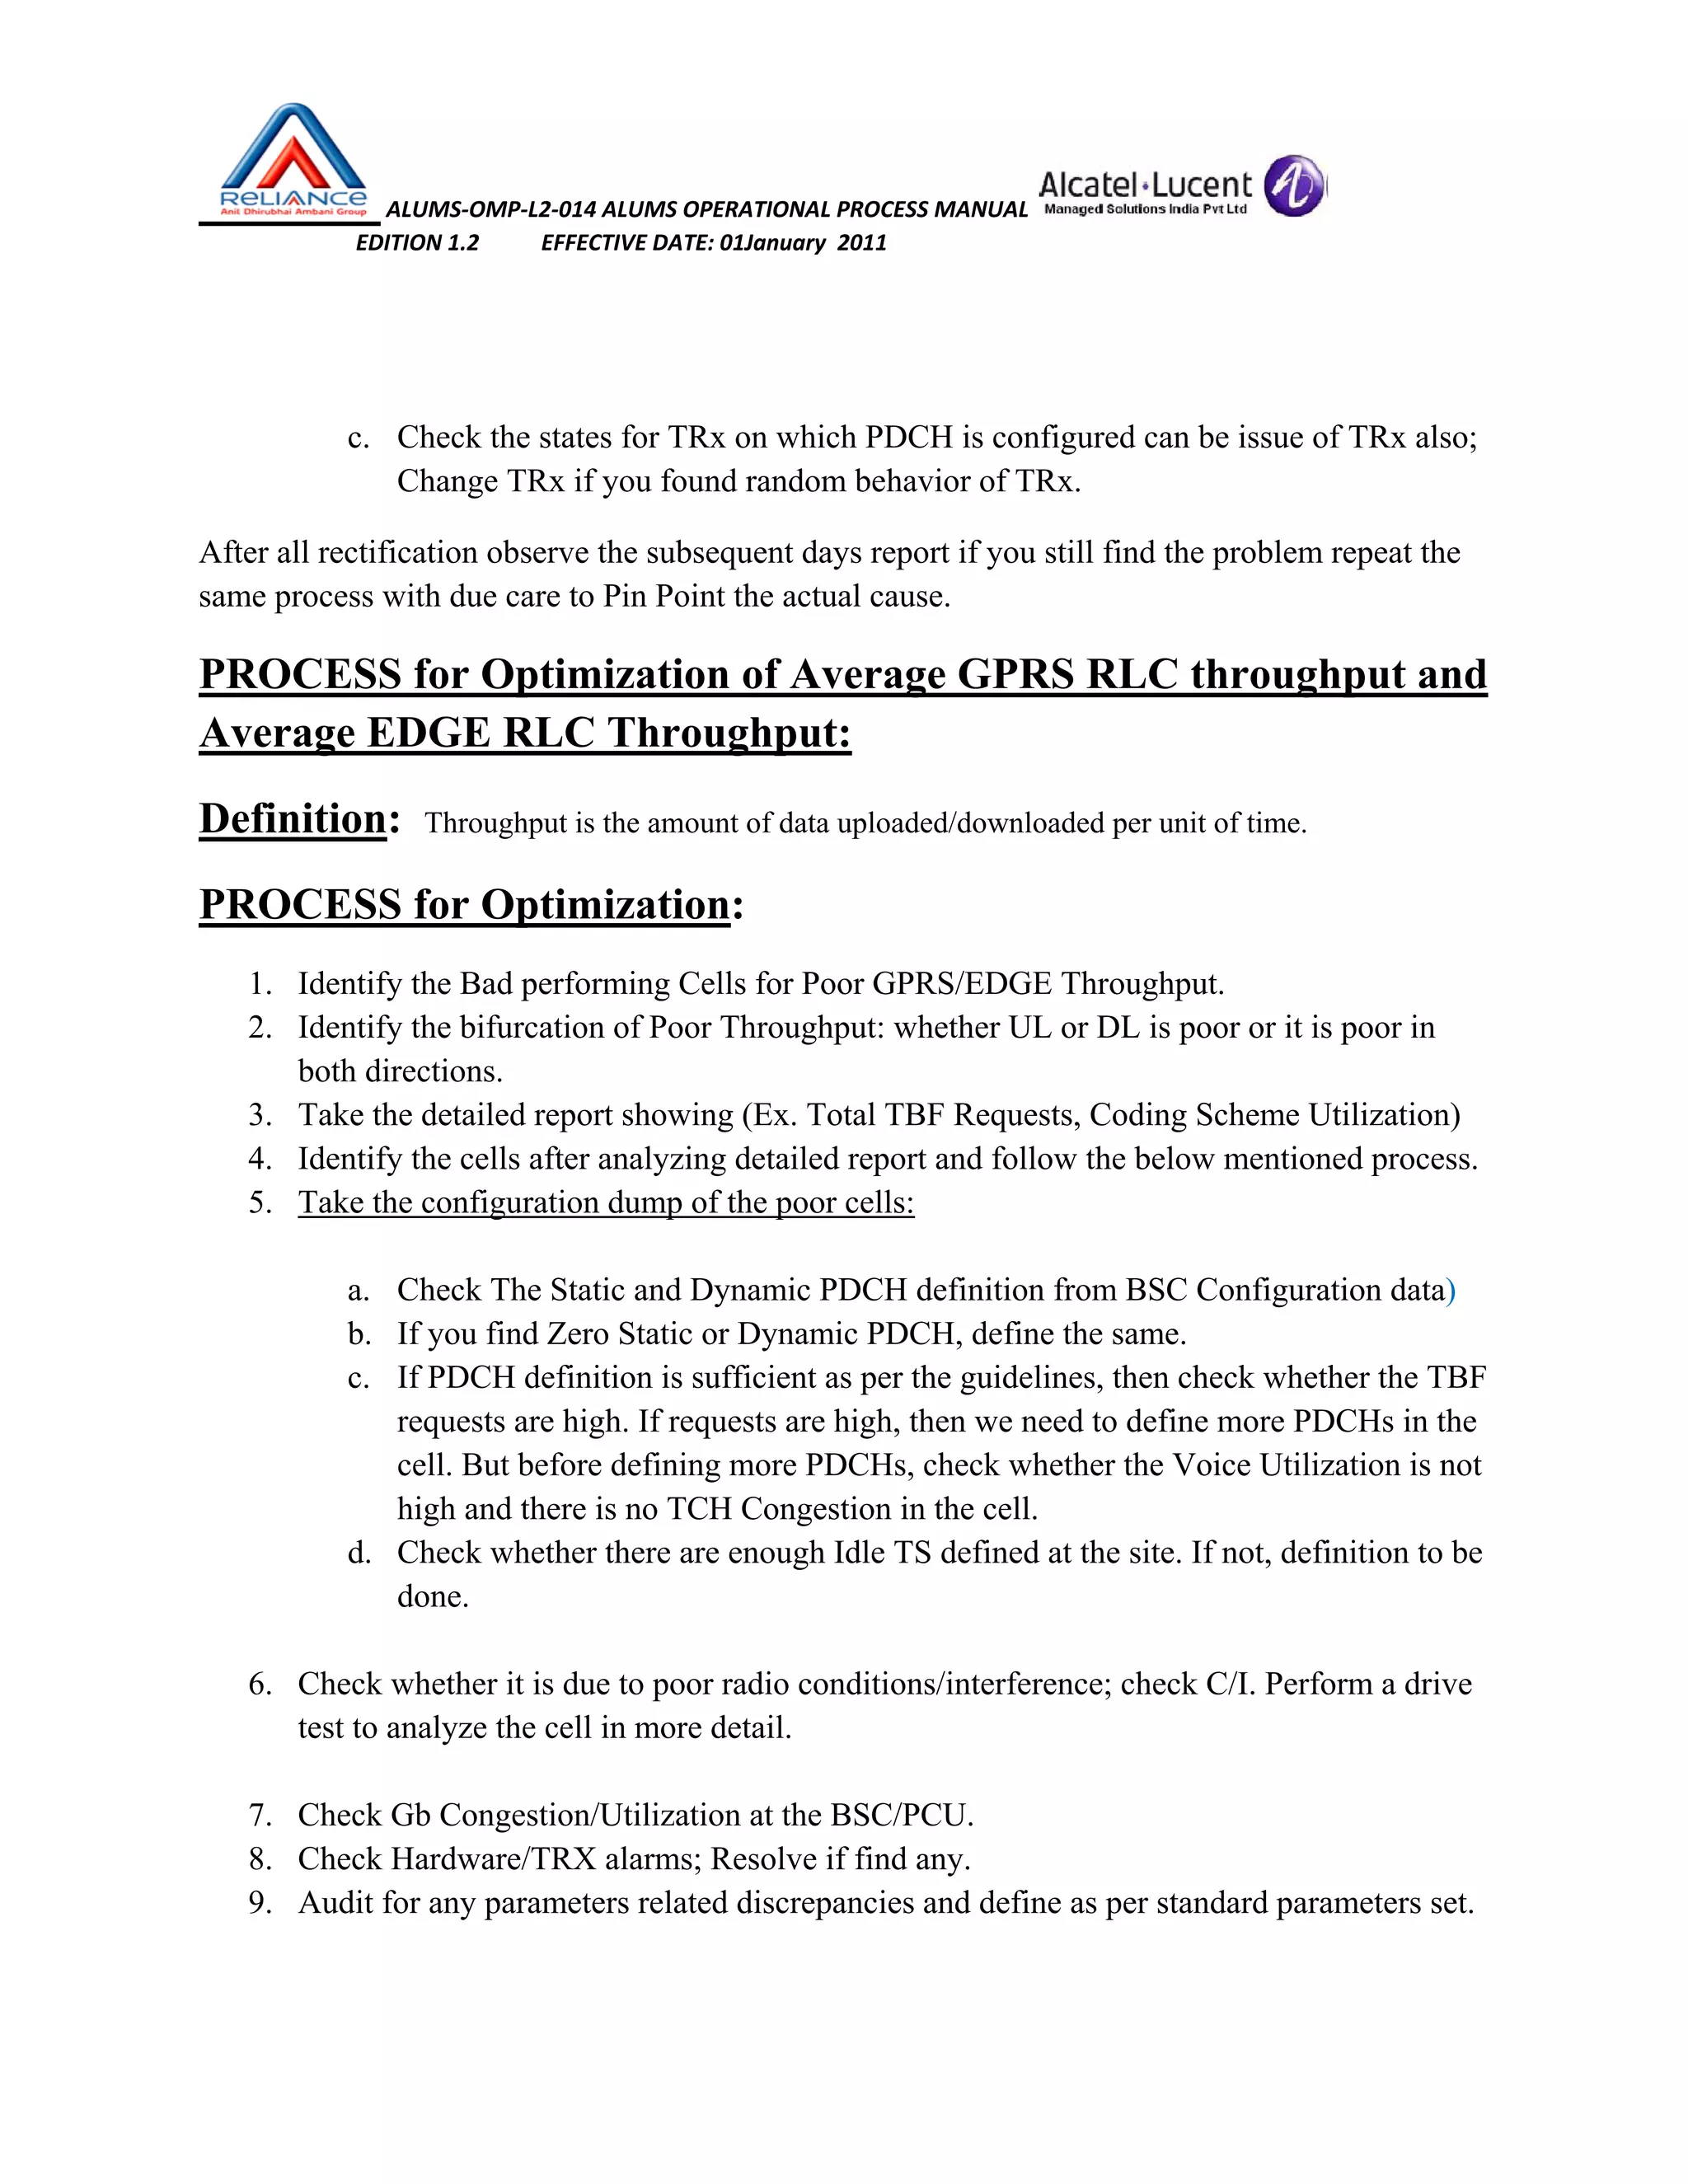
Identifying issues affecting GPRS and EDGE throughput with methods for optimization, focusing on performance monitoring.
Summarizes approaches for optimizing various KPIs in a comprehensive operational process manual for GSM.
Process for monitoring and optimizing TCH Call Drop Rate and RACH Success Rate, identifying and mitigating challenges.


![50 gsm bss network ps kpi (download rate) optimization manual[1].doc](https://cdn.slidesharecdn.com/ss_thumbnails/50gsmbssnetworkpskpidownloadrateoptimizationmanual1-140618023140-phpapp01-thumbnail.jpg?width=640&height=640&fit=bounds)


![15 gsm bss network kpi (rx quality) optimization manual[1].doc](https://cdn.slidesharecdn.com/ss_thumbnails/15gsmbssnetworkkpirxqualityoptimizationmanual1-140618022506-phpapp01-thumbnail.jpg?width=640&height=640&fit=bounds)


