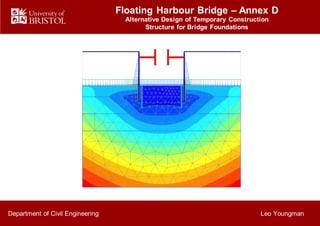
This document proposes an alternative design for constructing the foundations of a new pedestrian bridge across a harbour. It suggests using a temporary sheet pile wall cofferdam that would allow workers to build the pile group and pile cap at the riverbed level, avoiding the need for divers. The cofferdam design is sized at 10x10m and embedded 10m deep. Calculations are presented to check for piping, heaving, and structural failure. A finite element model is also used. It is determined that drains will be needed to reduce water pressures and piping risks. The design of the internal bracing structure and construction sequence are also considered. The cofferdam is concluded to be a feasible alternative construction method for the bridge

![Annex D - Alternative Design of Temporary Construction Structure for Bridge Foundations
2
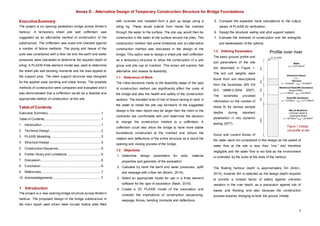
Figure 3 Flow net of seepage under cofferdam (Drawn to scale for
calculations and shown not to scale)
2 Technical Design
In order to initially size the cofferdam, a standardised tower
scaffolding system with dimensions of 2x4.5m was selected
to allow access to the 6m deep cofferdam. The dimensions
of the pile cap is approximately 5.5x3m with space for
formwork. This initial sizing also took into account an
estimate of the space taken up by the internal structural
support system and the likely shape of these walings and
struts. A widely used waling and strut pattern was selected
with diagonal struts (see Figure 2). This pattern with diagonal
struts was deemed more appropriate as the larger space in
the centre of the cofferdam would be less of a constriction on
later space requirements for the bridge pier construction.
An 8x8m cofferdam was deemed a reasonable size to be
able to function safely with clear space for safe escape
routes and some working space inside the cofferdam to
complete the construction.
2.1 Failure Mechanisms
There are a number of criteria that need to be checked
against in the design of temporary cofferdams (Tomlinson,
2001, p. 444).
1. Earth pressures and hydrostatic pressure of water
2. Failure due to base heave from water pressure
3. Failure from inwards yielding of structure
4. Failure due to soil piping under hydraulic gradients
2.2 Geotechnical Design
In the preliminary design using a flow net it was discovered
that a critical design consideration at this site was the
likelihood of piping as a result of the hydraulic gradient. A
deeper embedded depth and a wider cofferdam than the
initial size were used to attempt to solve these issues.
2.2.1 Check for Piping Failure
A cofferdam of 10x10m with an embedment of 10m gives a
safe hydraulic gradient at the toe of the corner of the
cofferdam. Refer to Figure 3 for flow net parameters.
Critical hydraulic gradient 𝑖 𝑐 ≈ 1.0 for soil with 𝛾 𝑠𝑎𝑡 = 20𝑘𝑁/𝑚3
Correction factor for corner of square cofferdam = 1.7
Hydraulic Gradient: 𝑖 𝑒 = (
𝐻1 −𝐻2
𝑁 𝑑
) ∗ (
2𝑁 𝑓
𝐵
)
From flow net: 𝑁 𝑑 = 10 𝑁𝑓 = 3 𝐵 = 10𝑚 𝐻1 = 24𝑚 𝐻2 = 18𝑚
𝑖 𝑒 = 0.612 𝐹𝑜𝑆 =
𝑖 𝑐
𝑖 𝑒
FoS against piping = 1.63 > 1.5 OK
2.2.2 Check for Heave Failure
2.2.2.1 Global Heave
Check that the uplift force from the pore water pressure
along base of the cofferdam is less than the soil weight:
Weight of soil block = [(2𝑚 ∗ 18𝑘𝑁/𝑚3)+ (3𝑚 ∗ 20𝑘𝑁/𝑚3)+
(3𝑚 ∗ 21.5𝑘𝑁/𝑚3) + (2𝑚 ∗ 20𝑘𝑁/𝑚3) ] ∗ 10𝑚 = 2005𝑘𝑁/𝑚
Average potential drop from flow net 𝑛 = 6
Potential head: 𝐻 = 𝐻1 − ( 𝐻1 − 𝐻2)
𝑛
𝑁 𝑑
Pressure: 𝑢 = ( 𝐻 − 𝑧) 𝛾 𝑤
Along base: 𝐻 𝑎𝑣 = 20.4𝑚 𝑧 = 8𝑚 above datum 𝑢 = 121.6𝑘𝑃𝑎
Uplift Force: 121.6𝑘𝑃𝑎 ∗ 10𝑚 = 1216𝑘𝑁/𝑚
FoS against heave 1216 < 2005 OK
2.2.2.2 Local Heave
Hydrostatic pressure head is used because the relatively
impermeable alluvium may not be able to let the water flow
through the soil layer quickly enough to safely take the
seepage pore water pressure as the critical design case.
Check against localised heave of the surface alluvium:
Soil pressure = 2𝑚 ∗ 18𝑘𝑁/𝑚3 = 36𝑘𝑃𝑎 Hydrostatic pressure
head is 8m: 𝑢 = 8 ∗ 9.81 = 78.5𝑘𝑃𝑎 36 < 78.5 Not OK.
The alluvium is less permeable than the underlying sandy
layers, therefore there is a significant risk of heave of the
alluvium due to the build-up of water pressure below. It was
decided that in order to mitigate the piping and heave issues,
drains are a far more effective and simpler way to deal with
the problem than increasing the length of embedment and
the width of the cofferdam.
They reduce the pore water pressure inside the cofferdam
which reduces the upwards heave from water pressures and
also reduce the hydraulic gradient at the toe of the
cofferdam. This will allow for reduced length sheet piles
which would be easier to drive into place and remove at the
end of the construction. As a result of this the initial 8x8m
cofferdam is used in the design with the provision that
pumping and drains will be required. Backup pumping
systems, warning procedures and evacuation protocols will
be required due to the critical nature of these components to
the safety of the cofferdam and the construction workers.
Figure 2 Typical plan view of waling and strut support patterns
inside a cofferdam](https://image.slidesharecdn.com/eff2e624-6e39-45f4-88fb-b06b076a1b25-160628162003/85/GROUP_6_YOUNGMAN_L_ANNEX_15-16-4-320.jpg)


![Annex D - Alternative Design of Temporary Construction Structure for Bridge Foundations
7
9 References
AccelorMittal, 2008. Piling Handbook, s.l.: s.n.
Anon., 2015. Deputy Harbour Master [Interview] (19
November 2015).
Azizi, F., 2013. Engineering Design in Geotechnics. 2nd ed.
s.l.:Fethi Azizi.
B Williams, D. W., 1993. The design and construction of
sheet pile cofferdams. s.l.:Construction Industry Research &
Information Association CIRIA.
BS EN 1997-1, 2007. Eurocode 7: Geotechnical design.
Brussels: CEN.
BS EN ISO 14688-2:2004, 2007. Geotechnical investigation
and testing-Identification and classification of soil– Part 2:
Principles for a classification.. London: British Standard
Institution.
Caquot, A. I. &. K. J., 1948. Tables for the calculation of
passive pressure, active pressure, and bearing capacity of
foundations.. Libraire du Bureau des Longitudes, p. 120.
Craig, R., 2004. Soil Mechanics. s.l.:Spon Press.
Ibraim, E., 2015. Geotechnics 3 Lecture Notes. Bristol:
Department of Civil Engineering, University of Bristol.
Müller-Breslau, H., 1906. Erddruck auf Stutzmauern.
Nash, D., 2016. Soil Structure Interaction Notes.
s.l.:Department of Civil Engineering University of Bristol .
Nemati, K., 2005. Temporary Structures – Cofferdams.
[Online]
Available at:
http://www.cv.titech.ac.jp/~courses/atce2/Lesson4.pdf.
Norman, J., 2013. Design II - Steel Design. Bristol: University
of Bristol - Department of Civil Engineering.
Peck, R., Hanson, W. & Thornburn, T., 1974. Foundation
engineering. New York: Wiley.
PLAXIS, 2011. PLAXIS 2D Anniversary Edition Reference
Manual. [Online]
Available at: http://www.plaxis.nl/plaxis2d/manuals/
Potts, D., 2001. Finite Element Analysis in Geotechnical
Engineering – Application. s.l.:Thomas Telford..
Puller, M., 1998. Deep Foundations – A Practical Manual.
s.l.:Thomas Telford.
Stroud, M., 1974. The standard penetration test in insensitive
clays and soft rocks.. Stockholm, s.n.
Tata Steel, 2016. Tata Steel Blue Book. [Online]
Available at: http://tsbluebook.steel-
sci.org/EN/Browsers/Main.htm
[Accessed 2 05 2016].
Tomlinson, M., 2001. Foundation Design & Construction.
s.l.:Prentice Hall.
Williams, B. & Waite, D., 1993. The Design and Construction
of Sheet Piled Cofferdams. London: Construction Industry
Research and Information Association.
Wood, D. M., 2004. Geotechnical Modelling. s.l.:CRC Press.
10 Acknowledgements
Some of the geotechnical parameters used in this report
were the result of work done by Vladimir Djuric, a member of
my group in the main design project. He provided me with
the soil stiffness values 𝐸 and the Poisson’s ratio 𝜈 for the
soil layers to use in the PLAXIS software. These were found
from through his research of geotechnical correlations.
I would like to thank Dr David Nash for his assistance with
the PLAXIS modelling and the geotechnical considerations of
the cofferdam. I would also like to thank my supervisor Dr
John Macdonald for his assistance and time during the whole
project.](https://image.slidesharecdn.com/eff2e624-6e39-45f4-88fb-b06b076a1b25-160628162003/85/GROUP_6_YOUNGMAN_L_ANNEX_15-16-9-320.jpg)


