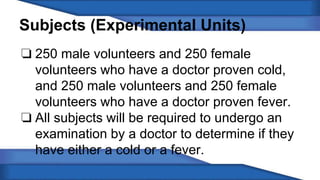
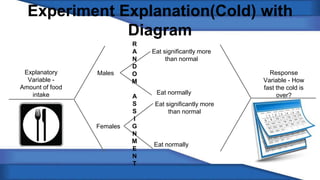
Feed A Cold and 
Starve A Fever 
A thorough experiment of sickness and health 
by Nick Arbaugh and Matthew Allen
Subjects (Experimental Units) 
❏ 250 male volunteers and 250 female 
volunteers who have a doctor proven cold, 
and 250 male volunteers and 250 female 
volunteers who have a doctor proven fever. 
❏ All subjects will be required to undergo an 
examination by a doctor to determine if they 
have either a cold or a fever.
Explanatory Variables/ Factors 
❏ Categorical 
❏ A change in the amount of food one eats 
when one has a fever or a cold. In this case, 
a lack of food when you have a fever, and an 
increase in food when you have a cold.
Treatments (Factor Levels) 
The varied amounts of food consumed by 
volunteers with the different afflictions. 
Cold - 
1. Eat significantly more than usually 
2. Eat normally 
Fever - 
1. Eat significantly less than usually 
2. Eat normally
Response Variables/Factors are 
❏ Quantitative 
❏ The amount of time it takes in days from 
when the treatment is given until the subject 
is given a clean bill of health from a 
physician.
Experiment Explanation(Cold) with 
Diagram 
Explanatory 
Variable - 
Amount of food 
intake 
Males 
Females 
Eat significantly more 
than normal 
Eat normally 
Eat significantly more 
than normal 
Eat normally 
Response 
Variable - How 
fast the cold is 
over? 
R 
A 
N 
D 
O 
M 
A 
S 
S 
I 
G 
N 
M 
E 
N 
T
Experiment Explanation(Fever) with 
Diagram 
Response 
Variable - How 
fast the fever is 
over? 
Males 
Females 
Eat significantly less than 
normal 
Eat normally 
Eat significantly less than 
normal 
Eat normally 
R 
A 
N 
D 
O 
M 
A 
S 
S 
I 
G 
N 
M 
E 
N 
T 
Explanatory 
Variable - 
Amount of food 
intake
Experimental Design Principals 
❏ Control - 1 group given no treatment in each part of the 
experiment (control groups). Volunteers will be utilized which 
means they are more willing to participate in the experiment, 
consequently decreasing confounding variables. 
❏ Randomization - to determine if they were going to be in the 
control or experimental group was done by randomization, 
the use of chance to assign subjects to treatments. 
❏ Replication - we will do the experiment several times to 
increase validity, as well as having a large number (500) 
people in each part of the experiment
Blocking? 
We would break each separate group of 
subjects into male and female subgroups in 
order to examine the effects our methods have 
on each gender. This way we will be able to 
determine if the different gender has an impact 
on the response variable, being how fast they 
get better.
Blinding? 
This experiment cannot be blinded to the 
volunteers because they will have to know how 
much (or little) food they are consuming. 
However, the researchers can be blinded 
allowing for less bias results and an increase in 
the validity of the experiment.
Experiment concerns 
❏ High variability due to people’s different 
immune systems and their different 
tolerance levels to pain or discomfort. 
❏ The amount of “significantly more than 
normal” and “significantly less than normal” 
can mean completely different things for 
different people, therefore skewing results.

Group ff

  • 1.
    Feed A Coldand Starve A Fever A thorough experiment of sickness and health by Nick Arbaugh and Matthew Allen
  • 2.
    Subjects (Experimental Units) ❏ 250 male volunteers and 250 female volunteers who have a doctor proven cold, and 250 male volunteers and 250 female volunteers who have a doctor proven fever. ❏ All subjects will be required to undergo an examination by a doctor to determine if they have either a cold or a fever.
  • 3.
    Explanatory Variables/ Factors ❏ Categorical ❏ A change in the amount of food one eats when one has a fever or a cold. In this case, a lack of food when you have a fever, and an increase in food when you have a cold.
  • 4.
    Treatments (Factor Levels) The varied amounts of food consumed by volunteers with the different afflictions. Cold - 1. Eat significantly more than usually 2. Eat normally Fever - 1. Eat significantly less than usually 2. Eat normally
  • 5.
    Response Variables/Factors are ❏ Quantitative ❏ The amount of time it takes in days from when the treatment is given until the subject is given a clean bill of health from a physician.
  • 6.
    Experiment Explanation(Cold) with Diagram Explanatory Variable - Amount of food intake Males Females Eat significantly more than normal Eat normally Eat significantly more than normal Eat normally Response Variable - How fast the cold is over? R A N D O M A S S I G N M E N T
  • 7.
    Experiment Explanation(Fever) with Diagram Response Variable - How fast the fever is over? Males Females Eat significantly less than normal Eat normally Eat significantly less than normal Eat normally R A N D O M A S S I G N M E N T Explanatory Variable - Amount of food intake
  • 8.
    Experimental Design Principals ❏ Control - 1 group given no treatment in each part of the experiment (control groups). Volunteers will be utilized which means they are more willing to participate in the experiment, consequently decreasing confounding variables. ❏ Randomization - to determine if they were going to be in the control or experimental group was done by randomization, the use of chance to assign subjects to treatments. ❏ Replication - we will do the experiment several times to increase validity, as well as having a large number (500) people in each part of the experiment
  • 9.
    Blocking? We wouldbreak each separate group of subjects into male and female subgroups in order to examine the effects our methods have on each gender. This way we will be able to determine if the different gender has an impact on the response variable, being how fast they get better.
  • 10.
    Blinding? This experimentcannot be blinded to the volunteers because they will have to know how much (or little) food they are consuming. However, the researchers can be blinded allowing for less bias results and an increase in the validity of the experiment.
  • 11.
    Experiment concerns ❏High variability due to people’s different immune systems and their different tolerance levels to pain or discomfort. ❏ The amount of “significantly more than normal” and “significantly less than normal” can mean completely different things for different people, therefore skewing results.